
14 KiB
Name
动态RSI双均线买卖策略Dynamic-RSI-and-Dual-Moving-Average-Buy-Sell-Strategy
Author
ChaoZhang
Strategy Description
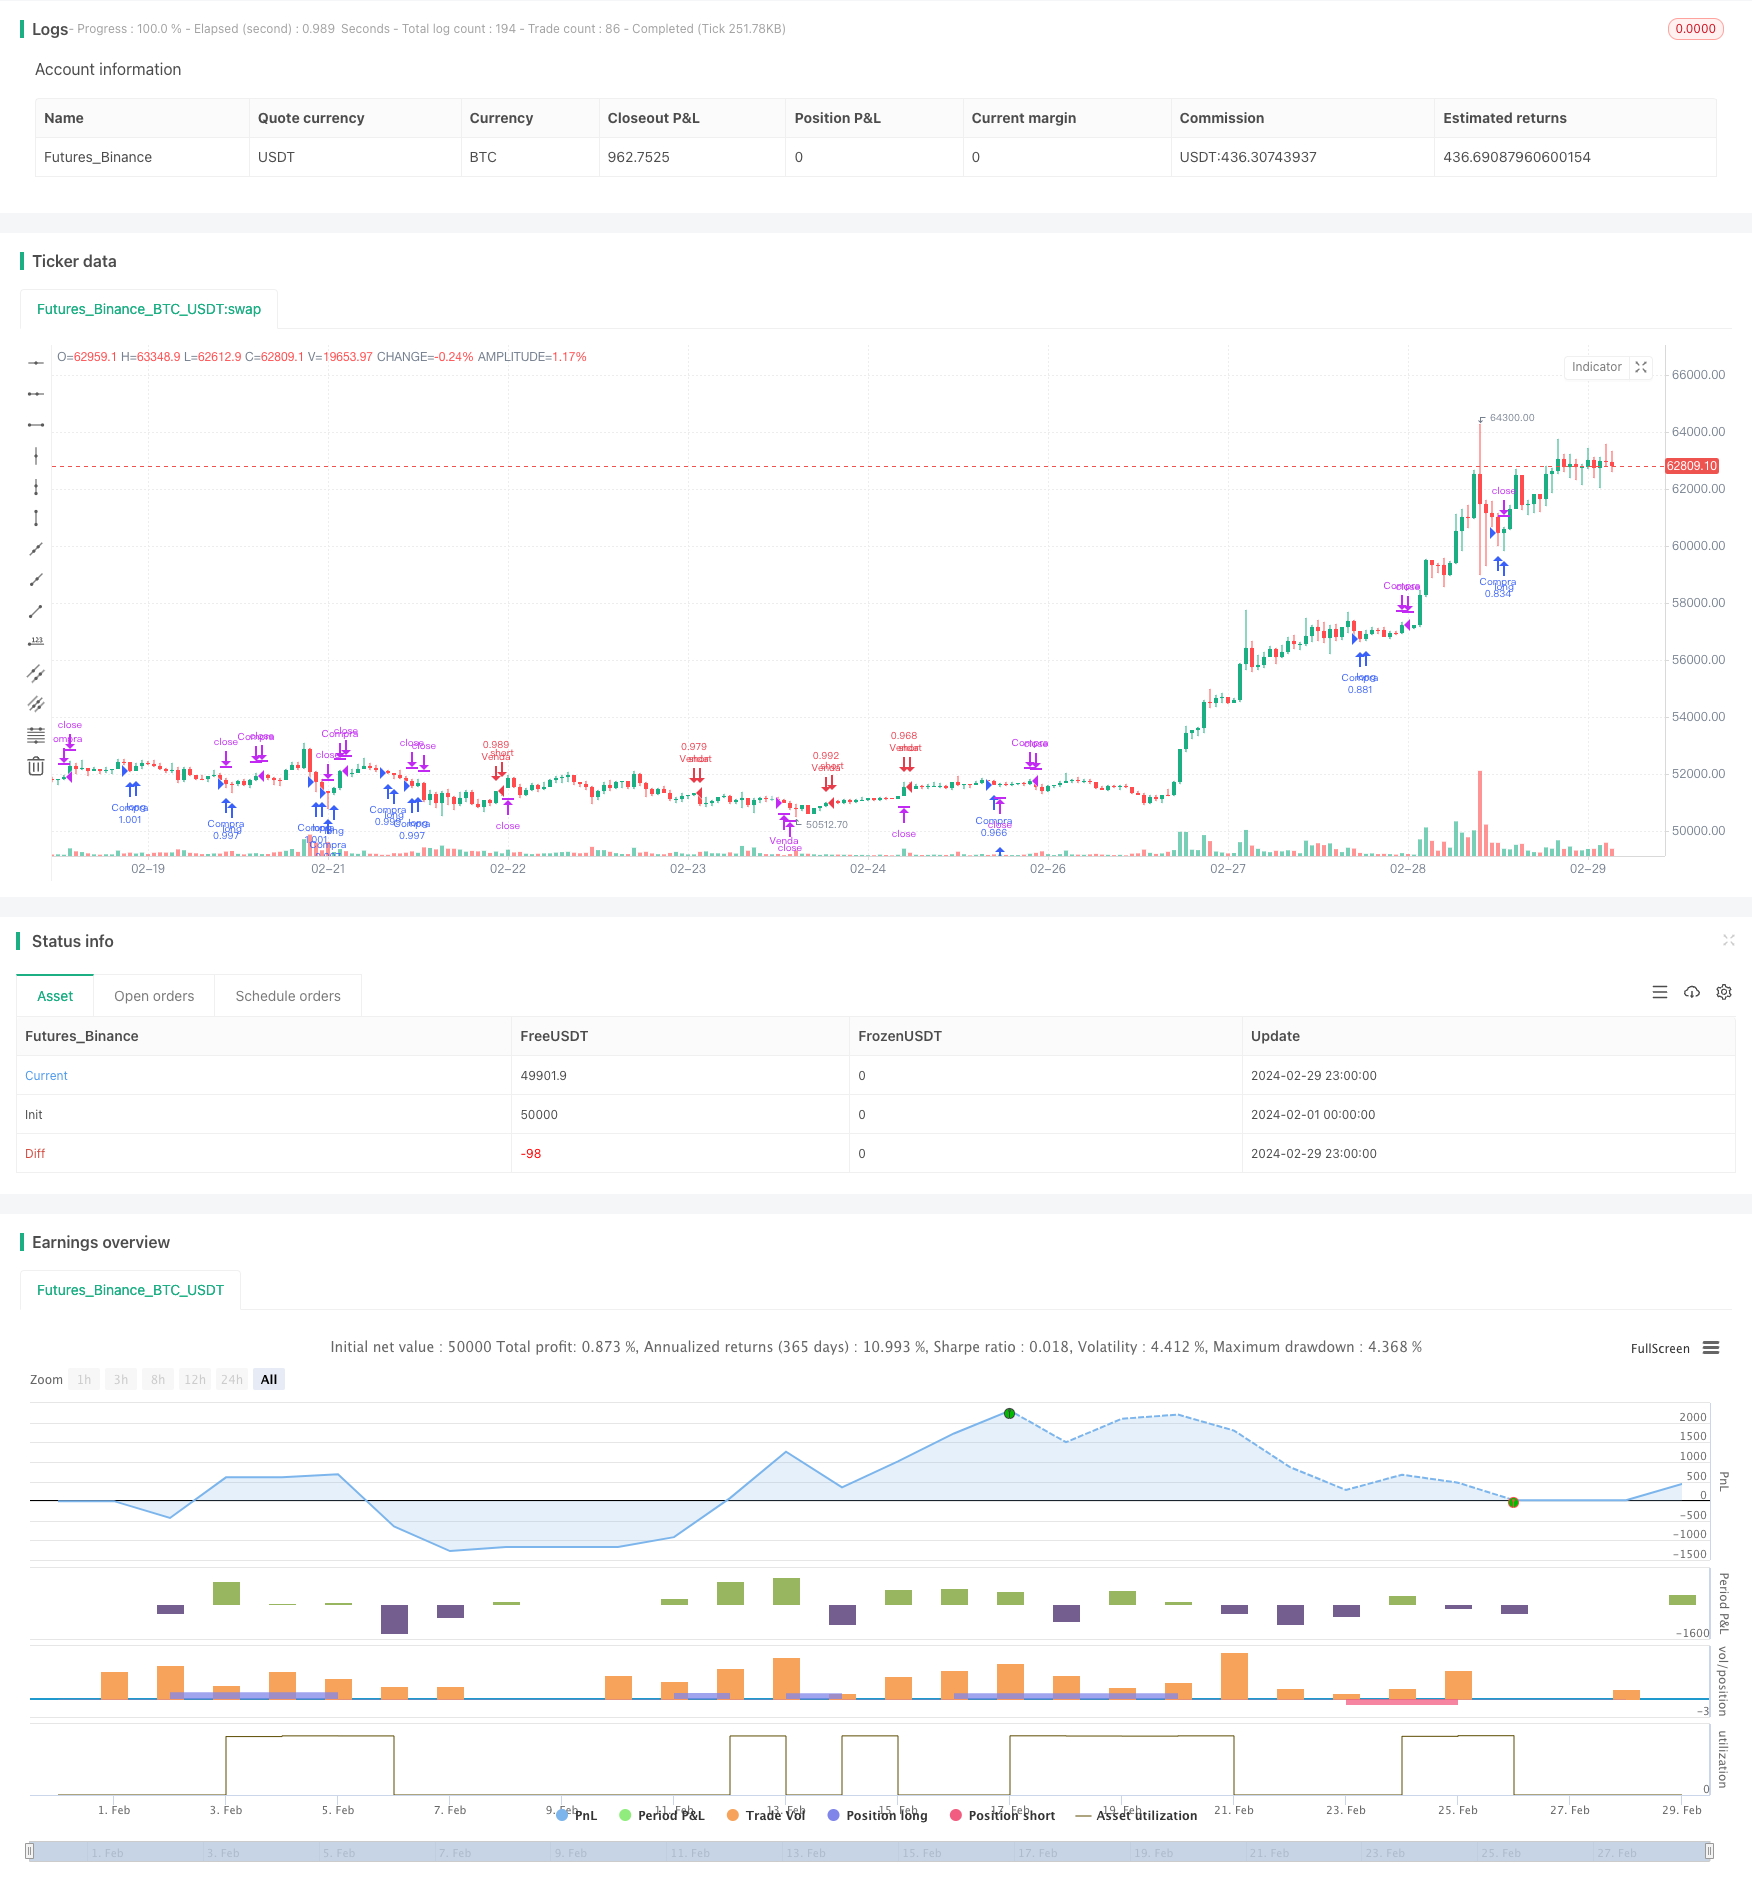 [trans]
策略概述(Strategy Overview)
动态RSI双均线买卖策略是一种结合相对强弱指标(RSI)、简单移动平均线(SMA)和指数移动平均线(EMA)的量化交易策略。该策略旨在捕捉潜在的买入和卖出信号,以实现在市场中获利。策略通过分析RSI、SMA和EMA之间的关系,根据预定义的条件触发买入和卖出操作。同时,该策略还引入了止盈、止损和移动止损等风险管理措施,以控制潜在的损失和保护已获得的利润。
策略原理(Strategy Principles)
该策略的核心原理是利用RSI、SMA和EMA三个技术指标之间的关系来判断市场趋势和买卖时机。具体来说:
-
当2周期的RSI小于等于20,且当前收盘价大于等于200周期的SMA,同时当前收盘价大于等于20周期的EMA时,触发买入信号。这表明市场可能处于超卖状态,且当前价格高于长期和中期均线,因此可能是买入的好时机。
-
当80周期的EMA出现,且2周期的RSI大于等于80时,触发卖出信号。这表明市场可能处于超买状态,且当前价格低于长期均线,因此可能是卖出的好时机。
-
当2周期的RSI大于等于80,且当前收盘价小于等于200周期的SMA,同时当前收盘价小于等于80周期的EMA时,触发做空信号。这表明市场可能处于超买状态,且当前价格低于长期和中期均线,因此可能是做空的好时机。
-
当最低价小于等于20周期的EMA,且2周期的RSI小于等于10时,触发平仓做空头寸的信号。这表明市场可能即将反转向上,因此应该平仓空头头寸以规避风险。
除了买卖信号外,该策略还引入了止盈、止损和移动止损等风险管理措施。用户可以根据自己的风险偏好,设置相应的止盈、止损和移动止损水平。这有助于控制潜在损失并保护已获得的利润。
策略优势(Strategy Advantages)
-
结合多个技术指标:该策略综合考虑了RSI、SMA和EMA三个常用的技术指标,从多个角度分析市场趋势和买卖时机,提高了策略的可靠性。
-
引入风险管理措施:通过设置止盈、止损和移动止损水平,策略可以有效控制潜在损失并保护已获得的利润,增强了策略的风险管理能力。
-
参数可调:用户可以根据自己的偏好和市场特点,调整策略中的各项参数,如RSI周期、SMA和EMA周期、止盈止损水平等,以适应不同的交易风格和市场环境。
-
适用性广:该策略可以应用于各类金融市场,如股票、期货、外汇等,具有较强的通用性和适用性。
策略风险(Strategy Risks)
-
参数设置风险:不恰当的参数设置可能导致策略性能下降,甚至产生较大损失。因此,在使用该策略时,需要仔细评估和优化参数,以确保策略的稳健性。
-
市场风险:该策略基于历史数据和特定的技术指标,在市场发生重大变化或出现黑天鹅事件时,策略可能无法及时适应,从而导致损失。因此,需要密切关注市场动态,必要时对策略进行调整。
-
过拟合风险:如果策略参数过于复杂或针对特定历史数据进行优化,可能导致策略过拟合,在实际应用中表现不佳。因此,在开发和优化策略时,需要注意控制过拟合风险。
策略优化(Strategy Optimization)
-
动态调整参数:根据市场变化和策略表现,动态调整策略参数,如RSI周期、SMA和EMA周期、止盈止损水平等,以适应不同的市场环境和提高策略的稳健性。
-
引入其他技术指标:考虑引入其他有效的技术指标,如布林带、MACD等,以丰富策略的分析维度,提高买卖信号的可靠性。
-
结合基本面分析:将基本面分析与技术分析相结合,在判断买卖时机时,考虑宏观经济、行业趋势、公司业绩等基本面因素,以提高策略的全面性和准确性。
-
加强风险管理:优化风险管理措施,如引入多级止损、动态止损、风险平价等方法,以更好地控制风险并保护资金安全。
-
回测和实盘优化:定期进行策略回测和实盘交易,分析策略在不同市场条件下的表现,及时发现和解决潜在问题,不断优化和完善策略。
总结(Summary)
动态RSI双均线买卖策略是一种结合RSI、SMA和EMA等技术指标的量化交易策略。该策略通过分析指标之间的关系,根据预定义的条件触发买入和卖出操作,同时引入止盈、止损和移动止损等风险管理措施。策略的优势在于综合考虑多个技术指标、引入风险管理措施、参数可调、适用性广等。但在实际应用中,需要注意参数设置风险、市场风险和过拟合风险等潜在问题。为了进一步提升策略的性能和稳健性,可以考虑动态调整参数、引入其他技术指标、结合基本面分析、加强风险管理等优化措施。此外,定期进行回测和实盘交易分析,不断优化和完善策略,也是确保策略长期有效的重要方法。
||
Strategy Overview
The Dynamic RSI and Dual Moving Average Buy/Sell Strategy is a quantitative trading strategy that combines the Relative Strength Index (RSI), Simple Moving Average (SMA), and Exponential Moving Average (EMA). The strategy aims to capture potential buy and sell signals to profit in the market. By analyzing the relationships between RSI, SMA, and EMA, the strategy triggers buy and sell operations based on predefined conditions. Additionally, the strategy incorporates risk management measures such as take profit, stop loss, and trailing stop loss to control potential losses and protect gained profits.
Strategy Principles
The core principle of this strategy is to utilize the relationships among RSI, SMA, and EMA to determine market trends and timing for buying and selling. Specifically:
-
When the 2-period RSI is less than or equal to 20, the current closing price is greater than or equal to the 200-period SMA, and the current closing price is greater than or equal to the 20-period EMA, a buy signal is triggered. This indicates that the market may be in an oversold state, and the current price is above the long-term and mid-term moving averages, suggesting a potentially good buying opportunity.
-
When the 80-period EMA appears and the 2-period RSI is greater than or equal to 80, a sell signal is triggered. This suggests that the market may be in an overbought state, and the current price is below the long-term moving average, indicating a potentially good selling opportunity.
-
When the 2-period RSI is greater than or equal to 80, the current closing price is less than or equal to the 200-period SMA, and the current closing price is less than or equal to the 80-period EMA, a short selling signal is triggered. This indicates that the market may be in an overbought state, and the current price is below the long-term and mid-term moving averages, suggesting a potentially good opportunity for short selling.
-
When the lowest price is less than or equal to the 20-period EMA and the 2-period RSI is less than or equal to 10, a signal to close the short position is triggered. This suggests that the market may be about to reverse upward, and therefore, the short position should be closed to avoid risk.
In addition to buy and sell signals, the strategy incorporates risk management measures such as take profit, stop loss, and trailing stop loss. Users can set corresponding take profit, stop loss, and trailing stop loss levels according to their risk preferences. This helps control potential losses and protect gained profits.
Strategy Advantages
-
Combination of multiple technical indicators: The strategy comprehensively considers three commonly used technical indicators: RSI, SMA, and EMA. It analyzes market trends and timing for buying and selling from multiple perspectives, enhancing the reliability of the strategy.
-
Introduction of risk management measures: By setting take profit, stop loss, and trailing stop loss levels, the strategy effectively controls potential losses and protects gained profits, strengthening the risk management capability of the strategy.
-
Adjustable parameters: Users can adjust various parameters in the strategy, such as RSI period, SMA and EMA periods, take profit and stop loss levels, according to their preferences and market characteristics, to adapt to different trading styles and market environments.
-
Wide applicability: The strategy can be applied to various financial markets, such as stocks, futures, and forex, demonstrating strong versatility and applicability.
Strategy Risks
-
Parameter setting risk: Improper parameter settings may lead to a decline in strategy performance or even significant losses. Therefore, when using this strategy, it is necessary to carefully evaluate and optimize parameters to ensure the robustness of the strategy.
-
Market risk: The strategy is based on historical data and specific technical indicators. When significant changes occur in the market or black swan events emerge, the strategy may not be able to adapt in a timely manner, resulting in losses. Therefore, it is necessary to closely monitor market dynamics and make adjustments to the strategy when necessary.
-
Overfitting risk: If the strategy parameters are too complex or optimized for specific historical data, it may lead to overfitting, resulting in poor performance in actual application. Therefore, when developing and optimizing the strategy, it is important to control the overfitting risk.
Strategy Optimization
-
Dynamic parameter adjustment: Based on market changes and strategy performance, dynamically adjust strategy parameters, such as RSI period, SMA and EMA periods, take profit and stop loss levels, to adapt to different market environments and improve the robustness of the strategy.
-
Introduction of other technical indicators: Consider introducing other effective technical indicators, such as Bollinger Bands, MACD, etc., to enrich the analysis dimensions of the strategy and improve the reliability of buy and sell signals.
-
Combination with fundamental analysis: Combine fundamental analysis with technical analysis. When determining the timing for buying and selling, consider fundamental factors such as macroeconomics, industry trends, and company performance to improve the comprehensiveness and accuracy of the strategy.
-
Enhanced risk management: Optimize risk management measures, such as introducing multi-level stop loss, dynamic stop loss, risk parity, etc., to better control risks and protect capital safety.
-
Backtesting and live trading optimization: Regularly conduct strategy backtesting and live trading, analyze the performance of the strategy under different market conditions, promptly identify and resolve potential issues, and continuously optimize and refine the strategy.
Summary
The Dynamic RSI and Dual Moving Average Buy/Sell Strategy is a quantitative trading strategy that combines technical indicators such as RSI, SMA, and EMA. The strategy analyzes the relationships among indicators and triggers buy and sell operations based on predefined conditions while incorporating risk management measures such as take profit, stop loss, and trailing stop loss. The advantages of the strategy include considering multiple technical indicators, introducing risk management measures, adjustable parameters, wide applicability, etc. However, in actual application, it is necessary to pay attention to potential risks such as parameter setting risk, market risk, and overfitting risk. To further improve the performance and robustness of the strategy, optimization measures such as dynamic parameter adjustment, introduction of other technical indicators, combination with fundamental analysis, enhanced risk management, etc., can be considered. Additionally, regularly conducting backtesting and live trading analysis, continuously optimizing and refining the strategy, is also an important method to ensure the long-term effectiveness of the strategy. [/trans]
Strategy Arguments
| Argument | Default | Description |
|---|---|---|
| v_input_int_1 | 100000000 | Take Profit |
| v_input_int_2 | 5000 | Stop Loss |
| v_input_int_3 | 1000 | Trailing Stop Loss |
| v_input_int_4 | false | Trailing Stop Loss Offset |
Source (PineScript)
/*backtest
start: 2024-02-01 00:00:00
end: 2024-02-29 23:59:59
period: 1h
basePeriod: 15m
exchanges: [{"eid":"Futures_Binance","currency":"BTC_USDT"}]
*/

//@version=5
strategy("ag7 buy sell", overlay=true, default_qty_type = strategy.percent_of_equity, default_qty_value = 100)

inpTakeProfit   = input.int(defval = 100000000, title = "Take Profit", minval = 0)
inpStopLoss     = input.int(defval = 5000, title = "Stop Loss", minval = 0)
inpTrailStop    = input.int(defval = 1000, title = "Trailing Stop Loss", minval = 0)
inpTrailOffset  = input.int(defval = 0, title = "Trailing Stop Loss Offset", minval = 0)

useTakeProfit   = inpTakeProfit  >= 1 ? inpTakeProfit  : na
useStopLoss     = inpStopLoss    >= 1 ? inpStopLoss    : na
useTrailStop    = inpTrailStop   >= 1 ? inpTrailStop   : na
useTrailOffset  = inpTrailOffset >= 1 ? inpTrailOffset : na

longEntry() =>
    ta.rsi(close, 2) <= 20 and close >= ta.sma(close, 200) and ta.ema(close, 20)
longExit() =>
    ta.ema(close, 80) and ta.rsi(close, 2) >= 80

strategy.entry("Compra", strategy.long, when = longEntry())
strategy.close("Compra", when = longExit())
strategy.exit("Feche a ordem", from_entry = "Venda", profit = useTakeProfit, loss = useStopLoss, trail_points = useTrailStop, trail_offset = useTrailOffset)

shortEntry() =>
    ta.rsi(close, 2) >= 80 and close <= ta.sma(close, 200) and ta.ema(close, 80)
shortExit() =>
    low <= ta.ema(close, 20) and ta.rsi(close, 2) <= 10

strategy.entry("Venda", strategy.short, when = shortEntry())
strategy.close("Venda", when = shortExit())
strategy.exit("feche a ordem", from_entry = "Compra", profit = useTakeProfit, loss = useStopLoss, trail_points = useTrailStop, trail_offset = useTrailOffset)
Detail
https://www.fmz.com/strategy/444959
Last Modified
2024-03-15 14:36:30