
7.7 KiB
Name
动态RSI与PSAR交叉策略结合风险管理系统-Dynamic-RSI-and-PSAR-Crossover-Strategy-with-Risk-Management-System
Author
ianzeng123
Strategy Description
[trans]
概述
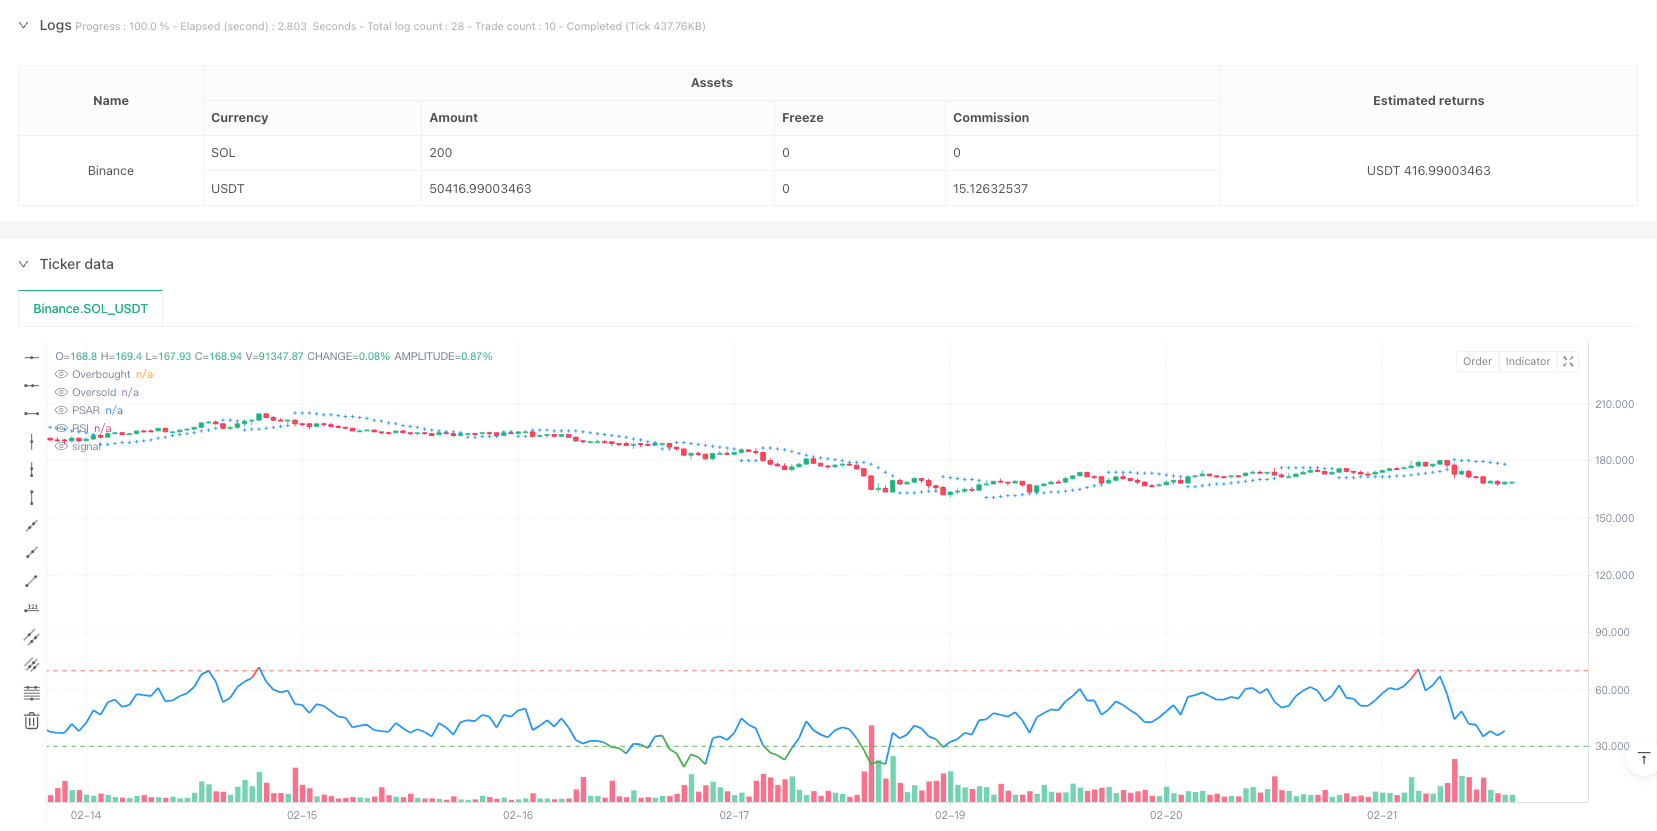
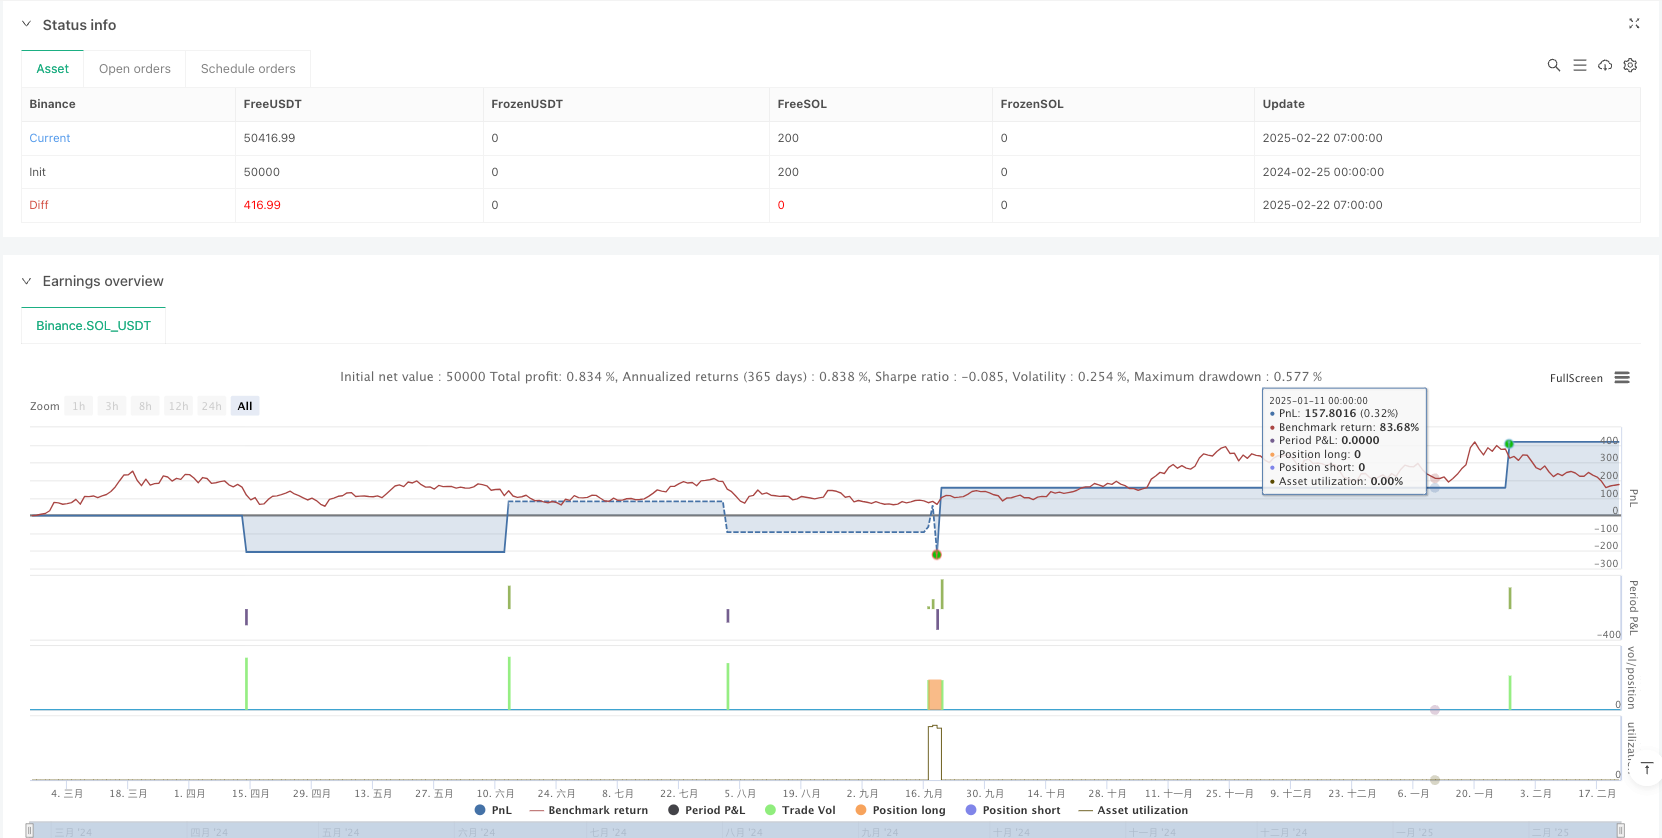
这是一个结合了RSI指标和抛物线转向指标(PSAR)的交易策略,通过设定动态的超买超卖区间,配合价格与PSAR的交叉信号来捕捉市场趋势。同时,该策略集成了完善的风险管理系统,包括止盈止损机制和仓位管理,以实现更稳健的交易表现。
策略原理
策略主要基于以下核心逻辑:
- 入场信号:当价格向上突破PSAR且RSI处于超卖区间(<30)时,系统发出做多信号
- 出场信号:当价格向下跌破PSAR且RSI处于超买区间(>70)时,系统发出平仓信号
- 风险控制:对每笔交易设置5%的止盈和3%的止损,可根据实际需求调整
- 信号可视化:RSI指标通过动态颜色编码(绿色表示超卖,红色表示超买,蓝色表示中性)直观显示市场状态
- 交易提醒:在触发买卖信号时自动发出交易提醒
策略优势
- 信号可靠性:通过结合PSAR和RSI双重确认,有效降低虚假信号
- 风险可控:内置止盈止损机制,限制单笔交易损失
- 操作清晰:可视化界面设计,交易信号直观明确
- 适应性强:参数可调整,适用于不同市场环境
- 自动化程度高:支持自动交易和回测分析
策略风险
- 震荡市不适用:在横盘震荡市场可能产生频繁交易
- 滑点影响:高波动率环境下可能面临较大滑点风险
- 参数敏感:不同参数组合可能导致策略表现差异较大
- 止损风险:固定止损位可能在某些市场条件下不够灵活
- 信号滞后:指标本身具有一定滞后性,可能错过最佳入场时机
策略优化方向
- 引入市场环境判断:增加趋势强度指标,在不同市场环境下采用不同参数
- 动态止损设置:根据市场波动率自动调整止损位置
- 优化仓位管理:引入动态仓位管理系统,根据风险评估调整开仓比例
- 增加时间过滤:加入交易时间窗口,避免在不利时段交易
- 信号确认机制:增加成交量等辅助指标,提高信号可靠性
总结
该策略通过结合PSAR和RSI指标,建立了一个完整的交易系统。其优势在于信号清晰、风险可控,但仍需注意市场环境的适应性。通过持续优化和参数调整,策略有望实现更好的交易效果。建议在实盘交易前进行充分的回测验证,并根据具体市场特点调整参数设置。 ||
Overview
This is a trading strategy that combines the RSI indicator with the Parabolic SAR (PSAR) indicator, capturing market trends through dynamic overbought/oversold zones and PSAR crossover signals. The strategy incorporates a comprehensive risk management system, including take-profit and stop-loss mechanisms, along with position management for more robust trading performance.
Strategy Principles
The strategy is based on the following core logic:
- Entry Signal: Long position triggered when price crosses above PSAR and RSI is in oversold territory (<30)
- Exit Signal: Position closed when price crosses below PSAR and RSI is in overbought territory (>70)
- Risk Control: 5% take-profit and 3% stop-loss for each trade, adjustable based on requirements
- Signal Visualization: RSI indicator with dynamic color coding (green for oversold, red for overbought, blue for neutral) for intuitive market state display
- Trade Alerts: Automatic notifications when buy/sell signals are triggered
Strategy Advantages
- Signal Reliability: Reduces false signals through dual confirmation with PSAR and RSI
- Risk Control: Built-in take-profit and stop-loss mechanisms limit single trade losses
- Clear Operation: Visual interface design provides intuitive trading signals
- High Adaptability: Adjustable parameters suit different market conditions
- High Automation: Supports automated trading and backtesting analysis
Strategy Risks
- Unsuitable for Ranging Markets: May generate frequent trades in sideways markets
- Slippage Impact: Potential significant slippage risk in high volatility environments
- Parameter Sensitivity: Different parameter combinations may lead to varying strategy performance
- Stop Loss Risk: Fixed stop-loss levels may lack flexibility in certain market conditions
- Signal Lag: Indicators have inherent lag, possibly missing optimal entry points
Strategy Optimization Directions
- Market Environment Assessment: Add trend strength indicators for parameter adaptation
- Dynamic Stop-Loss: Automatically adjust stop-loss levels based on market volatility
- Position Management Optimization: Implement dynamic position sizing based on risk assessment
- Time Filtering: Add trading time windows to avoid unfavorable periods
- Signal Confirmation: Include volume and other auxiliary indicators to improve signal reliability
Summary
The strategy establishes a complete trading system by combining PSAR and RSI indicators. Its strengths lie in clear signals and controlled risk, though market environment adaptability requires attention. Through continuous optimization and parameter adjustment, the strategy can achieve better trading results. It's recommended to conduct thorough backtesting before live trading and adjust parameters according to specific market characteristics.[/trans]
Source (PineScript)
/*backtest
start: 2024-02-25 00:00:00
end: 2025-02-22 08:00:00
period: 1h
basePeriod: 1h
exchanges: [{"eid":"Binance","currency":"SOL_USDT"}]
*/

//@version=5
strategy("PSAR & RSI Strategy with Risk Management", overlay=true, default_qty_type=strategy.percent_of_equity, default_qty_value=10)

// User Inputs
psar_start = input.float(0.02, title="PSAR Start")
psar_increment = input.float(0.02, title="PSAR Increment")
psar_max = input.float(0.2, title="PSAR Max")
rsi_length = input.int(14, title="RSI Length")
rsi_overbought = input.int(70, title="RSI Overbought Level")
rsi_oversold = input.int(30, title="RSI Oversold Level")

tp_percent = input.float(5, title="Take Profit %") / 100  // Take Profit Level
sl_percent = input.float(3, title="Stop Loss %") / 100    // Stop Loss Level

// PSAR Calculation
psar = ta.sar(psar_start, psar_increment, psar_max)

// RSI Calculation
rsi = ta.rsi(close, rsi_length)

// Buy & Sell Conditions
buy_signal = ta.crossover(close, psar) and rsi < rsi_oversold
sell_signal = ta.crossunder(close, psar) and rsi > rsi_overbought

// Plot PSAR on Chart
plot(psar, style=plot.style_cross, color=color.blue, title="PSAR")

// Buy & Sell Signals on Chart
plotshape(series=buy_signal, location=location.belowbar, color=color.green, style=shape.labelup, title="BUY Signal")
plotshape(series=sell_signal, location=location.abovebar, color=color.red, style=shape.labeldown, title="SELL Signal")

// RSI Visualization (Dynamic Colors)
rsi_color = rsi > rsi_overbought ? color.red : rsi < rsi_oversold ? color.green : color.blue
plot(rsi, title="RSI", color=rsi_color, linewidth=2)
hline(rsi_overbought, "Overbought", color=color.red)
hline(rsi_oversold, "Oversold", color=color.green)

// Alerts for Buy & Sell
alertcondition(buy_signal, title="BUY Alert", message="Buy Signal Triggered!")
alertcondition(sell_signal, title="SELL Alert", message="Sell Signal Triggered!")

// Strategy Execution with Take Profit & Stop Loss
if buy_signal
    strategy.entry("Buy", strategy.long)
    strategy.exit("Take Profit / Stop Loss", from_entry="Buy", limit=close * (1 + tp_percent), stop=close * (1 - sl_percent))

if sell_signal
    strategy.close("Buy")
Detail
https://www.fmz.com/strategy/483528
Last Modified
2025-02-24 10:27:37