
8.4 KiB
Name
动态MACD和一目均衡图交易策略-Dynamic-MACD-and-Ichimoku-Cloud-Trading-Strategy
Author
ChaoZhang
Strategy Description
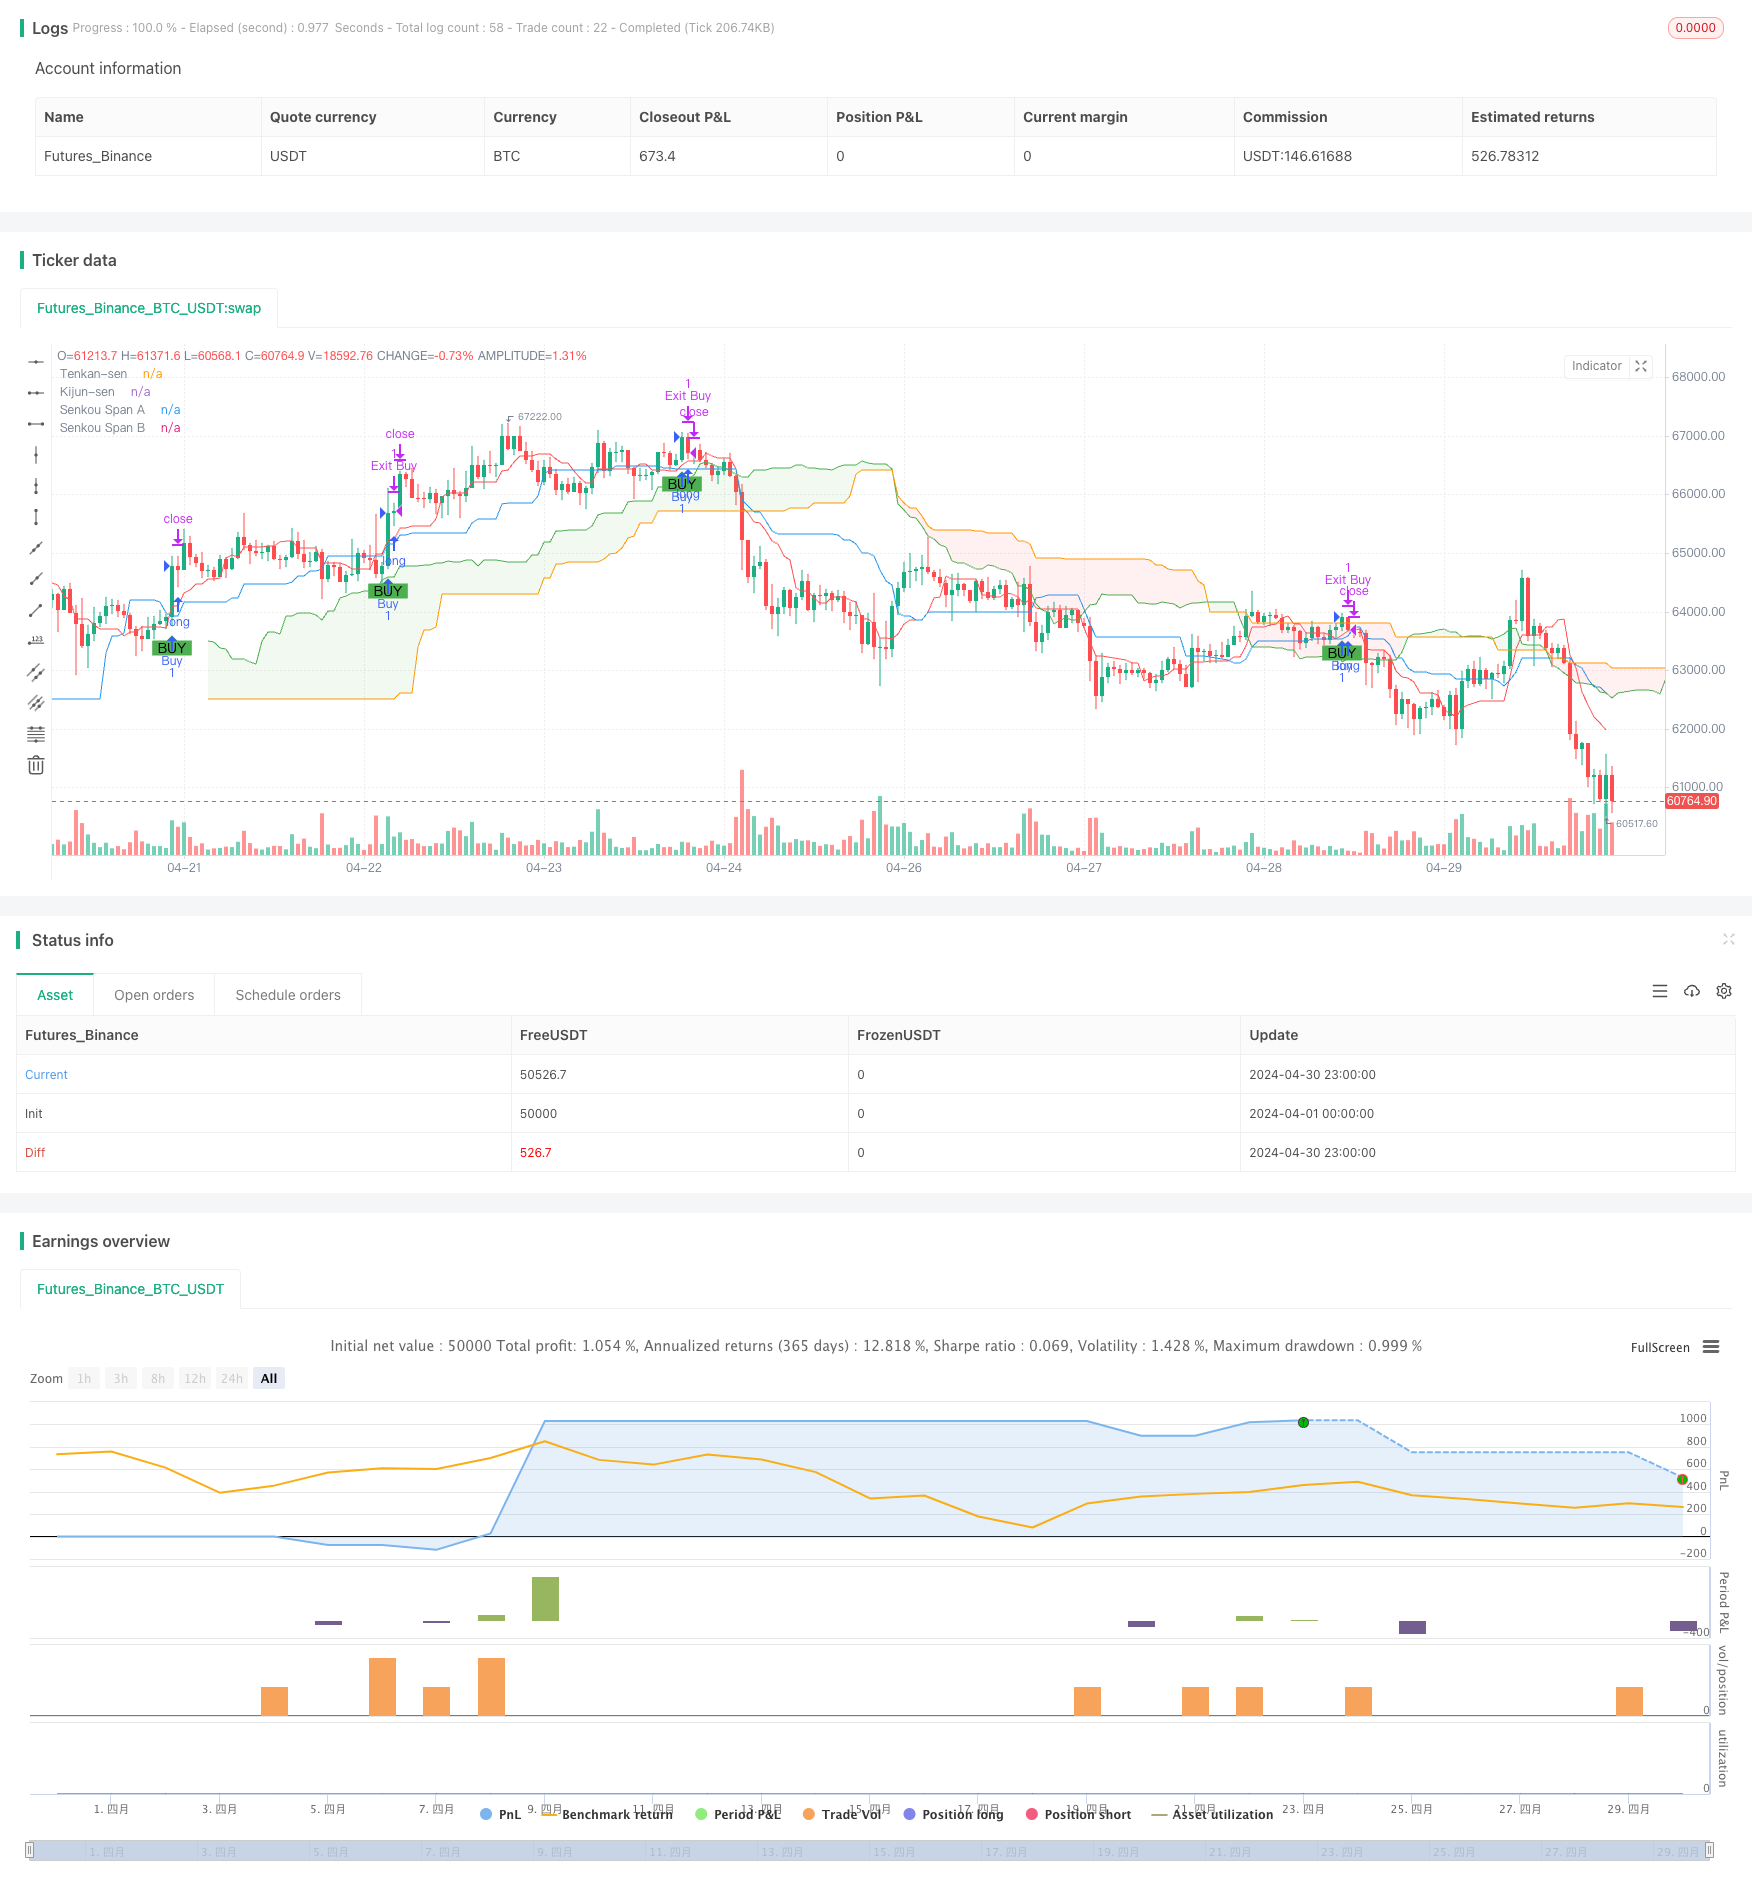
[trans]
概述
该交易策略结合了MACD和一目均衡图两个技术指标,旨在捕捉中期趋势和动量变化。MACD指标由快速、慢速和信号线组成,分别使用12、26和9的参数设置,用于识别动量转变和趋势反转。一目均衡图包含转折线、基准线、先行上限和先行下限,提供关于趋势强度、方向以及支撑/阻力位的洞察。该策略为积极的交易者提供基于明确定义标准的进场和出场信号,同时考虑风险管理,以保护每笔交易免受过度风险,同时争取可观的利润。
策略原理
该策略利用MACD指标和一目均衡图云来生成买入和卖出信号。当价格超过一目均衡图云且MACD线上穿信号线时,触发买入信号,表明看涨趋势。当价格跌破一目均衡图云且MACD线下穿信号线时,触发卖出信号,表明看跌趋势。止损和止盈水平可根据波动性和历史价格走势进行配置,但初始设置以风险管理为重点,以保护资金并锁定利润。
策略优势
- 结合MACD和一目均衡图两个强大的技术指标,提供更全面和可靠的交易信号。
- 适用于中期交易,捕捉趋势和动量变化。
- 明确定义的买入和卖出标准,易于理解和执行。
- 包含风险管理指南,通过止损和止盈设置保护资金。
- 鼓励根据个人交易风格和股票特点进行优化和定制。
策略风险
- MACD和一目均衡图参数可能不适用于所有市场条件和股票。
- 在波动市场中,频繁的交易信号可能导致过度交易和手续费损失。
- 止损位置如果设置不当,可能导致过早止损或承担过多风险。
- 该策略依赖历史数据,可能无法准确预测未来价格走势。
策略优化方向
- 根据不同股票和市场条件,调整MACD和一目均衡图参数。
- 引入其他技术指标,如相对强弱指数(RSI)或平均真实范围(ATR),以改进信号质量。
- 优化止损和止盈水平,以更好地管理风险和最大化利润。
- 考虑市场情绪和基本面因素,以补充技术分析。
总结
动态MACD和一目均衡图交易策略提供了一种强大的方法,结合两个广受欢迎的技术指标来识别中期趋势和动量变化。通过明确定义的买入和卖出标准,以及风险管理指南,该策略旨在帮助交易者做出明智的决策,控制风险并最大化利润。然而,交易者应根据自己的交易风格和市场特点对策略进行优化和定制,并持续监控其性能。通过适当的调整和风险管理,该策略可成为交易者工具箱中的宝贵补充。
||
Overview
This trading strategy combines two technical indicators, MACD and Ichimoku Cloud, to capture medium-term trends and momentum shifts. The MACD indicator consists of fast, slow, and signal lines, using 12, 26, and 9 settings respectively, to identify momentum changes and trend reversals. The Ichimoku Cloud incorporates Tenkan-sen, Kijun-sen, Senkou Span A, and Senkou Span B, providing insights into trend strength, direction, and support/resistance levels. The strategy offers entry and exit signals based on clearly defined criteria for active traders, while considering risk management to protect each trade from undue risk and aim for substantial profits.
Strategy Principles
The strategy utilizes the MACD indicator and Ichimoku Cloud to generate buy and sell signals. A buy signal is triggered when the price exceeds the Ichimoku Cloud and the MACD line crosses above the signal line, indicating a bullish trend. A sell signal is activated when the price falls below the Ichimoku Cloud and the MACD line crosses below the signal line, signaling a bearish trend. Stop loss and take profit levels are configurable based on volatility and historical price action, but initially set with a focus on risk management to preserve capital and lock in profits.
Strategy Advantages
- Combines two powerful technical indicators, MACD and Ichimoku Cloud, for more comprehensive and reliable trading signals.
- Suitable for medium-term trading, capturing trends and momentum changes.
- Clearly defined buy and sell criteria, easy to understand and execute.
- Incorporates risk management guidelines, protecting capital through stop loss and take profit settings.
- Encourages optimization and customization based on individual trading styles and stock characteristics.
Strategy Risks
- MACD and Ichimoku parameters may not be optimal for all market conditions and stocks.
- Frequent trading signals in volatile markets may lead to overtrading and commission losses.
- Improperly set stop loss levels may result in premature exits or excessive risk exposure.
- The strategy relies on historical data and may not accurately predict future price movements.
Strategy Optimization Directions
- Adjust MACD and Ichimoku parameters based on different stocks and market conditions.
- Introduce additional technical indicators, such as Relative Strength Index (RSI) or Average True Range (ATR), to improve signal quality.
- Optimize stop loss and take profit levels for better risk management and profit maximization.
- Consider market sentiment and fundamental factors to complement technical analysis.
Summary
The Dynamic MACD and Ichimoku Cloud Trading Strategy offers a powerful approach that combines two popular technical indicators to identify medium-term trends and momentum shifts. With clearly defined buy and sell criteria, as well as risk management guidelines, the strategy aims to help traders make informed decisions, control risk, and maximize profits. However, traders should optimize and customize the strategy based on their own trading styles and market characteristics, and continuously monitor its performance. With proper adjustments and risk management, this strategy can be a valuable addition to a trader's toolkit. [/trans]
Source (PineScript)
/*backtest
start: 2024-04-01 00:00:00
end: 2024-04-30 23:59:59
period: 1h
basePeriod: 15m
exchanges: [{"eid":"Futures_Binance","currency":"BTC_USDT"}]
*/

//@version=5
strategy("MACD and Ichimoku Cloud Strategy", overlay=true)

// MACD Components
fastLength = 12
slowLength = 26
signalLength = 9
[macdLine, signalLine, _] = ta.macd(close, fastLength, slowLength, signalLength)

// Ichimoku Cloud Components
tenkanLength = 9
kijunLength = 26
senkouLength = 52
displacement = 26

tenkanSen = (ta.highest(high, tenkanLength) + ta.lowest(low, tenkanLength)) / 2
kijunSen = (ta.highest(high, kijunLength) + ta.lowest(low, kijunLength)) / 2
senkouSpanA = (tenkanSen + kijunSen) / 2
senkouSpanB = (ta.highest(high, senkouLength) + ta.lowest(low, senkouLength)) / 2
chikouSpan = close[displacement]

// Plot Ichimoku Cloud
plot(tenkanSen, color=color.red, title="Tenkan-sen")
plot(kijunSen, color=color.blue, title="Kijun-sen")
p1 = plot(senkouSpanA, color=color.green, title="Senkou Span A", offset=displacement)
p2 = plot(senkouSpanB, color=color.orange, title="Senkou Span B", offset=displacement)
fill(p1, p2, color=senkouSpanA > senkouSpanB ? color.new(color.green, 90) : color.new(color.red, 90))

// Define Buy and Sell Conditions
macdBuy = ta.crossover(macdLine, signalLine)
ichimokuBuy = (close > senkouSpanA) and (close > senkouSpanB) and (tenkanSen > kijunSen)

buySignal = macdBuy and ichimokuBuy
macdSell = ta.crossunder(macdLine, signalLine)
ichimokuSell = (close < senkouSpanA) and (close < senkouSpanB) and (tenkanSen < kijunSen) and (tenkanSen[displacement] < math.min(senkouSpanA, senkouSpanB))

sellSignal = macdSell and ichimokuSell

// Execute Buy or Sell orders
if (buySignal)
    strategy.entry("Buy", strategy.long)
if (sellSignal)
    strategy.entry("Sell", strategy.short)

// Setting up the stop loss and take profit
stopLossPerc = 5.0
takeProfitPerc = 10.0

strategy.exit("Exit Buy", "Buy", loss=stopLossPerc, profit=takeProfitPerc)
strategy.exit("Exit Sell", "Sell", loss=stopLossPerc, profit=takeProfitPerc)

// Plot Buy and Sell Signals
plotshape(series=buySignal, location=location.belowbar, color=color.green, style=shape.labelup, title="Buy Signal", text="BUY")
plotshape(series=sellSignal, location=location.abovebar, color=color.red, style=shape.labeldown, title="Sell Signal", text="SELL")
Detail
https://www.fmz.com/strategy/451703
Last Modified
2024-05-17 10:45:23