
19 KiB
Name
动态ATR追踪止损交易策略市场波动性自适应系统-Dynamic-ATR-Trailing-Stop-Trading-Strategy-Market-Volatility-Adaptive-System
Author
ianzeng123
Strategy Description
[trans]
概述
动态ATR追踪止损交易策略是一种基于平均真实波幅(ATR)的量化交易系统,该策略核心在于利用市场波动性动态计算追踪止损线,从而捕捉价格趋势变化并自动执行买卖操作。该策略通过比较价格与追踪止损线之间的关系,在价格向上突破追踪止损线时发出买入信号,价格向下跌破追踪止损线时发出卖出信号,同时在趋势反转时自动平仓,以保护已有利润并控制风险。系统还提供直观的图形界面和自动化警报功能,帮助交易者更好地监控市场动态。
策略原理
该策略的核心原理基于使用ATR指标动态计算追踪止损水平。策略实现主要包括以下几个关键部分:
-
动态追踪止损计算:
- 使用ATR指标测量市场波动性:
xATR = ta.atr(c),其中c为ATR计算周期 - 通过感应参数a调整止损距离:
nLoss = a * xATR - 根据价格位置动态调整追踪止损线:
xATRTrailingStop := src > nz(xATRTrailingStop[1], 0) ? src - nLoss : src + nLoss,这意味着在上升趋势中,止损线会跟随价格上移,但保持一定距离;在下降趋势中则相反
- 使用ATR指标测量市场波动性:
-
信号生成逻辑:
- 买入信号:当价格向上突破追踪止损线时
buyCondition = ta.crossover(src, xATRTrailingStop) - 卖出信号:当价格向下跌破追踪止损线时
sellCondition = ta.crossunder(src, xATRTrailingStop)
- 买入信号:当价格向上突破追踪止损线时
-
仓位管理:
- 买入信号触发时,先关闭所有卖出仓位,然后开立新的买入仓位
- 卖出信号触发时,先关闭所有买入仓位,然后开立新的卖出仓位
- 价格与追踪止损线交叉时自动平仓,防止大幅度的市场反转造成损失
-
图形显示:
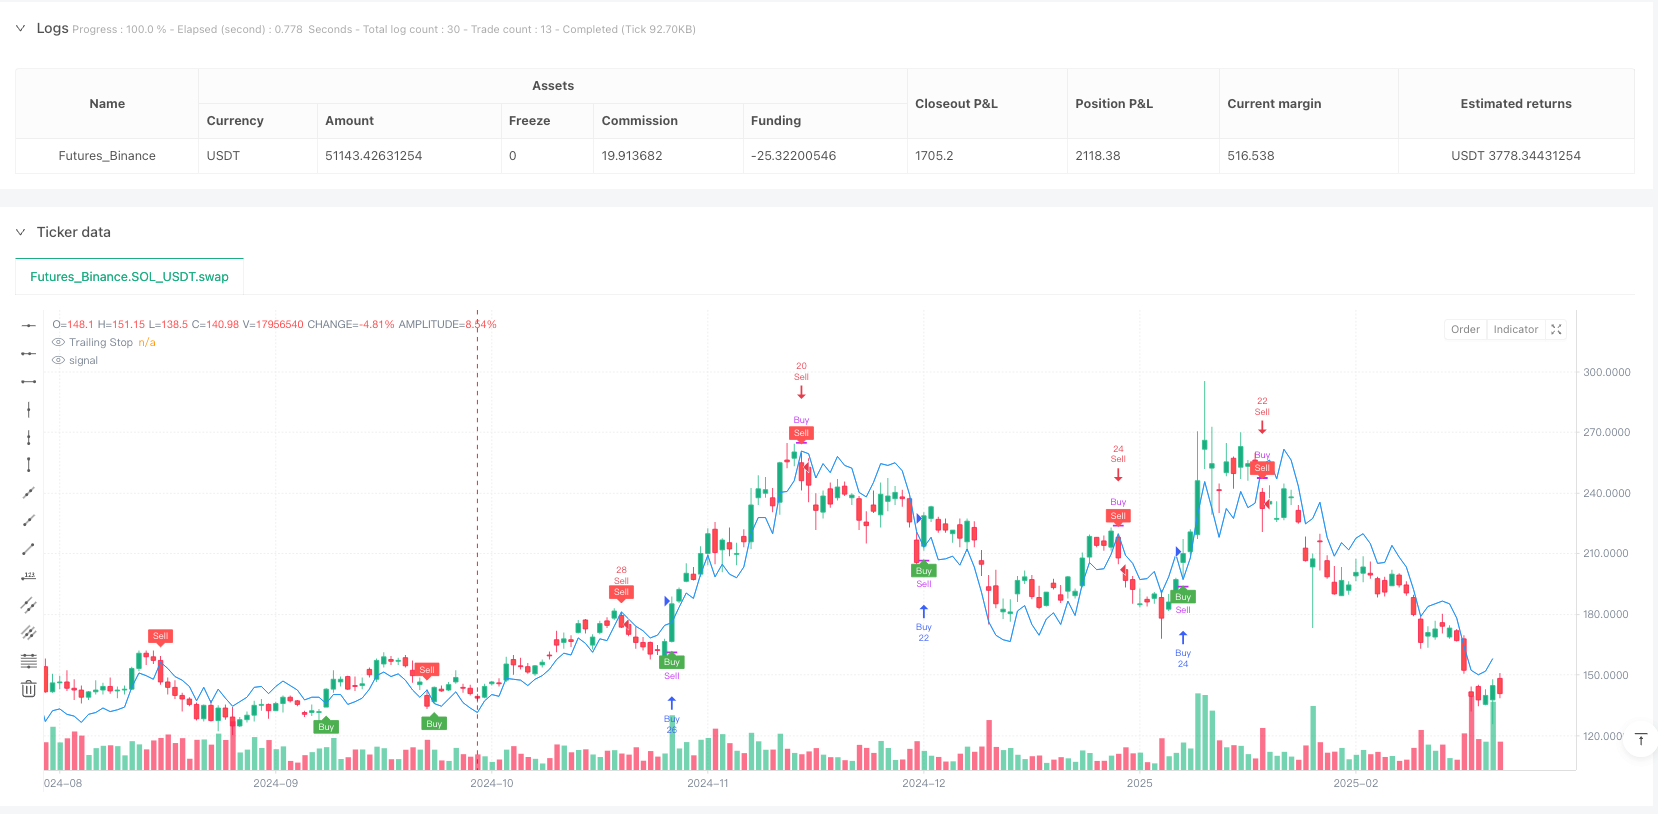
- 蓝色线显示追踪止损水平
- 绿色标记表示买入信号,红色标记表示卖出信号
- 根据价格与追踪止损线的位置关系,K线颜色动态调整为绿色(上升趋势)或红色(下降趋势)
-
自定义参数:
- 感应参数a:控制追踪止损线的敏感度,值越小越敏感
- ATR周期c:控制ATR计算的时间窗口
- 平滑选项h:可选择使用平滑K线(Heikin Ashi)计算信号
策略优势
该策略具有以下显著优势:
-
自适应市场波动性:通过ATR指标,策略能够根据市场波动性的变化自动调整止损距离,在高波动性环境下提供更宽松的止损距离,在低波动性环境下提供更紧密的止损距离。
-
趋势跟踪能力:策略设计为跟随市场趋势,能够在趋势形成初期进场,并随着趋势发展持续持有仓位,最大化趋势中的获利机会。
-
明确的进出场信号:基于价格与追踪止损线的交叉关系生成清晰的买卖信号,避免了主观判断,提高了交易纪律性。
-
自动化风险控制:通过追踪止损机制,策略能够自动保护已有利润并限制单笔交易的最大亏损,特别适合不希望手动管理止损的交易者。
-
视觉反馈直观:策略提供清晰的视觉指标,包括追踪止损线、买卖信号标记和K线颜色变化,使交易者能够直观理解市场状态和策略信号。
-
全面的警报系统:内置自动警报功能,可通过多种渠道(如Telegram、Discord、电子邮件等)接收实时交易信号通知,便于交易者及时响应市场变化。
策略风险
尽管该策略有诸多优势,但也存在以下风险和局限性:
-
震荡市场下的假信号:在市场横盘震荡时,价格可能频繁穿越追踪止损线,导致过多交易和连续亏损。解决方法是增加辅助过滤条件,例如结合趋势指标或在低波动环境中暂停交易。
-
参数敏感性:策略性能高度依赖参数a和c的设置。参数设置不当可能导致过早止损或止损过松,影响整体表现。建议通过回测在不同市场环境下优化参数,找到最佳平衡点。
-
滑点和交易成本影响:在实盘交易中,滑点和交易费用可能显著影响策略盈利能力,特别是在交易频率较高时。应在回测中考虑这些因素,并适当调整参数以减少交易次数。
-
市场跳空风险:在大幅度的市场跳空情况下,实际止损位置可能远低于理论止损位置,导致损失超过预期。建议设置额外的固定止损作为最后防线。
-
趋势反转延迟:策略在趋势反转初期可能反应较慢,导致部分利润回吐。可考虑结合动量指标或波动率突破指标来提前识别潜在的趋势反转。
策略优化方向
针对上述风险和局限性,该策略可以从以下几个方向进行优化:
-
增加趋势过滤器:结合其他趋势指标(如移动平均线、ADX等)确认趋势方向,只在确认的趋势方向上交易,避免震荡市场中的假信号。这样做的理由是单纯依靠价格与追踪止损线的交叉可能对市场噪音过于敏感。
-
动态调整参数:根据波动率变化动态调整a参数,在高波动环境下增加参数值,在低波动环境下减小参数值。这样可以更好地适应不同市场状态,提高策略的稳健性。
-
增加交易量过滤:结合交易量指标评估信号强度,只在交易量确认的情况下执行交易,提高信号的可靠性。这是因为有交易量支持的突破通常更为可靠。
-
实现部分仓位管理:不必每次都全仓进出,可以实现分批建仓和分批平仓的策略,根据信号强度调整仓位大小,降低单次交易风险。
-
增加盈利目标:设置基于ATR的动态获利目标,在达到特定盈利水平时部分平仓,锁定利润。这样做可以在不放弃大趋势潜在收益的同时,保护已有利润。
-
添加时间过滤:避开特定的低效率交易时段(如亚盘低流动性时段),或在重大数据发布前暂停交易,减少异常波动带来的风险。
-
市场状态适应:添加市场状态(趋势/震荡)判断逻辑,在不同市场状态下采用不同的交易策略或参数设置,提高策略适应性。
总结
动态ATR追踪止损交易策略是一个灵活且功能完善的量化交易系统,通过利用ATR指标动态调整追踪止损水平,实现了市场波动性自适应的趋势跟踪功能。该策略最大的优势在于能够根据市场状况自动调整风险控制参数,提供清晰的买卖信号,并实现全自动的仓位管理。
虽然策略在震荡市场中可能产生假信号,对参数设置也较为敏感,但通过添加趋势过滤器、动态参数调整、交易量确认和部分仓位管理等优化措施,可以显著提高策略的稳健性和盈利能力。该策略特别适合中长期趋势跟踪交易者,以及希望实现交易自动化的投资者。
要充分发挥该策略的潜力,建议交易者进行充分的历史回测,针对不同市场和时间框架优化参数设置,并结合良好的资金管理原则,控制每笔交易的风险。通过这些步骤,动态ATR追踪止损交易策略可以成为交易者工具箱中的有力武器,帮助实现更加纪律和系统化的交易过程。 ||
Overview
The Dynamic ATR Trailing Stop Trading Strategy is a quantitative trading system based on the Average True Range (ATR) indicator. The core of this strategy lies in utilizing market volatility to dynamically calculate a trailing stop line, thereby capturing price trend changes and automatically executing buy and sell operations. This strategy generates buy signals when price breaks above the trailing stop line and sell signals when price falls below the trailing stop line, while automatically closing positions during trend reversals to protect existing profits and control risk. The system also provides an intuitive graphical interface and automated alert functionality to help traders better monitor market dynamics.
Strategy Principle
The core principle of this strategy is based on using the ATR indicator to dynamically calculate trailing stop levels. The strategy implementation includes the following key components:
-
Dynamic Trailing Stop Calculation:
- Using the ATR indicator to measure market volatility:
xATR = ta.atr(c), where c is the ATR calculation period - Adjusting the stop distance through sensitivity parameter a:
nLoss = a * xATR - Dynamically adjusting the trailing stop line based on price position:
xATRTrailingStop := src > nz(xATRTrailingStop[1], 0) ? src - nLoss : src + nLoss, which means in an uptrend, the stop line follows the price upward but maintains a certain distance; in a downtrend, the opposite occurs
- Using the ATR indicator to measure market volatility:
-
Signal Generation Logic:
- Buy signal: When price breaks above the trailing stop line
buyCondition = ta.crossover(src, xATRTrailingStop) - Sell signal: When price falls below the trailing stop line
sellCondition = ta.crossunder(src, xATRTrailingStop)
- Buy signal: When price breaks above the trailing stop line
-
Position Management:
- When a buy signal is triggered, all sell positions are closed first, then new buy positions are opened
- When a sell signal is triggered, all buy positions are closed first, then new sell positions are opened
- Positions are automatically closed when price crosses the trailing stop line, preventing losses from significant market reversals
-
Graphical Display:
- Blue line displays the trailing stop level
- Green markers indicate buy signals, red markers indicate sell signals
- Candle colors dynamically adjust to green (uptrend) or red (downtrend) based on the relationship between price and trailing stop line
-
Custom Parameters:
- Sensitivity parameter a: Controls the sensitivity of the trailing stop line, smaller values increase sensitivity
- ATR period c: Controls the time window for ATR calculation
- Smoothing option h: Option to use Heikin Ashi candles for signal calculation
Strategy Advantages
This strategy has the following significant advantages:
-
Adapts to Market Volatility: Through the ATR indicator, the strategy can automatically adjust the stop loss distance based on changes in market volatility, providing a wider stop distance in high volatility environments and a tighter stop distance in low volatility environments.
-
Trend Following Capability: The strategy is designed to follow market trends, able to enter at the early stages of trend formation and continuously hold positions as the trend develops, maximizing profit opportunities within trends.
-
Clear Entry and Exit Signals: Generates clear buy and sell signals based on the crossover relationship between price and the trailing stop line, avoiding subjective judgment and improving trading discipline.
-
Automated Risk Control: Through the trailing stop mechanism, the strategy can automatically protect existing profits and limit the maximum loss per trade, particularly suitable for traders who do not wish to manually manage stop losses.
-
Intuitive Visual Feedback: The strategy provides clear visual indicators, including the trailing stop line, buy/sell signal markers, and candle color changes, allowing traders to intuitively understand market status and strategy signals.
-
Comprehensive Alert System: Built-in automated alert functionality that can receive real-time trading signal notifications through various channels (such as Telegram, Discord, email, etc.), making it convenient for traders to respond to market changes promptly.
Strategy Risks
Despite its many advantages, the strategy also has the following risks and limitations:
-
False Signals in Oscillating Markets: In sideways, oscillating markets, price may frequently cross the trailing stop line, leading to excessive trading and consecutive losses. The solution is to add auxiliary filtering conditions, such as combining trend indicators or pausing trading in low volatility environments.
-
Parameter Sensitivity: Strategy performance is highly dependent on parameters a and c. Improper parameter settings may lead to premature stop losses or overly loose stops, affecting overall performance. It is recommended to optimize parameters through backtesting in different market environments to find the optimal balance.
-
Impact of Slippage and Trading Costs: In live trading, slippage and trading fees can significantly impact strategy profitability, especially when trading frequency is high. These factors should be considered in backtesting, and parameters should be adjusted appropriately to reduce the number of trades.
-
Market Gap Risk: In cases of significant market gaps, the actual stop loss position may be far lower than the theoretical stop loss position, causing losses to exceed expectations. It is advisable to set additional fixed stop losses as a last line of defense.
-
Trend Reversal Delay: The strategy may react slowly in the initial stages of trend reversal, leading to partial profit giveback. Consider combining momentum indicators or volatility breakthrough indicators to identify potential trend reversals in advance.
Strategy Optimization Directions
Addressing the above risks and limitations, the strategy can be optimized in the following directions:
-
Add Trend Filters: Combine other trend indicators (such as moving averages, ADX, etc.) to confirm trend direction, only trading in the confirmed trend direction to avoid false signals in oscillating markets. This is because relying solely on price and trailing stop line crossovers may be overly sensitive to market noise.
-
Dynamic Parameter Adjustment: Dynamically adjust parameter a based on volatility changes, increasing parameter values in high volatility environments and decreasing parameter values in low volatility environments. This can better adapt to different market states and improve strategy robustness.
-
Add Volume Filters: Combine volume indicators to evaluate signal strength, only executing trades when volume confirms, increasing signal reliability. This is because breakouts supported by volume are typically more reliable.
-
Implement Partial Position Management: Instead of always entering and exiting with full positions, implement a strategy of building and closing positions in batches, adjusting position size based on signal strength to reduce risk per trade.
-
Add Profit Targets: Set dynamic profit targets based on ATR, partially closing positions when specific profit levels are reached to lock in profits. This can protect existing profits while not giving up potential returns from major trends.
-
Add Time Filters: Avoid specific inefficient trading sessions (such as low liquidity Asian sessions) or pause trading before major data releases to reduce risks from abnormal fluctuations.
-
Market State Adaptation: Add market state (trend/oscillation) judgment logic, adopting different trading strategies or parameter settings in different market states to improve strategy adaptability.
Summary
The Dynamic ATR Trailing Stop Trading Strategy is a flexible and fully-featured quantitative trading system that achieves market volatility adaptive trend following functionality by using the ATR indicator to dynamically adjust trailing stop levels. The greatest advantage of this strategy is its ability to automatically adjust risk control parameters based on market conditions, provide clear buy and sell signals, and implement fully automated position management.
Although the strategy may produce false signals in oscillating markets and is sensitive to parameter settings, through adding trend filters, dynamic parameter adjustments, volume confirmation, and partial position management optimization measures, the strategy's robustness and profitability can be significantly improved. This strategy is particularly suitable for medium to long-term trend following traders and investors who wish to automate their trading.
To fully leverage the potential of this strategy, it is recommended that traders conduct thorough historical backtesting, optimize parameter settings for different markets and timeframes, and combine good money management principles to control risk per trade. Through these steps, the Dynamic ATR Trailing Stop Trading Strategy can become a powerful weapon in a trader's toolbox, helping to achieve a more disciplined and systematic trading process.[/trans]
Source (PineScript)
/*backtest
start: 2024-10-11 00:00:00
end: 2025-03-02 08:00:00
period: 1d
basePeriod: 1d
exchanges: [{"eid":"Futures_Binance","currency":"SOL_USDT"}]
*/

//@version=5
strategy(title='Xfera Trading Bot Automation', overlay=true, default_qty_type=strategy.percent_of_equity, default_qty_value=10)

// Inputs
a = input(1, title='Key Value. \'This changes the sensitivity\'')
c = input(10, title='ATR Period')
h = input(false, title='Signals from Heikin Ashi Candles')

// Calculo do ATR e Trailing Stop
xATR = ta.atr(c)
nLoss = a * xATR

src = h ? request.security(ticker.heikinashi(syminfo.tickerid), timeframe.period, close, lookahead=barmerge.lookahead_off) : close

xATRTrailingStop = 0.0
xATRTrailingStop := src > nz(xATRTrailingStop[1], 0) ? src - nLoss : src + nLoss

// Condições de Compra e Venda
buyCondition = ta.crossover(src, xATRTrailingStop)
sellCondition = ta.crossunder(src, xATRTrailingStop)

// Executar ordens de compra e venda
if (buyCondition)
    strategy.close("Sell")  // Fecha posição de venda, se existir
    strategy.entry("Buy", strategy.long)  // Abre posição de compra

if (sellCondition)
    strategy.close("Buy")  // Fecha posição de compra, se existir
    strategy.entry("Sell", strategy.short)  // Abre posição de venda

// Plotagem visual
plot(xATRTrailingStop, color=color.blue, title="Trailing Stop")
plotshape(buyCondition, title='Buy Signal', text='Buy', style=shape.labelup, location=location.belowbar, color=color.new(color.green, 0), textcolor=color.new(color.white, 0), size=size.tiny)
plotshape(sellCondition, title='Sell Signal', text='Sell', style=shape.labeldown, location=location.abovebar, color=color.new(color.red, 0), textcolor=color.new(color.white, 0), size=size.tiny)

// Barcolor para tendência
barcolor(src > xATRTrailingStop ? color.green : color.red)

// Alertas automáticos
alertcondition(buyCondition, title='Buy Signal', message='? SINAL DE COMPRA GERADO! ?\n? Ativo: {{ticker}}\n⏰ Timeframe: {{interval}}\n? Preço Atual: {{close}}\n? Data/Hora: {{time}}')
alertcondition(sellCondition, title='Sell Signal', message='? SINAL DE VENDA GERADO! ?\n? Ativo: {{ticker}}\n⏰ Timeframe: {{interval}}\n? Preço Atual: {{close}}\n? Data/Hora: {{time}}')
Detail
https://www.fmz.com/strategy/484773
Last Modified
2025-03-04 11:03:58