
15 KiB
Name
动态风险管理的快速均线交叉动量捕捉策略-Dynamic-Risk-Managed-Rapid-SMA-Crossover-Momentum-Capture-Strategy
Author
ianzeng123
Strategy Description
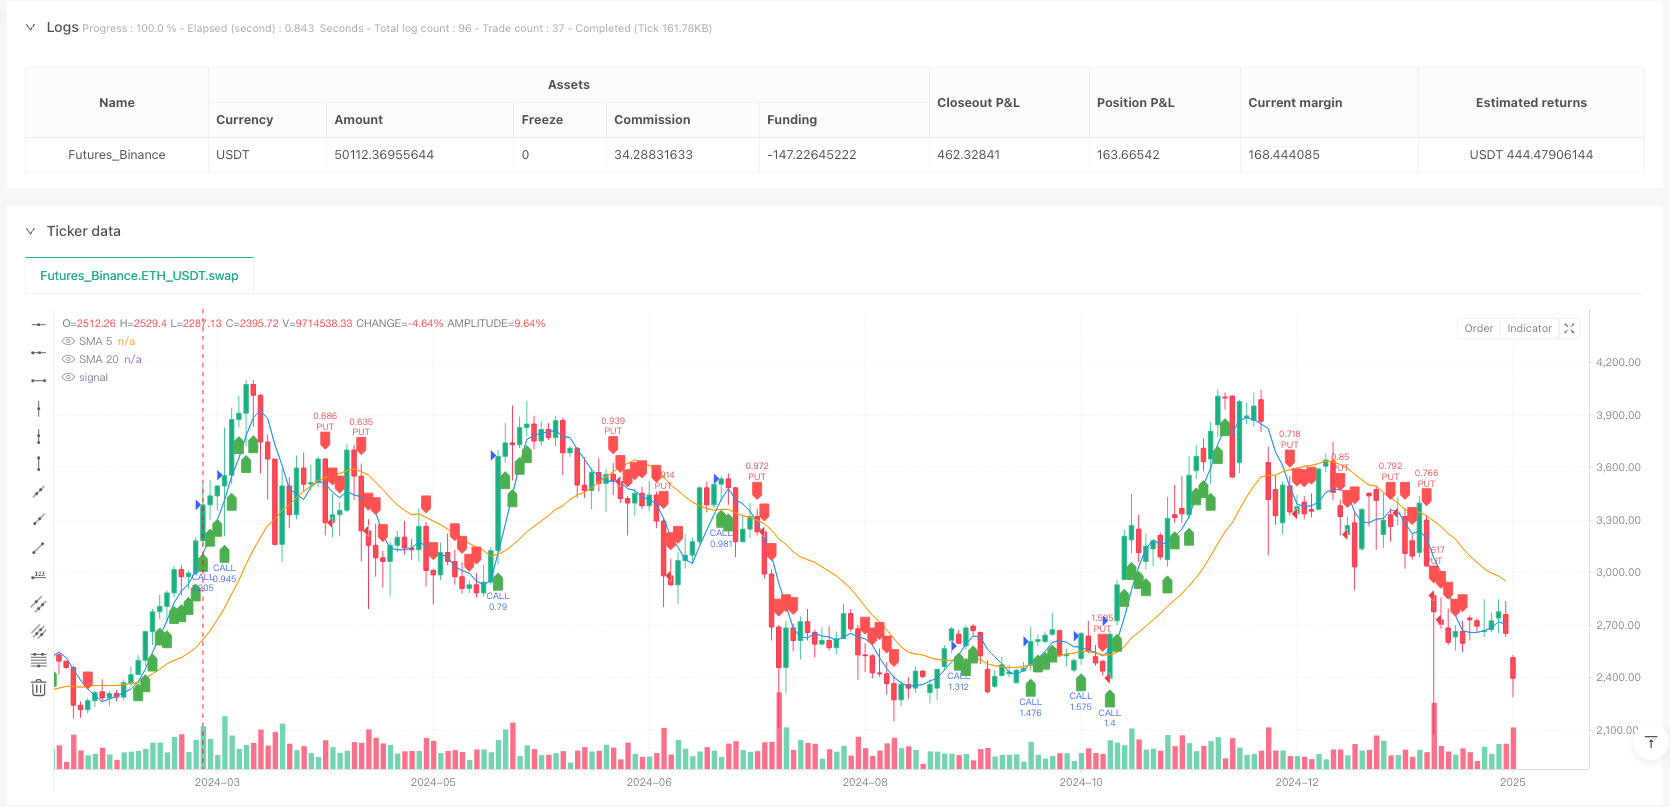
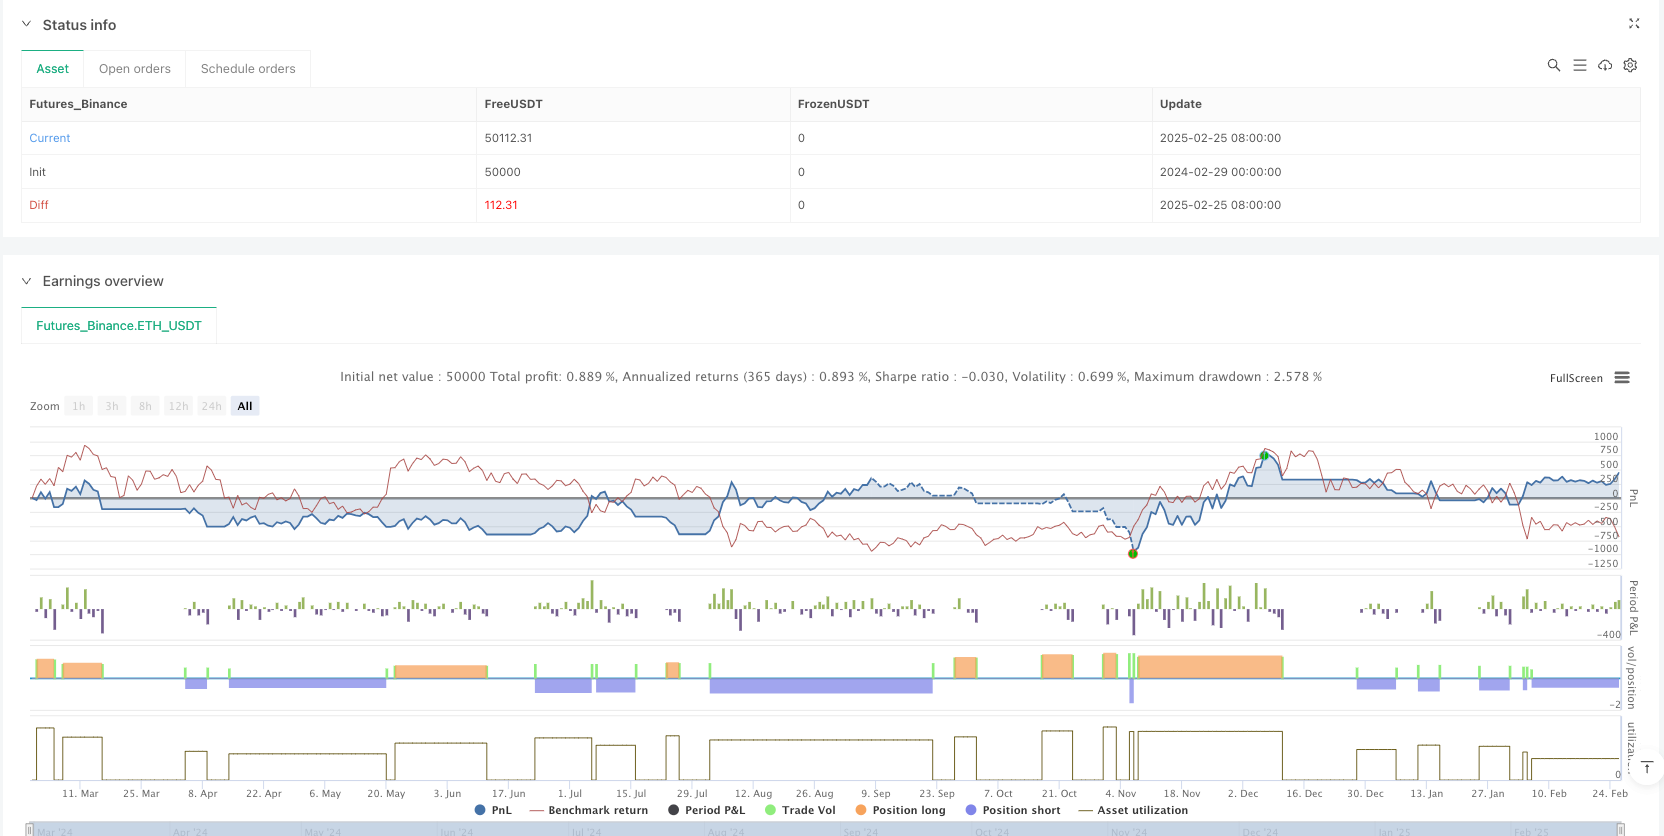
[trans]
概述
动态风险管理的快速均线交叉动量捕捉策略是一种高频交易策略,专为快速捕捉短期市场波动而设计。该策略结合了多个技术指标,包括快速移动平均线(SMA)、相对强弱指数(RSI)和移动平均线收敛/发散指标(MACD),同时融入了基于平均真实范围(ATR)的动态风险管理系统。这种组合使得策略能够在高波动性环境中迅速发现交易机会,同时严格控制每笔交易的风险敞口。
策略原理
该策略的核心逻辑建立在短期技术指标的协同确认基础上,主要依靠以下几个关键组件:
-
快速移动平均线系统:策略使用5周期和20周期的简单移动平均线(SMA)作为主要趋势指标。当价格位于5周期SMA之上且5周期SMA位于20周期SMA之上时,视为看涨信号的一部分;反之则为看跌信号的一部分。
-
短周期RSI过滤器:采用10周期RSI作为动量过滤器,设定45作为超卖阈值,55作为超买阈值。这些阈值设定相对中性,有助于在快速市场中捕捉早期反转信号。
-
超快速MACD确认:策略使用参数为(5,13,3)的MACD,这比传统MACD设置更为敏感。MACD线与信号线之间的关系用于确认趋势方向。
-
ATR自适应止损和获利目标:使用10周期ATR计算动态止损位和获利目标,止损设置为ATR的1.2倍,而获利目标设为ATR的2.5倍,建立了2:1以上的风险回报比。
-
动态仓位管理:策略根据账户总值和预设风险比例(默认0.5%)动态计算每笔交易的仓位大小,确保无论市场条件如何,每笔交易的风险敞口都保持一致。
入场条件是这些指标的协同确认:对于多头入场,要求MACD线在信号线之上,RSI高于超卖值45,收盘价高于5周期SMA,且5周期SMA高于20周期SMA;空头入场则是这些条件的反向确认。
策略优势
-
快速响应市场变化:通过采用短周期技术指标,策略能够迅速对市场动向作出反应,适合短线交易者和日内交易者。
-
多层确认机制:要求多个指标同时确认才会触发交易信号,这减少了假信号的可能性,提高了信号质量。
-
科学的风险管理:通过ATR计算动态止损位置,使止损水平能够自适应市场波动性,在波动加剧时自动增加保护,在平静市场中避免过早止损。
-
固定比例风险控制:每笔交易仅风险账户的0.5%,即使连续亏损也能有效保护资金不会大幅缩水。
-
优化的风险回报比:2:1以上的风险回报设置,意味着即使胜率只有40%,长期依然可能实现盈利。
-
可视化交易信号:策略提供了清晰的视觉提示,帮助交易者直观地识别入场时机。
策略风险
-
高频交易成本:由于是快速交易策略,可能产生频繁的交易信号,导致高额交易费用,尤其在价格横盘震荡时。解决方法是增加额外的过滤条件或延长持仓时间。
-
假突破风险:快速指标对短期价格波动非常敏感,可能在假突破中触发信号。可以通过添加成交量确认或波动率过滤器来减轻这一风险。
-
趋势逆转风险:该策略在强趋势环境中表现最佳,但在市场突然逆转时可能面临较大亏损。建议在重大经济数据发布或重要事件前减少头寸规模。
-
参数优化过度:当前参数设置可能在历史回测中表现良好,但未来市场条件变化时效果可能下降。建议定期重新评估和调整参数,或使用自适应参数技术。
-
止损跳空风险:在低流动性或高波动性市场中,价格可能跳过设定的止损位。考虑使用期权策略或其他衍生品来对冲这种跳空风险。
策略优化方向
-
加入成交量过滤器:目前策略仅基于价格行为,加入成交量确认可以提高信号质量。当价格突破伴随成交量增加时,信号可靠性大幅提升。
-
增加市场状态识别:添加波动率指标(如布林带宽度)来识别市场状态,在高波动环境中可能需要调整参数或减少交易频率。
-
优化时间框架协同:考虑加入多时间框架分析,只在更大时间框架趋势方向一致时进行交易,可以提高胜率。
-
增强动态参数调整:目前策略使用固定的指标参数,可以实现参数根据市场波动自动调整,比如在波动性增加时延长均线周期。
-
整合机器学习元素:通过机器学习算法优化入场时机,特别是使用随机森林或支持向量机等算法来预测短期价格走势,提高预测准确性。
-
改进资金管理:虽然策略已经实现了基本的风险控制,但可以考虑加入复利效应,或在连续获利后适度增加头寸规模。
总结
动态风险管理的快速均线交叉动量捕捉策略是一种技术面导向的短线交易系统,通过整合多个指标和严格的风险管理框架,为快速捕捉市场波动提供了系统化方法。其核心优势在于快速响应市场变化、多层指标确认和科学的风险控制系统。尽管存在高频交易成本和假突破等风险,但通过建议的优化方向,如加入成交量确认、市场状态识别和机器学习元素,策略的稳健性和适应性可以得到进一步提升。对于寻求在短时间内捕捉市场波动同时严格控制风险的交易者而言,这种策略提供了一个良好的起点,但需要根据个人风险偏好和市场经验进行适当调整。
||
Overview
The Dynamic Risk-Managed Rapid SMA Crossover Momentum Capture Strategy is a high-frequency trading approach designed specifically for capturing short-term market movements. This strategy combines multiple technical indicators including fast Simple Moving Averages (SMA), Relative Strength Index (RSI), and Moving Average Convergence/Divergence (MACD), while incorporating a dynamic risk management system based on Average True Range (ATR). This combination allows the strategy to quickly identify trading opportunities in volatile environments while strictly controlling risk exposure per trade.
Strategy Principles
The core logic of this strategy is built on the coordinated confirmation of short-term technical indicators, relying on the following key components:
-
Fast Moving Average System: The strategy uses 5-period and 20-period Simple Moving Averages (SMA) as primary trend indicators. A bullish signal component is identified when price is above the 5-period SMA and the 5-period SMA is above the 20-period SMA; the reverse conditions contribute to bearish signals.
-
Short-Term RSI Filter: A 10-period RSI serves as a momentum filter, with 45 set as the oversold threshold and 55 as the overbought threshold. These relatively neutral thresholds help capture early reversal signals in fast-moving markets.
-
Ultra-Fast MACD Confirmation: The strategy employs a MACD with parameters (5,13,3), which is more sensitive than traditional MACD settings. The relationship between the MACD line and signal line confirms trend direction.
-
ATR Adaptive Stop Loss and Profit Targets: A 10-period ATR calculates dynamic stop-loss and take-profit levels, with stop-loss set at 1.2 times ATR and profit targets at 2.5 times ATR, establishing a risk-reward ratio of over 2:1.
-
Dynamic Position Sizing: The strategy dynamically calculates position size for each trade based on account equity and predetermined risk percentage (default 0.5%), ensuring consistent risk exposure regardless of market conditions.
Entry conditions require coordinated confirmation of these indicators: for long entries, the MACD line must be above the signal line, RSI above the oversold value of 45, closing price above the 5-period SMA, and the 5-period SMA above the 20-period SMA; short entries require the reverse confirmation of these conditions.
Strategy Advantages
-
Rapid Response to Market Changes: By utilizing short-period technical indicators, the strategy can quickly react to market movements, making it suitable for short-term and intraday traders.
-
Multi-Layer Confirmation Mechanism: Requiring multiple indicators to simultaneously confirm before triggering trade signals reduces the likelihood of false signals and improves signal quality.
-
Scientific Risk Management: Dynamic stop-loss levels calculated through ATR allow the protection level to adapt to market volatility, automatically increasing protection when volatility rises and avoiding premature stops in calm markets.
-
Fixed Percentage Risk Control: Each trade risks only 0.5% of the account, effectively protecting capital even during consecutive losses.
-
Optimized Risk-Reward Ratio: The risk-reward setting of over 2:1 means that even with a win rate of only 40%, profitability may be achievable in the long term.
-
Visualization of Trading Signals: The strategy provides clear visual cues, helping traders intuitively identify entry opportunities.
Strategy Risks
-
High-Frequency Trading Costs: As a rapid trading strategy, it may generate frequent trading signals, resulting in high transaction fees, especially during price consolidations. Solution: Add additional filtering conditions or extend holding periods.
-
False Breakout Risk: Fast indicators are highly sensitive to short-term price movements and may trigger signals during false breakouts. This risk can be mitigated by adding volume confirmation or volatility filters.
-
Trend Reversal Risk: The strategy performs best in strong trending environments but may face significant losses when markets suddenly reverse. Consider reducing position size before major economic data releases or important events.
-
Parameter Optimization Overfitting: Current parameter settings may perform well in historical backtests but could decline in effectiveness as market conditions change. Regularly re-evaluate and adjust parameters, or implement adaptive parameter techniques.
-
Gap Risk for Stop Losses: In low-liquidity or high-volatility markets, prices may gap beyond set stop-loss levels. Consider using options strategies or other derivatives to hedge against gap risk.
Strategy Optimization Directions
-
Add Volume Filters: The current strategy is based solely on price action; adding volume confirmation can improve signal quality. When price breakouts are accompanied by increased volume, signal reliability significantly improves.
-
Implement Market State Recognition: Add volatility indicators (such as Bollinger Band Width) to identify market states; parameters may need adjustment or trading frequency reduced in high-volatility environments.
-
Optimize Multiple Timeframe Analysis: Consider incorporating multiple timeframe analysis, only trading when larger timeframe trends align with the signal direction, which can improve win rates.
-
Enhance Dynamic Parameter Adjustment: Currently using fixed indicator parameters, the strategy could be improved by automatically adjusting parameters based on market volatility, such as extending moving average periods when volatility increases.
-
Integrate Machine Learning Elements: Optimize entry timing through machine learning algorithms, particularly using random forests or support vector machines to predict short-term price movements and improve prediction accuracy.
-
Improve Money Management: While the strategy already implements basic risk control, consider adding compounding effects or moderately increasing position sizes after consecutive profitable trades.
Conclusion
The Dynamic Risk-Managed Rapid SMA Crossover Momentum Capture Strategy is a technically-oriented short-term trading system that provides a systematic approach to capturing market movements quickly through the integration of multiple indicators and a strict risk management framework. Its core strengths lie in its rapid response to market changes, multi-layer indicator confirmation, and scientific risk control system. Despite risks such as high-frequency trading costs and false breakouts, the strategy's robustness and adaptability can be further enhanced through the suggested optimization directions, including volume confirmation, market state recognition, and machine learning elements. For traders seeking to capture market movements in short timeframes while strictly controlling risk, this strategy provides a solid starting point, though it should be appropriately adjusted according to individual risk preferences and market experience. [/trans]
Source (PineScript)
/*backtest
start: 2024-02-29 00:00:00
end: 2025-02-26 08:00:00
period: 2d
basePeriod: 2d
exchanges: [{"eid":"Futures_Binance","currency":"ETH_USDT"}]
*/

//@version=5
strategy("Stock & Options Hyper-Scalper", overlay=true, default_qty_type=strategy.percent_of_equity, default_qty_value=1)

// === Inputs ===
riskPercentage = input.float(0.5, title="Risk Per Trade (%)", minval=0.1, maxval=5.0) / 100
stopLossMultiplier = input.float(1.2, title="Stop Loss Multiplier (ATR)", minval=0.5, maxval=2.5)
takeProfitMultiplier = input.float(2.5, title="Take Profit Multiplier (ATR)", minval=1.5, maxval=5.0)

// === Technical Indicators ===
// Super Short-Term SMAs
sma5 = ta.sma(close, 5)
sma20 = ta.sma(close, 20)

// Faster RSI for Scalping
rsi = ta.rsi(close, 10)
rsiOverbought = 55
rsiOversold = 45

// Ultra-Fast MACD (For Rapid Signals)
[macdLine, signalLine, _] = ta.macd(close, 5, 13, 3)

// ATR for Adaptive Stops
atr = ta.atr(10)
stopLoss = stopLossMultiplier * atr
takeProfit = takeProfitMultiplier * atr

// === Entry Conditions ===
// CALL (Bullish Entry)
longEntry = (macdLine > signalLine) and (rsi > rsiOversold) and (close > sma5) and (sma5 > sma20)

// PUT (Bearish Entry)
shortEntry = (macdLine < signalLine) and (rsi < rsiOverbought) and (close < sma5) and (sma5 < sma20)

// === Position Sizing ===
accountBalance = strategy.equity
riskAmount = accountBalance * riskPercentage
positionSize = riskAmount / stopLoss

// === Trade Execution ===
if longEntry
    strategy.entry("CALL", strategy.long, qty=positionSize)
    strategy.exit("Exit CALL", from_entry="CALL", stop=close - stopLoss, limit=close + takeProfit)

if shortEntry
    strategy.entry("PUT", strategy.short, qty=positionSize)
    strategy.exit("Exit PUT", from_entry="PUT", stop=close + stopLoss, limit=close - takeProfit)

// === Visual Trade Signals ===
plot(sma5, title="SMA 5", color=color.blue)
plot(sma20, title="SMA 20", color=color.orange)

plotshape(series=longEntry, location=location.belowbar, color=color.green, style=shape.labelup, title="BUY Signal")
plotshape(series=shortEntry, location=location.abovebar, color=color.red, style=shape.labeldown, title="SELL Signal")
Detail
https://www.fmz.com/strategy/484109
Last Modified
2025-02-28 10:29:24