
11 KiB
Name
动态风险管理的均线交叉与布林带策略-Dynamic-Risk-Managed-EMA-Crossover-with-Bollinger-Bands-Strategy
Author
ChaoZhang
Strategy Description
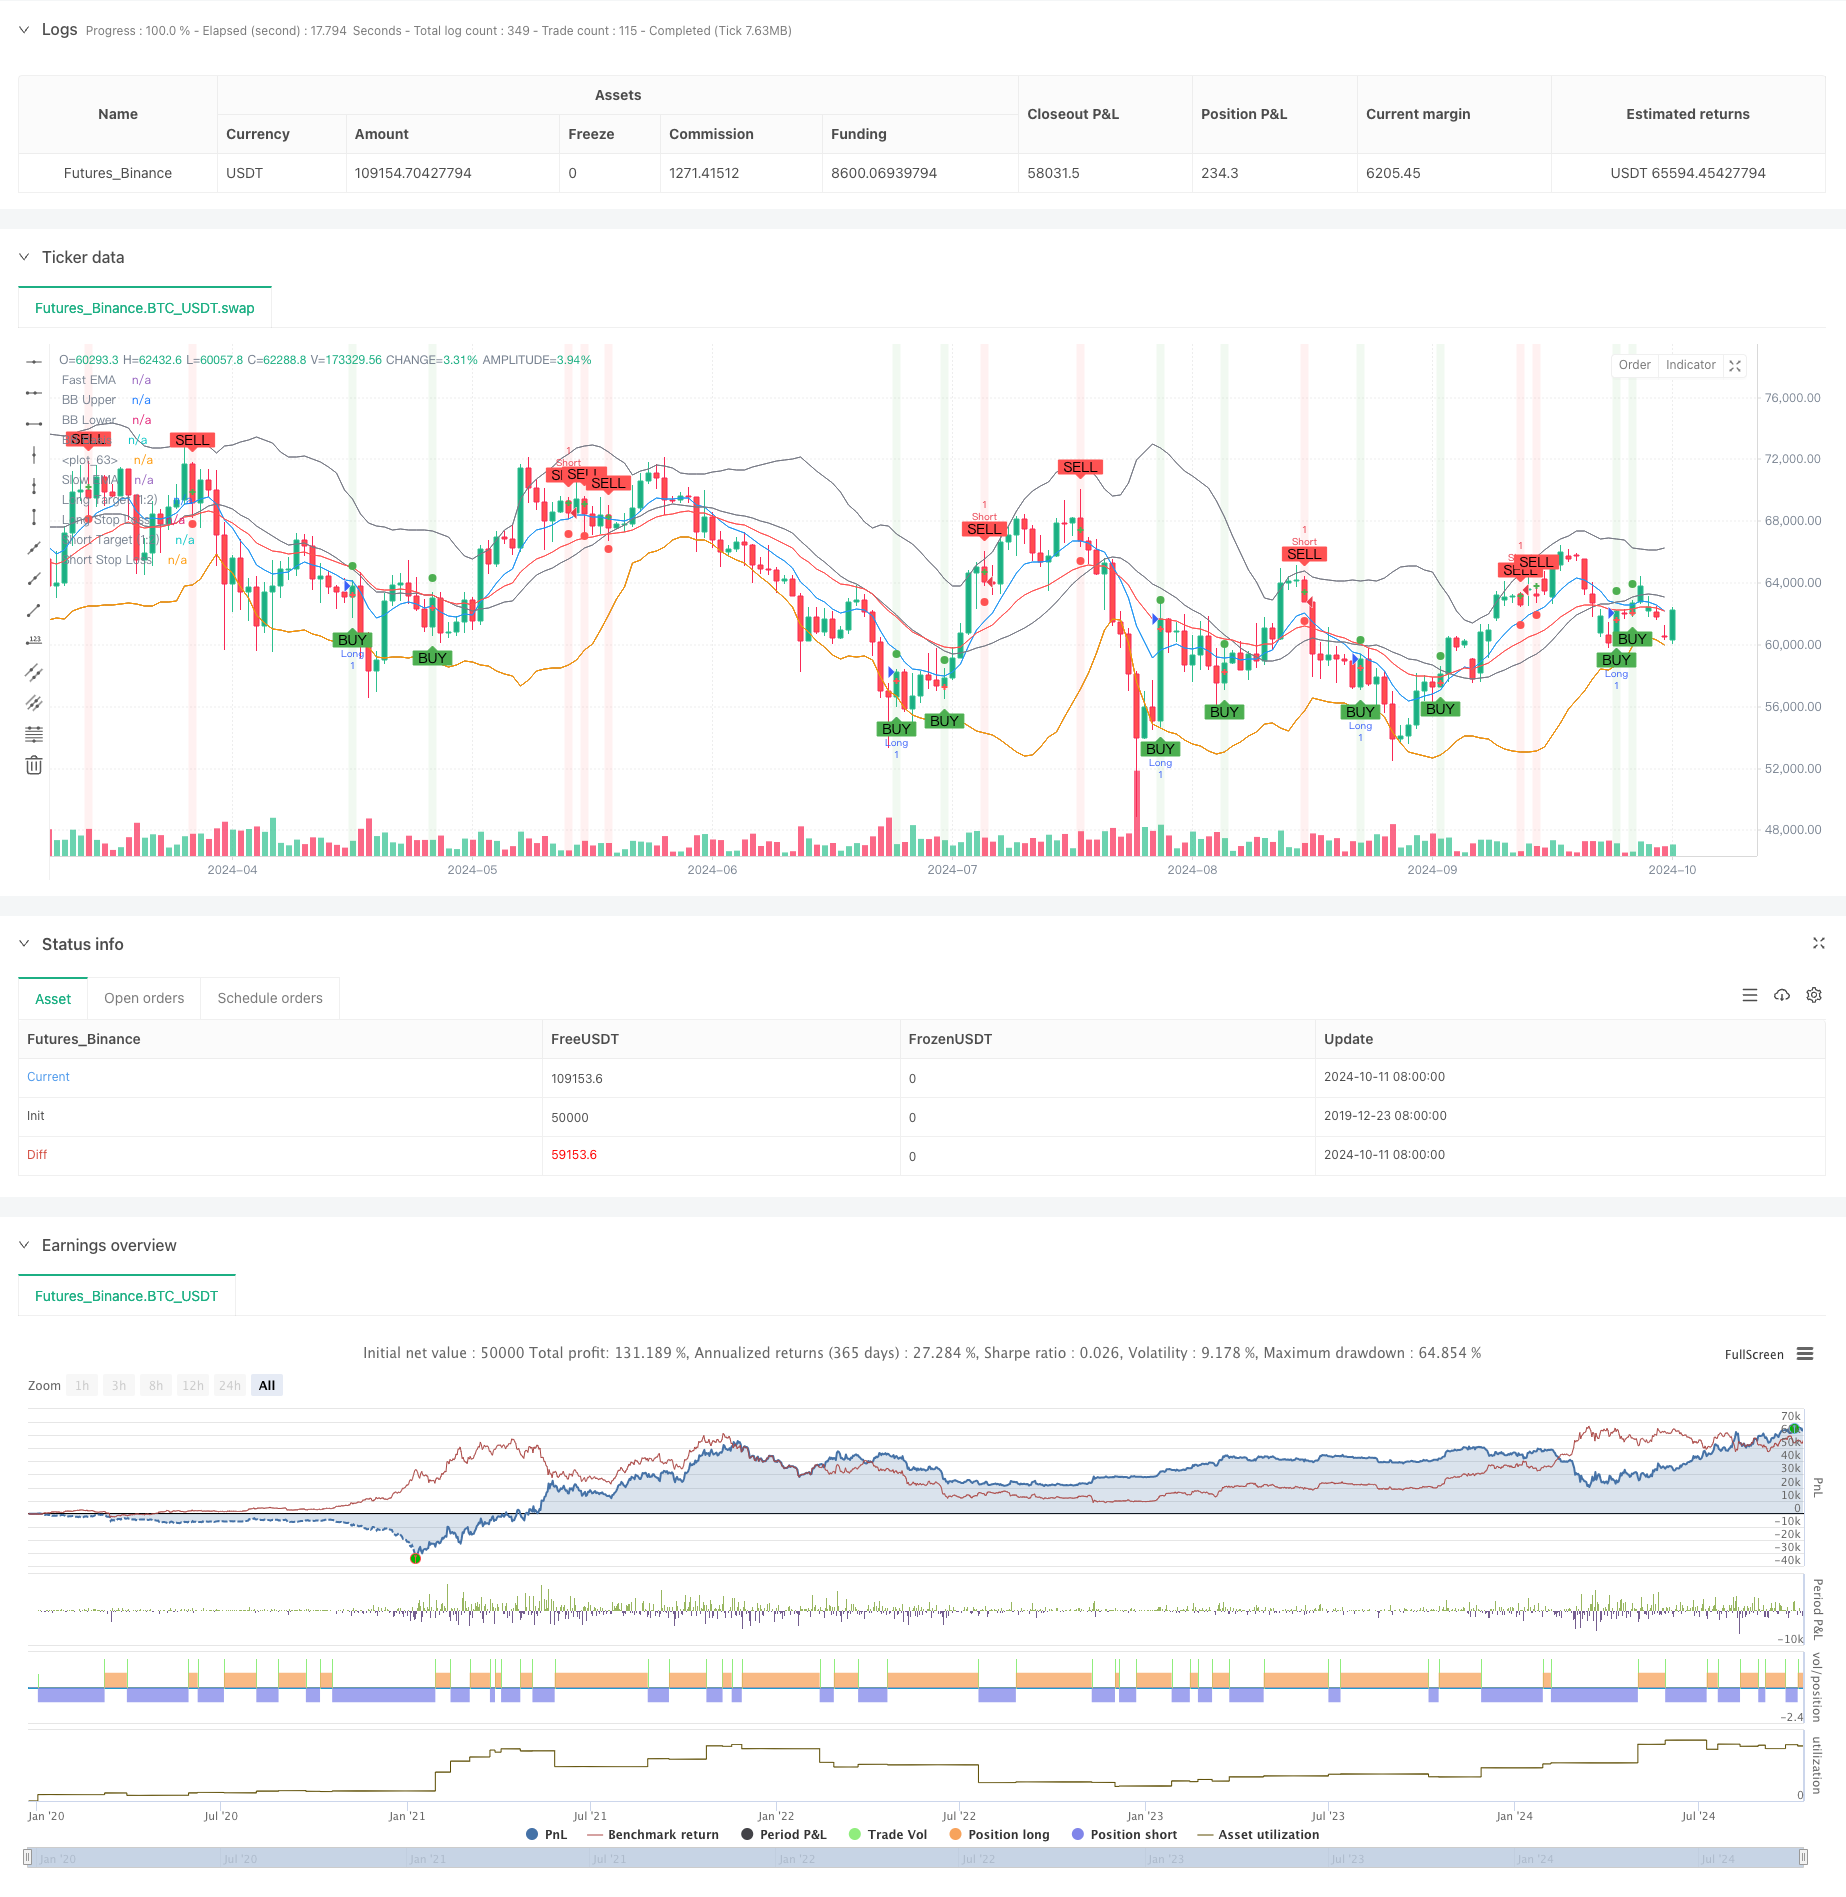
[trans]
概述
这个策略是一个结合了多个技术指标的日内交易系统,主要利用均线交叉、RSI超买超卖、成交量确认、布林带和蜡烛图形态来判断入场时机。它还包含了一个固定的1:2风险收益比和百分比止损设置,旨在实现风险管理和利润最大化。
策略原理
该策略基于以下几个核心原理:
-
均线交叉:使用快速(9周期)和慢速(21周期)指数移动平均线(EMA)的交叉来识别潜在的趋势变化。
-
RSI过滤:通过检查相对强弱指数(RSI)是否处于超买(>70)或超卖(<30)状态来确认趋势强度。
-
成交量确认:要求成交量超过设定的最小阈值,以确保足够的市场参与度。
-
布林带:使用布林带来识别价格波动性和潜在的支撑/阻力位。
-
蜡烛图形态:结合看涨和看跌吞没形态来增强入场信号的可靠性。
-
风险管理:采用固定的1:2风险收益比和基于百分比的止损设置。
交易信号在满足上述条件且价格位于布林带中线以下(多头)或以上(空头)时触发。
策略优势
-
多重确认:结合多个技术指标和图表形态,提高了交易信号的可靠性。
-
动态风险管理:通过实时计算止损和目标价位,适应不同的市场环境。
-
趋势跟踪与反转结合:既可以捕捉趋势延续,又能识别潜在的反转机会。
-
波动性适应:利用布林带来调整对市场波动的敏感度。
-
灵活性:允许用户根据个人偏好和市场特征调整各项参数。
策略风险
-
过度交易:在高波动市场中可能产生过多的交易信号,增加交易成本。
-
假突破:在横盘市场中,可能会出现频繁的假突破信号。
-
滑点风险:在快速移动的市场中,实际执行价格可能与信号触发价格有显著差异。
-
参数敏感性:策略性能可能对参数设置高度敏感,需要仔细优化和回测。
优化方向
-
动态参数调整:考虑根据市场波动性自动调整EMA周期和RSI阈值。
-
加入趋势强度过滤:引入ADX等指标来评估趋势强度,避免在弱趋势中交易。
-
时间过滤:加入时间过滤器,避免在波动性较低的时段交易。
-
改进止损机制:考虑使用跟踪止损或基于ATR的动态止损来更好地管理风险。
-
增加盈利锁定:在达到部分目标价位时,考虑锁定部分利润并移动止损。
总结
这个日内交易策略通过结合多个技术指标和风险管理技术,提供了一个全面的交易系统。它的优势在于多重确认和动态风险管理,但也面临过度交易和参数敏感性的挑战。通过进一步优化,如动态参数调整和改进的止损机制,该策略有潜力成为一个更加稳健和适应性强的交易系统。然而,在实盘交易中应用之前,仍需进行广泛的回测和细致的参数优化。
||
Overview
This strategy is an intraday trading system that combines multiple technical indicators, primarily utilizing EMA crossovers, RSI overbought/oversold conditions, volume confirmation, Bollinger Bands, and candlestick patterns to determine entry points. It also incorporates a fixed 1:2 risk-reward ratio and percentage-based stop loss for risk management and profit maximization.
Strategy Principles
The strategy is based on the following core principles:
-
EMA Crossover: Uses the crossover of fast (9-period) and slow (21-period) Exponential Moving Averages (EMA) to identify potential trend changes.
-
RSI Filter: Confirms trend strength by checking if the Relative Strength Index (RSI) is overbought (>70) or oversold (<30).
-
Volume Confirmation: Requires volume to exceed a set minimum threshold to ensure sufficient market participation.
-
Bollinger Bands: Utilizes Bollinger Bands to identify price volatility and potential support/resistance levels.
-
Candlestick Patterns: Incorporates bullish and bearish engulfing patterns to enhance entry signal reliability.
-
Risk Management: Employs a fixed 1:2 risk-reward ratio and percentage-based stop loss.
Trade signals are triggered when these conditions are met and price is below (for longs) or above (for shorts) the Bollinger Bands middle line.
Strategy Advantages
-
Multiple Confirmations: Combines various technical indicators and chart patterns, increasing the reliability of trade signals.
-
Dynamic Risk Management: Calculates stop loss and target levels in real-time, adapting to different market conditions.
-
Trend Following and Reversal Combination: Capable of capturing both trend continuation and potential reversal opportunities.
-
Volatility Adaptation: Uses Bollinger Bands to adjust sensitivity to market volatility.
-
Flexibility: Allows users to adjust parameters based on personal preferences and market characteristics.
Strategy Risks
-
Overtrading: May generate excessive trade signals in highly volatile markets, increasing transaction costs.
-
False Breakouts: Prone to frequent false signals in ranging markets.
-
Slippage Risk: Actual execution prices may significantly differ from signal trigger prices in fast-moving markets.
-
Parameter Sensitivity: Strategy performance may be highly sensitive to parameter settings, requiring careful optimization and backtesting.
Optimization Directions
-
Dynamic Parameter Adjustment: Consider automatically adjusting EMA periods and RSI thresholds based on market volatility.
-
Trend Strength Filter: Introduce indicators like ADX to assess trend strength and avoid trading in weak trends.
-
Time Filter: Add a time filter to avoid trading during low volatility periods.
-
Improved Stop Loss Mechanism: Consider using trailing stops or ATR-based dynamic stops for better risk management.
-
Profit Locking: Implement partial profit taking and stop loss adjustment upon reaching certain target levels.
Conclusion
This intraday trading strategy offers a comprehensive trading system by combining multiple technical indicators and risk management techniques. Its strengths lie in multiple confirmations and dynamic risk management, but it also faces challenges such as overtrading and parameter sensitivity. Through further optimization, such as dynamic parameter adjustment and improved stop loss mechanisms, the strategy has the potential to become a more robust and adaptive trading system. However, extensive backtesting and careful parameter optimization are still necessary before applying it to live trading.
[/trans]
Source (PineScript)
/*backtest
start: 2019-12-23 08:00:00
end: 2024-10-12 08:00:00
period: 1d
basePeriod: 1d
exchanges: [{"eid":"Futures_Binance","currency":"BTC_USDT"}]
*/

//@version=5
strategy("Intraday Strategy with Risk-Reward 1:2, Bollinger Bands, and Stop Loss", overlay=true)

// Parameters
fastLength = input(9, title="Fast EMA Length")
slowLength = input(21, title="Slow EMA Length")
rsiLength = input(14, title="RSI Length")
overbought = input(70, title="RSI Overbought Level")
oversold = input(30, title="RSI Oversold Level")
minVolume = input(100000, title="Min Volume for Confirmation")
bbLength = input(20, title="Bollinger Bands Length")
bbStdDev = input.float(2.0, title="Bollinger Bands Standard Deviation")
stopLossPercent = input.float(1, title="Stop Loss (%)", minval=0.1) // Stop Loss %
riskRewardRatio = 2.0 // Fixed risk-reward ratio 1:2

// Indicators
fastEMA = ta.ema(close, fastLength)
slowEMA = ta.ema(close, slowLength)
rsi = ta.rsi(close, rsiLength)
volumeCondition = volume > minVolume

// Bollinger Bands
bbBasis = ta.sma(close, bbLength) // Basis (middle line) is the SMA
bbUpper = bbBasis + bbStdDev * ta.stdev(close, bbLength) // Upper band
bbLower = bbBasis - bbStdDev * ta.stdev(close, bbLength) // Lower band

// Bullish Engulfing Pattern
bullishEngulfing = close > open and close[1] < open[1] and close > open[1]

// Bearish Engulfing Pattern
bearishEngulfing = close < open and close[1] > open[1] and close < open[1]

// Entry Conditions
bullishCrossover = ta.crossover(fastEMA, slowEMA) and rsi < oversold and volumeCondition
bearishCrossover = ta.crossunder(fastEMA, slowEMA) and rsi > overbought and volumeCondition

// Signal Conditions
longCondition = (bullishCrossover or bullishEngulfing) and close < bbBasis // Buy below Bollinger Bands middle line
shortCondition = (bearishCrossover or bearishEngulfing) and close > bbBasis // Sell above Bollinger Bands middle line

// Stop Loss and Target Calculation for Long and Short Positions
stopLossLong = close * (1 - stopLossPercent / 100) // Stop loss for long positions
targetLong = close + (close - stopLossLong) * riskRewardRatio // Target for long positions (1:2 ratio)

stopLossShort = close * (1 + stopLossPercent / 100) // Stop loss for short positions
targetShort = close - (stopLossShort - close) * riskRewardRatio // Target for short positions (1:2 ratio)

// Strategy Execution with Stop Loss and Target
if (longCondition)
    strategy.entry("Long", strategy.long, stop=stopLossLong, limit=targetLong)

if (shortCondition)
    strategy.entry("Short", strategy.short, stop=stopLossShort, limit=targetShort)

// Plot Moving Averages for Visualization
plot(fastEMA, color=color.blue, linewidth=1, title="Fast EMA")
plot(slowEMA, color=color.red, linewidth=1, title="Slow EMA")

// Plot Bollinger Bands with Color Fill
plot(bbUpper, "BB Upper", color=color.gray, linewidth=1)
plot(bbLower, "BB Lower", color=color.gray, linewidth=1)
plot(bbBasis, "BB Basis", color=color.gray, linewidth=1)
fill(plot(bbUpper), plot(bbLower), color=color.new(color.blue, 90), title="Bollinger Bands Area")

// Plot Risk-Reward Levels
plot(longCondition ? targetLong : na, color=color.green, linewidth=2, title="Long Target (1:2)", style=plot.style_circles)
plot(shortCondition ? targetShort : na, color=color.red, linewidth=2, title="Short Target (1:2)", style=plot.style_circles)

plot(longCondition ? stopLossLong : na, color=color.red, linewidth=2, title="Long Stop Loss", style=plot.style_cross)
plot(shortCondition ? stopLossShort : na, color=color.green, linewidth=2, title="Short Stop Loss", style=plot.style_cross)

// Plot Buy and Sell Signals
plotshape(series=longCondition, location=location.belowbar, color=color.green, style=shape.labelup, size=size.small, title="Buy Signal", text="BUY")
plotshape(series=shortCondition, location=location.abovebar, color=color.red, style=shape.labeldown, size=size.small, title="Sell Signal", text="SELL")

// Clean Background Color for Trades
bgcolor(longCondition ? color.new(color.green, 90) : na, title="Background Long", transp=90)
bgcolor(shortCondition ? color.new(color.red, 90) : na, title="Background Short", transp=90)
Detail
https://www.fmz.com/strategy/469613
Last Modified
2024-10-14 11:31:59