
7.9 KiB
Name
动态随机相对强弱指标双线交叉自适应交易策略-Adaptive-Trading-Strategy-Based-on-Stochastic-RSI-Dual-Line-Crossover
Author
ChaoZhang
Strategy Description
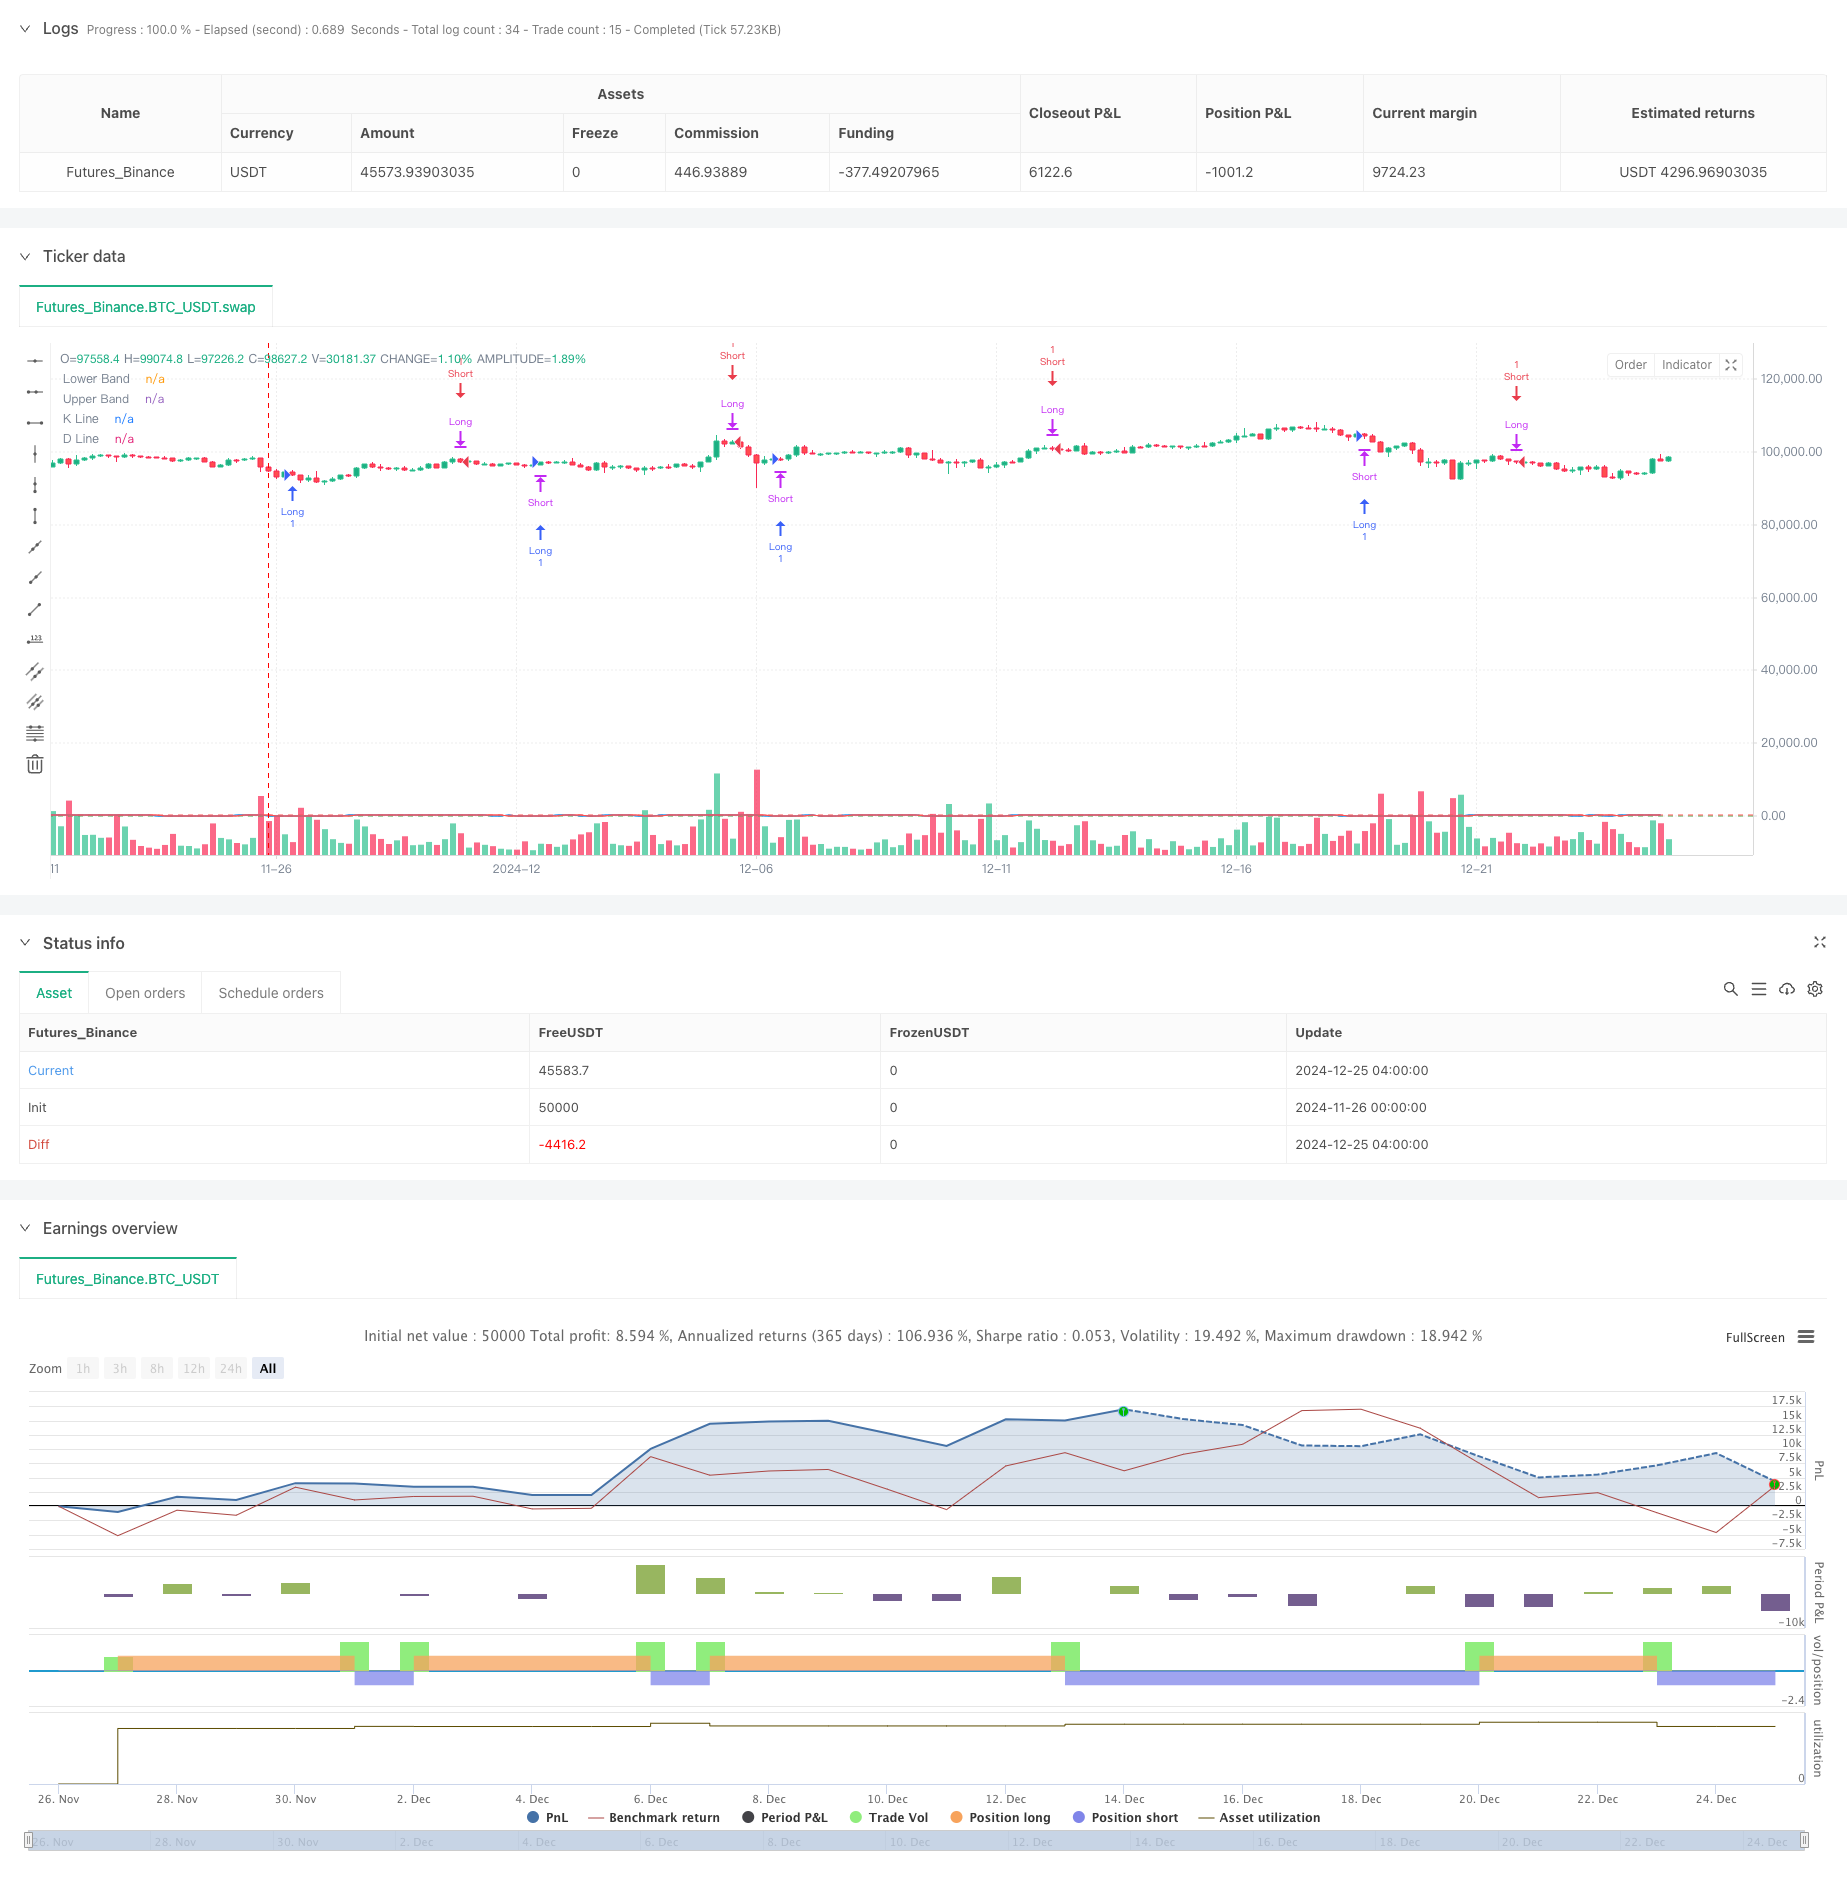
[trans]
概述
本策略是一个基于随机相对强弱指标(Stochastic RSI)的自适应交易系统,通过监测K线与D线在超买超卖区域的交叉信号来进行交易决策。策略整合了传统RSI和随机指标的优势,通过对价格动量和波动的双重确认,提供了更可靠的交易信号。
策略原理
策略的核心逻辑基于以下几个关键步骤:
- 首先计算传统的RSI指标,捕捉价格的相对强弱
- 对RSI值进行随机指标计算,得到更敏感的动量指标
- 使用简单移动平均(SMA)对随机RSI进行平滑,生成K线和D线
- 在超买超卖区域(20/80)设置过滤条件,寻找高质量交易机会
- 当K线在20以下向上穿越D线时,平空仓并开多仓
- 当K线在80以上向下穿越D线时,平多仓并开空仓
- 通过时间过滤器限制交易周期,提高策略的适应性
策略优势
- 信号可靠性高:通过RSI和随机指标的双重确认,大大降低了假突破的风险
- 自适应性强:参数可根据不同市场条件灵活调整
- 风险控制完善:通过超买超卖区域的限制,避免在趋势延续时过早入场
- 执行机制清晰:使用交叉信号作为触发条件,减少主观判断
- 可扩展性好:预留了时间过滤接口,便于进一步优化
策略风险
- 震荡市场风险:在横盘震荡市场可能产生频繁交易
- 滞后性风险:移动平均线的平滑处理会导致信号滞后
- 参数敏感性:不同参数组合可能导致策略表现差异较大
- 市场环境依赖:在强趋势市场中可能错过部分利润
风险控制建议:
- 建议结合波动率指标进行市场环境判断
- 可以添加止损止盈机制提高风险收益比
- 考虑使用动态参数自适应机制
- 增加趋势过滤器避免逆势交易
策略优化方向
- 动态参数优化:
- 根据市场波动率动态调整超买超卖阈值
- 通过机器学习优化参数组合
- 信号优化:
- 增加成交量确认机制
- 添加趋势确认指标
- 实现多时间框架协同分析
- 风险管理优化:
- 实现动态仓位管理
- 添加追踪止损机制
- 设计智能止盈方案
- 执行机制优化:
- 优化订单执行时机
- 实现部分仓位操作
- 添加滑点控制机制
总结
该策略通过结合RSI和随机指标的优势,构建了一个可靠的交易系统。策略的核心优势在于信号的可靠性和系统的可扩展性,通过合理的参数设置和风险控制机制,可以在不同市场环境下保持稳定表现。建议交易者在实盘使用时,根据具体市场特征调整参数,并注意做好风险控制。 ||
Overview
This strategy is an adaptive trading system based on the Stochastic RSI indicator, which makes trading decisions by monitoring crossover signals between K-line and D-line in overbought and oversold regions. The strategy integrates the advantages of traditional RSI and stochastic indicators, providing more reliable trading signals through dual confirmation of price momentum and volatility.
Strategy Principle
The core logic of the strategy is based on the following key steps:
- First calculate the traditional RSI indicator to capture price relative strength
- Apply stochastic calculations to RSI values to obtain a more sensitive momentum indicator
- Use Simple Moving Average (SMA) to smooth the Stochastic RSI, generating K-line and D-line
- Set filtering conditions in overbought/oversold regions (20/80) to seek high-quality trading opportunities
- When K-line crosses above D-line below 20, close short position and open long position
- When K-line crosses below D-line above 80, close long position and open short position
- Use time filter to limit trading periods, improving strategy adaptability
Strategy Advantages
- High signal reliability: Greatly reduces false breakout risks through dual confirmation of RSI and stochastic indicators
- Strong adaptability: Parameters can be flexibly adjusted according to different market conditions
- Comprehensive risk control: Avoids early entry during trend continuation through overbought/oversold region restrictions
- Clear execution mechanism: Uses crossover signals as triggers, reducing subjective judgment
- Good extensibility: Reserved time filtering interface for further optimization
Strategy Risks
- Oscillation market risk: May generate frequent trades in sideways markets
- Lag risk: Moving average smoothing leads to signal delays
- Parameter sensitivity: Different parameter combinations may cause significant strategy performance variations
- Market environment dependence: May miss some profits in strong trend markets
Risk Control Suggestions:
- Recommend combining volatility indicators for market environment judgment
- Can add stop-loss and take-profit mechanisms to improve risk-reward ratio
- Consider using dynamic parameter adaptation mechanism
- Add trend filters to avoid counter-trend trading
Strategy Optimization Directions
- Dynamic Parameter Optimization:
- Dynamically adjust overbought/oversold thresholds based on market volatility
- Optimize parameter combinations through machine learning
- Signal Optimization:
- Add volume confirmation mechanism
- Add trend confirmation indicators
- Implement multi-timeframe analysis
- Risk Management Optimization:
- Implement dynamic position management
- Add trailing stop-loss mechanism
- Design smart take-profit scheme
- Execution Mechanism Optimization:
- Optimize order execution timing
- Implement partial position operations
- Add slippage control mechanism
Summary
This strategy builds a reliable trading system by combining the advantages of RSI and stochastic indicators. The core advantages lie in signal reliability and system extensibility. Through reasonable parameter settings and risk control mechanisms, it can maintain stable performance in different market environments. It is recommended that traders adjust parameters according to specific market characteristics and pay attention to risk control when using it in live trading.[/trans]
Source (PineScript)
/*backtest
start: 2024-11-26 00:00:00
end: 2024-12-25 08:00:00
period: 4h
basePeriod: 4h
exchanges: [{"eid":"Futures_Binance","currency":"BTC_USDT"}]
*/

//@version=5
strategy("Stochastic RSI Strategy", overlay=true)

// Ayarlar
k_period = input.int(14, title="K Period")
d_period = input.int(3, title="D Period")
stoch_length = input.int(14, title="Stoch Length")
stoch_smoothK = input.int(3, title="Stoch SmoothK")
stoch_smoothD = input.int(3, title="Stoch SmoothD")

lower_band = input.int(20, title="Lower Band")
upper_band = input.int(80, title="Upper Band")

start_date = input(timestamp("2023-01-01 00:00"), title="Start Date")
end_date = input(timestamp("2024-12-31 23:59"), title="End Date")
use_date_filter = input.bool(true, title="Use Date Filter")

// Stochastic RSI hesaplama
rsi = ta.rsi(close, stoch_length)
stoch_rsi = ta.stoch(rsi, rsi, rsi, k_period)
K = ta.sma(stoch_rsi, stoch_smoothK)
D = ta.sma(K, stoch_smoothD)

// Tarih filtresi
is_in_date_range = true

// Alım-satım koşulları
long_condition = ta.crossover(K, D) and K < lower_band and is_in_date_range
short_condition = ta.crossunder(K, D) and K > upper_band and is_in_date_range

// İşlemleri yürüt
if (long_condition)
    strategy.close("Short")
    strategy.entry("Long", strategy.long)

if (short_condition)
    strategy.close("Long")
    strategy.entry("Short", strategy.short)

// Grafikte göstergeleri çiz
plot(K, title="K Line", color=color.blue)
plot(D, title="D Line", color=color.red)
hline(lower_band, "Lower Band", color=color.green)
hline(upper_band, "Upper Band", color=color.red)
Detail
https://www.fmz.com/strategy/476262
Last Modified
2024-12-27 15:06:56