
8.0 KiB
Name
动态跟踪型波浪趋势策略-Dynamic-Wave-Trend-Tracking-Strategy
Author
ChaoZhang
Strategy Description
[trans]
概述
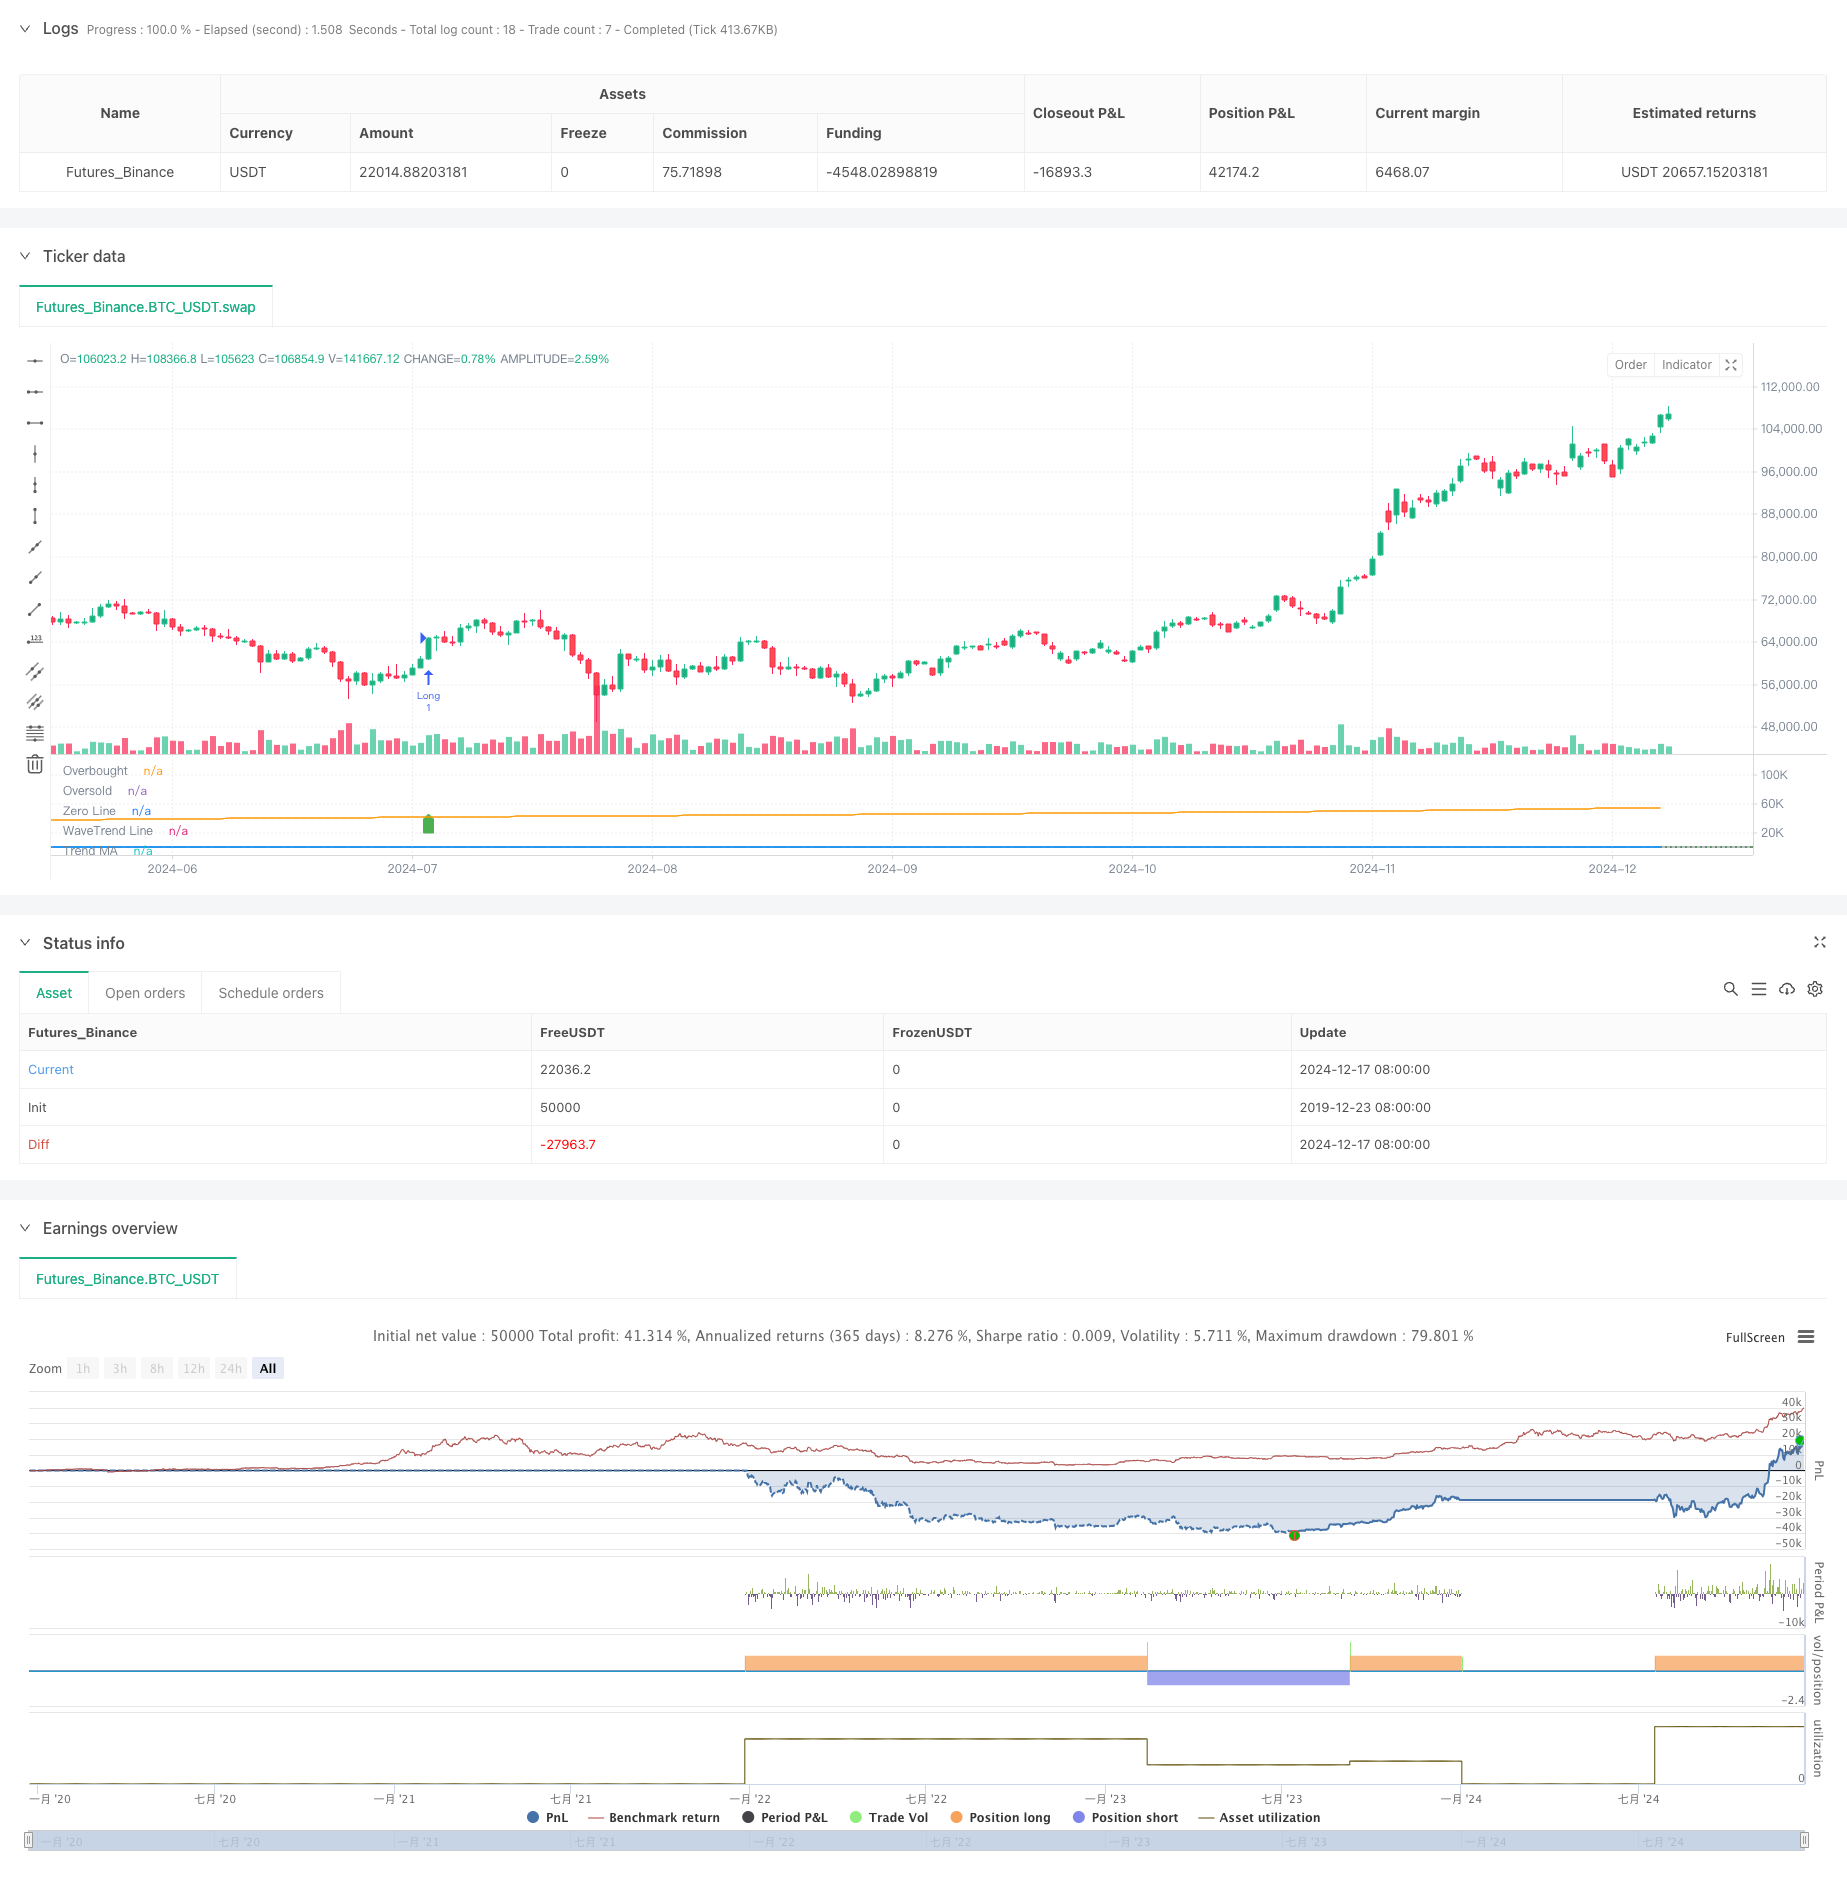
该策略是一个基于WaveTrend指标和趋势跟踪的量化交易系统。它通过将WaveTrend指标与移动平均线相结合,形成了一个完整的交易决策框架。策略利用EMA和SMA计算波浪趋势值和市场整体趋势,通过设定超买超卖阈值来识别市场转折点,并结合趋势过滤器来提高交易的准确性。
策略原理
策略的核心是通过以下步骤来实现:
- 首先计算HLC均价(最高价、最低价和收盘价的平均值)
- 使用EMA对HLC均价进行平滑处理得到ESA线
- 计算HLC均价与ESA线之间的偏差,并使用EMA进行平滑
- 基于偏差计算K值,并通过两次EMA平滑得到最终的TCI线
- 使用SMA计算长期趋势线作为趋势过滤器
- 当TCI线突破超买超卖水平且符合趋势方向时,产生交易信号
策略优势
- 信号可靠性高:通过结合WaveTrend指标和趋势过滤器,有效降低了假信号
- 风险控制完善:设置了清晰的超买超卖阈值,帮助及时止损
- 适应性强:策略参数可根据不同市场条件灵活调整
- 操作逻辑清晰:入场和出场条件明确,易于执行
- 综合分析:同时考虑短期波动和长期趋势,提高了交易的稳定性
策略风险
- 趋势反转风险:在剧烈波动市场中可能出现滞后
- 参数敏感性:不同参数组合可能导致截然不同的结果
- 市场适应性:在震荡市场中可能产生频繁交易
- 资金管理:需要合理控制仓位以应对市场波动
- 技术依赖:依赖技术指标可能忽视基本面因素
策略优化方向
- 加入波动率过滤:在高波动率时期调整交易阈值
- 引入多周期分析:结合不同时间周期的信号提高准确率
- 优化参数自适应:根据市场状态动态调整指标参数
- 完善止盈止损:增加动态止盈止损机制
- 添加成交量确认:结合成交量分析提高信号可靠性
总结
该策略通过巧妙结合WaveTrend指标和趋势过滤器,构建了一个稳健的交易系统。策略在保持操作简洁的同时,实现了对市场的全面分析。虽然存在一定的风险,但通过合理的风险管理和持续优化,该策略具有良好的实用价值和发展潜力。 ||
Overview
This strategy is a quantitative trading system based on the WaveTrend indicator and trend following. It combines the WaveTrend indicator with moving averages to form a complete trading decision framework. The strategy utilizes EMA and SMA to calculate wave trend values and overall market trends, identifies market turning points through overbought and oversold thresholds, and incorporates trend filters to improve trading accuracy.
Strategy Principle
The strategy's core is implemented through the following steps:
- Calculate HLC average price (average of high, low, and closing prices)
- Smooth the HLC average using EMA to obtain the ESA line
- Calculate and smooth the deviation between HLC average and ESA line using EMA
- Calculate K value based on deviation and smooth twice with EMA to get the final TCI line
- Use SMA to calculate long-term trend line as trend filter
- Generate trading signals when TCI line breaks through overbought/oversold levels and aligns with trend direction
Strategy Advantages
- High signal reliability: Effectively reduces false signals by combining WaveTrend indicator and trend filter
- Comprehensive risk control: Clear overbought/oversold thresholds for timely stop-loss
- Strong adaptability: Strategy parameters can be flexibly adjusted for different market conditions
- Clear operational logic: Explicit entry and exit conditions, easy to execute
- Comprehensive analysis: Considers both short-term fluctuations and long-term trends, improving trading stability
Strategy Risks
- Trend reversal risk: May lag in volatile markets
- Parameter sensitivity: Different parameter combinations may lead to drastically different results
- Market adaptability: May generate frequent trades in ranging markets
- Capital management: Requires reasonable position control to handle market volatility
- Technical dependence: Reliance on technical indicators may overlook fundamental factors
Strategy Optimization Directions
- Add volatility filter: Adjust trading thresholds during high volatility periods
- Incorporate multi-timeframe analysis: Combine signals from different timeframes to improve accuracy
- Optimize parameter adaptation: Dynamically adjust indicator parameters based on market conditions
- Improve profit/loss management: Add dynamic take-profit and stop-loss mechanisms
- Add volume confirmation: Incorporate volume analysis to enhance signal reliability
Summary
The strategy constructs a robust trading system by cleverly combining the WaveTrend indicator with trend filters. While maintaining operational simplicity, it achieves comprehensive market analysis. Although certain risks exist, the strategy has good practical value and development potential through proper risk management and continuous optimization.[/trans]
Source (PineScript)
/*backtest
start: 2019-12-23 08:00:00
end: 2024-12-18 08:00:00
period: 1d
basePeriod: 1d
exchanges: [{"eid":"Futures_Binance","currency":"BTC_USDT"}]
*/

// This Pine Script™ code is subject to the terms of the Mozilla Public License 2.0 at https://mozilla.org/MPL/2.0/
// © mojomarv

//@version=6
strategy("WaveTrend with Trend Filter", shorttitle="WaveTrend Trend", overlay=false, initial_capital = 100000)

// Inputs for the WaveTrend indicator
inputLength = input.int(10, title="Channel Length", minval=1)
avgLength = input.int(21, title="Average Length", minval=1)
obLevel = input.float(45, title="Overbought Level")
osLevel = input.float(-45, title="Oversold Level")
showSignals = input.bool(true, title="Show Buy/Sell Signals")

// Trend filter input
maLength = input.int(500, title="Trend MA Length", minval=1)

// Calculate WaveTrend values
hlc_avg = (high + low + close) / 3  // Renamed from hlc3 to hlc_avg
esa = ta.ema(hlc_avg, inputLength)
d = ta.ema(math.abs(hlc_avg - esa), inputLength)
k = (hlc_avg - esa) / (0.015 * d)
ci = ta.ema(k, avgLength)
tci = ta.ema(ci, avgLength)

// Moving average for trend detection
trendMA = ta.sma(close, maLength)

// Determine trend
bullishTrend = close > trendMA
bearishTrend = close < trendMA

// Generate signals with trend filter
crossUp = ta.crossover(tci, osLevel)
crossDown = ta.crossunder(tci, obLevel)

// Plot WaveTrend
plot(tci, title="WaveTrend Line", color=color.new(color.blue, 0), linewidth=2)
hline(obLevel, "Overbought", color=color.red, linestyle=hline.style_dotted)
hline(osLevel, "Oversold", color=color.green, linestyle=hline.style_dotted)
hline(0, "Zero Line", color=color.gray, linestyle=hline.style_solid)

// Plot moving average for trend visualization
plot(trendMA, title="Trend MA", color=color.orange, linewidth=1)

// Plot buy and sell signals
plotshape(showSignals and crossUp, title="Buy Signal", location=location.belowbar, style=shape.labelup, color=color.new(color.green, 0), size=size.small)
plotshape(showSignals and crossDown, title="Sell Signal", location=location.abovebar, style=shape.labeldown, color=color.new(color.red, 0), size=size.small)

// Alerts
alertcondition(crossUp, title="Buy Alert", message="WaveTrend Buy Signal (Trend Confirmed)")
alertcondition(crossDown, title="Sell Alert", message="WaveTrend Sell Signal (Trend Confirmed)")
alertcondition(bullishTrend, title="bull", message="WaveTrend Sell Signal (Trend Confirmed)")
alertcondition(bearishTrend, title="bear", message="WaveTrend Sell Signal (Trend Confirmed)")

// Strategy logic
if crossUp and bullishTrend
    strategy.entry("Long", strategy.long)

if crossDown
    strategy.close("Long")

if crossDown and bearishTrend
    strategy.entry("Short", strategy.short)

if crossUp
    strategy.close("Short")
Detail
https://www.fmz.com/strategy/475624
Last Modified
2024-12-20 16:17:27