
12 KiB
Name
动态趋势跟踪策略-Dynamic-Trend-Following-Strategy
Author
ChaoZhang
Strategy Description
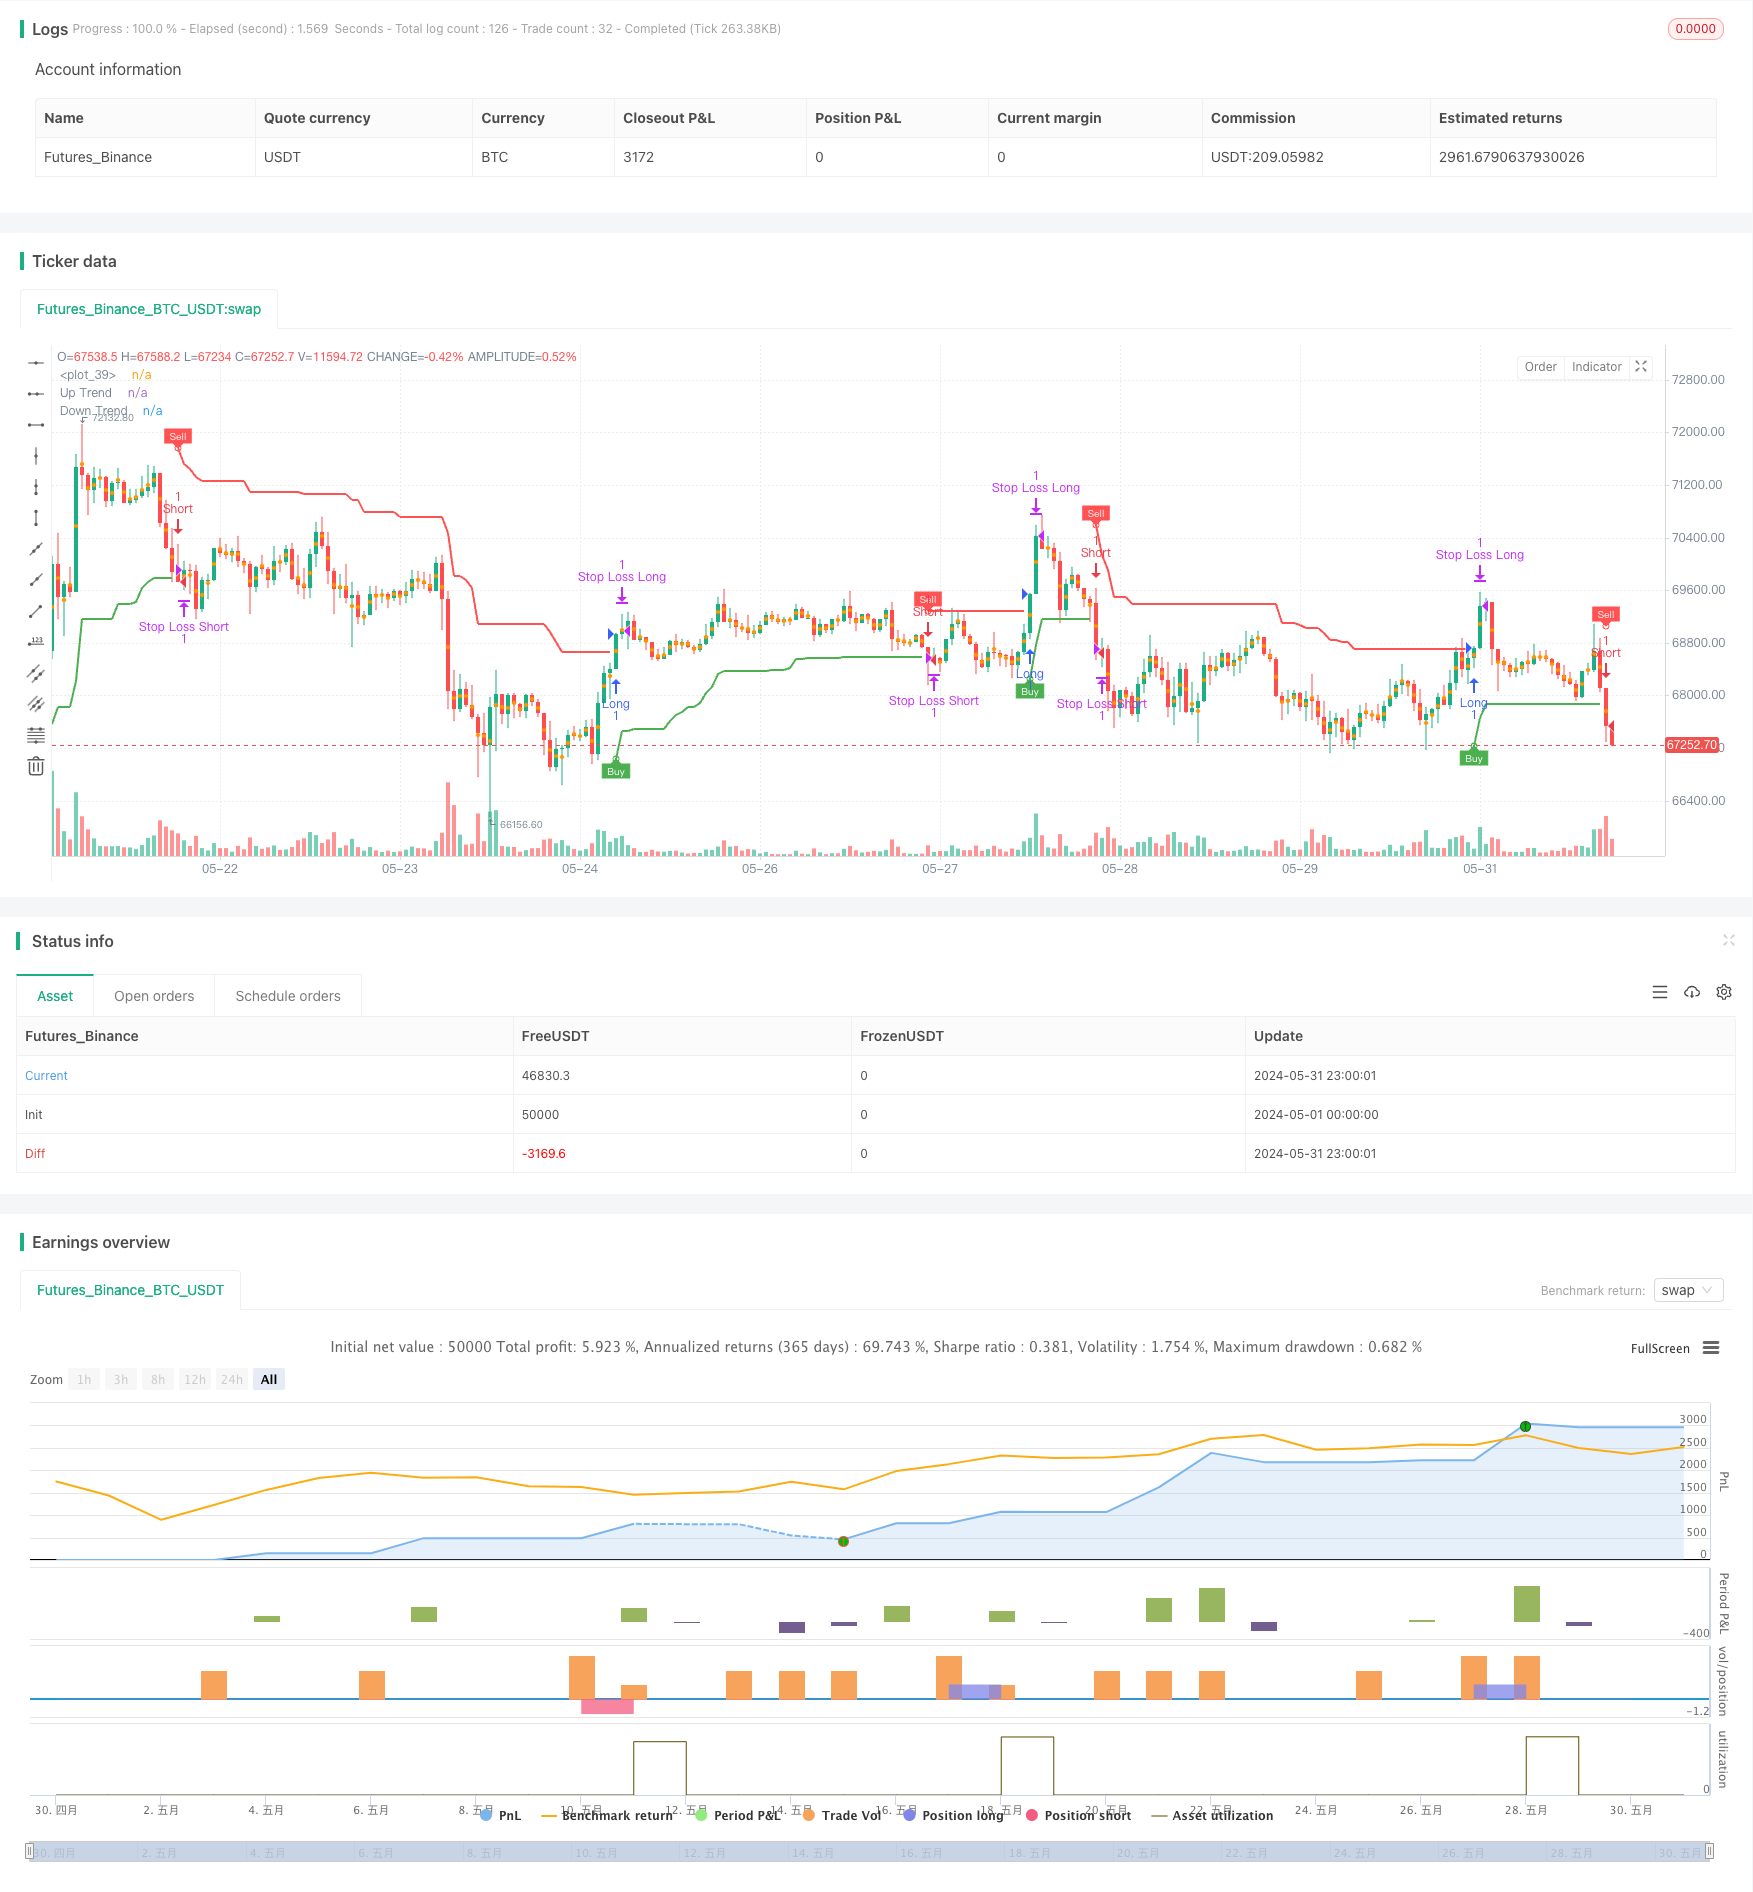
[trans]
概述
该策略使用Supertrend指标来捕捉市场趋势。Supertrend指标结合了价格和波动率,当指标线为绿色时表示上升趋势,为红色时表示下降趋势。策略通过检测指标线的颜色变化来产生买卖信号,同时利用指标线作为动态止损位。策略还引入了移动止损和固定止盈逻辑,以优化策略表现。
策略原理
- 计算Supertrend指标的上轨(up)和下轨(dn),并根据收盘价与上下轨的关系判断当前趋势方向(trend)。
- 当趋势由下降(-1)转为上升(1)时,产生买入信号(buySignal);当趋势由上升(1)转为下降(-1)时,产生卖出信号(sellSignal)。
- 在产生买入信号时,开仓做多,并将下轨(dn)设为止损位;在产生卖出信号时,开仓做空,并将上轨(up)设为止损位。
- 引入移动止损逻辑,当价格上涨/下跌一定点数(trailingValue)时,将止损位上移/下移,实现止损保护。
- 引入固定止盈逻辑,当趋势发生变化时,平仓获利了结。
策略优势
- 适应性强:Supertrend指标结合价格和波动率,能够适应不同的市场状态和交易品种。
- 动态止损:利用指标线作为动态止损位,可以有效控制风险,减少损失。
- 移动止损:引入移动止损逻辑,可以在趋势持续时保护利润,提高策略盈利能力。
- 明确信号:策略产生的买卖信号清晰明了,易于操作和执行。
- 参数灵活:策略的参数(如ATR周期、ATR乘数等)可以根据市场特点和交易风格进行调整,提高适应性。
策略风险
- 参数风险:不同参数设置可能导致策略表现差异较大,需要进行充分的回测和参数优化。
- 震荡市风险:在震荡市场中,频繁的趋势变化可能导致策略产生较多的交易信号,增加交易成本和滑点风险。
- 趋势突变风险:当市场趋势突然发生变化时,策略可能来不及及时调整仓位,导致损失加大。
- 过度优化风险:对策略进行过度优化可能导致曲线拟合,在未来市场中表现不佳。
策略优化方向
- 引入多时间框架分析,确认趋势的稳健性,减少震荡市中的频繁交易。
- 结合其他技术指标或基本面因素,提高趋势判断的准确性。
- 优化止损和止盈逻辑,如引入动态止盈或风险收益比等,提高策略的盈亏比。
- 对参数进行稳健性测试,选择在不同市场状态下都能保持良好表现的参数组合。
- 引入仓位管理和资金管理规则,控制单笔交易风险和总体风险。
总结
动态趋势跟踪策略利用Supertrend指标捕捉市场趋势,通过动态止损和移动止损控制风险,同时利用固定止盈锁定利润。该策略适应性强,信号明确,易于操作。但在实际应用中,需要注意参数优化、震荡市风险和趋势突变风险等问题。通过引入多时间框架分析、优化止损止盈逻辑、参数稳健性测试等措施,可以进一步提升策略的表现和稳定性。
||
Overview
This strategy utilizes the Supertrend indicator to capture market trends. The Supertrend indicator combines price and volatility, with a green line indicating an uptrend and a red line indicating a downtrend. The strategy generates buy and sell signals by detecting changes in the color of the indicator line, while using the indicator line as a dynamic stop-loss level. The strategy also incorporates trailing stop-loss and fixed take-profit logic to optimize performance.
Strategy Principle
- Calculate the upper (up) and lower (dn) bands of the Supertrend indicator and determine the current trend direction (trend) based on the relationship between the closing price and the upper and lower bands.
- Generate a buy signal (buySignal) when the trend changes from downward (-1) to upward (1), and generate a sell signal (sellSignal) when the trend changes from upward (1) to downward (-1).
- When a buy signal is generated, open a long position and set the lower band (dn) as the stop-loss level; when a sell signal is generated, open a short position and set the upper band (up) as the stop-loss level.
- Introduce trailing stop-loss logic, where the stop-loss level is moved up/down when the price rises/falls by a certain number of points (trailingValue), providing stop-loss protection.
- Introduce fixed take-profit logic, closing the position for profit when the trend changes.
Strategy Advantages
- Adaptability: The Supertrend indicator combines price and volatility, enabling it to adapt to different market conditions and trading instruments.
- Dynamic stop-loss: Using the indicator line as a dynamic stop-loss level can effectively control risk and reduce losses.
- Trailing stop-loss: Introducing trailing stop-loss logic can protect profits when the trend continues, enhancing the strategy's profitability.
- Clear signals: The buy and sell signals generated by the strategy are clear and easy to operate and execute.
- Flexible parameters: The strategy's parameters (such as ATR period, ATR multiplier, etc.) can be adjusted based on market characteristics and trading style, improving adaptability.
Strategy Risks
- Parameter risk: Different parameter settings may lead to significant differences in strategy performance, requiring thorough backtesting and parameter optimization.
- Choppy market risk: In choppy markets, frequent trend changes may cause the strategy to generate excessive trading signals, increasing transaction costs and slippage risk.
- Sudden trend change risk: When market trends suddenly change, the strategy may not be able to adjust positions in a timely manner, leading to increased losses.
- Over-optimization risk: Over-optimizing the strategy may lead to curve fitting, resulting in poor performance in future markets.
Strategy Optimization Directions
- Incorporate multi-timeframe analysis to confirm the stability of trends and reduce frequent trading in choppy markets.
- Combine other technical indicators or fundamental factors to improve the accuracy of trend determination.
- Optimize stop-loss and take-profit logic, such as introducing dynamic take-profit or risk-reward ratio, to improve the strategy's profit-loss ratio.
- Perform robustness testing on parameters to select parameter combinations that maintain good performance under different market conditions.
- Introduce position sizing and money management rules to control individual trade risk and overall risk.
Summary
The Dynamic Trend Following Strategy utilizes the Supertrend indicator to capture market trends, controlling risk through dynamic stop-loss and trailing stop-loss, while locking in profits with fixed take-profit. The strategy is adaptable, has clear signals, and is easy to operate. However, in practical application, attention should be paid to parameter optimization, choppy market risk, and sudden trend change risk. By introducing multi-timeframe analysis, optimizing stop-loss and take-profit logic, conducting parameter robustness testing, and implementing other measures, the strategy's performance and stability can be further enhanced. [/trans]
Source (PineScript)
/*backtest
start: 2024-05-01 00:00:00
end: 2024-05-31 23:59:59
period: 1h
basePeriod: 15m
exchanges: [{"eid":"Futures_Binance","currency":"BTC_USDT"}]
*/

//@version=5
strategy('Supertrend Strategy', overlay=true, format=format.price, precision=2)
Periods = input.int(title='ATR Period', defval=10)
src = input.source(hl2, title='Source')
Multiplier = input.float(title='ATR Multiplier', step=0.1, defval=3.0)
changeATR = input.bool(title='Change ATR Calculation Method ?', defval=true)
showsignals = input.bool(title='Show Buy/Sell Signals ?', defval=true)
highlighting = input.bool(title='Highlighter On/Off ?', defval=true)

// ATR calculation
atr2 = ta.sma(ta.tr, Periods)
atr = changeATR ? ta.atr(Periods) : atr2

// Supertrend calculations
up = src - Multiplier * atr
up1 = nz(up[1], up)
up := close[1] > up1 ? math.max(up, up1) : up
dn = src + Multiplier * atr
dn1 = nz(dn[1], dn)
dn := close[1] < dn1 ? math.min(dn, dn1) : dn

// Trend direction
trend = 1
trend := nz(trend[1], trend)
trend := trend == -1 and close > dn1 ? 1 : trend == 1 and close < up1 ? -1 : trend

// Plotting
upPlot = plot(trend == 1 ? up : na, title='Up Trend', style=plot.style_linebr, linewidth=2, color=color.new(color.green, 0))
buySignal = trend == 1 and trend[1] == -1
plotshape(buySignal ? up : na, title='UpTrend Begins', location=location.absolute, style=shape.circle, size=size.tiny, color=color.new(color.green, 0))
plotshape(buySignal and showsignals ? up : na, title='Buy', text='Buy', location=location.absolute, style=shape.labelup, size=size.tiny, color=color.new(color.green, 0), textcolor=color.new(color.white, 0))

dnPlot = plot(trend == 1 ? na : dn, title='Down Trend', style=plot.style_linebr, linewidth=2, color=color.new(color.red, 0))
sellSignal = trend == -1 and trend[1] == 1
plotshape(sellSignal ? dn : na, title='DownTrend Begins', location=location.absolute, style=shape.circle, size=size.tiny, color=color.new(color.red, 0))
plotshape(sellSignal and showsignals ? dn : na, title='Sell', text='Sell', location=location.absolute, style=shape.labeldown, size=size.tiny, color=color.new(color.red, 0), textcolor=color.new(color.white, 0))

// Highlighting
mPlot = plot(ohlc4, title='', style=plot.style_circles, linewidth=0)
longFillColor = highlighting ? trend == 1 ? color.green : color.white : color.white
shortFillColor = highlighting ? trend == -1 ? color.red : color.white : color.white
fill(mPlot, upPlot, title='UpTrend Highligter', color=longFillColor, transp=90)
fill(mPlot, dnPlot, title='DownTrend Highligter', color=shortFillColor, transp=90)

// Alerts
alertcondition(buySignal, title='SuperTrend Buy', message='SuperTrend Buy!')
alertcondition(sellSignal, title='SuperTrend Sell', message='SuperTrend Sell!')
changeCond = trend != trend[1]
alertcondition(changeCond, title='SuperTrend Direction Change', message='SuperTrend has changed direction!')

// Pip and trailing stop calculation
pips = 50
pipValue = syminfo.mintick * pips
trailingPips = 10
trailingValue = syminfo.mintick * trailingPips

// Strategy
if (buySignal)
    strategy.entry("Long", strategy.long, stop=dn, comment="SuperTrend Buy")
if (sellSignal)
    strategy.entry("Short", strategy.short, stop=up, comment="SuperTrend Sell")

// Take profit on trend change
if (changeCond and trend == -1)
    strategy.close("Long", comment="SuperTrend Direction Change")
if (changeCond and trend == 1)
    strategy.close("Short", comment="SuperTrend Direction Change")

// Initial Stop Loss
longStopLevel = up - pipValue
shortStopLevel = dn + pipValue

// Trailing Stop Loss
var float longTrailStop = na
var float shortTrailStop = na

if (strategy.opentrades > 0)
    if (strategy.position_size > 0)  // Long position
        if (longTrailStop == na or close > strategy.position_avg_price + trailingValue)
            longTrailStop := high - trailingValue
        strategy.exit("Stop Loss Long", from_entry="Long", stop=longTrailStop)
    if (strategy.position_size < 0)  // Short position
        if (shortTrailStop == na or close < strategy.position_avg_price - trailingValue)
            shortTrailStop := low + trailingValue
        strategy.exit("Stop Loss Short", from_entry="Short", stop=shortTrailStop)

// Initial Exit
strategy.exit("Initial Stop Loss Long", from_entry="Long", stop=longStopLevel)
strategy.exit("Initial Stop Loss Short", from_entry="Short", stop=shortStopLevel)
Detail
https://www.fmz.com/strategy/453280
Last Modified
2024-06-03 16:57:51