
8.1 KiB
Name
动态趋势判定RSI指标交叉策略-Dynamic-Trend-RSI-Indicator-Crossing-Strategy
Author
ChaoZhang
Strategy Description
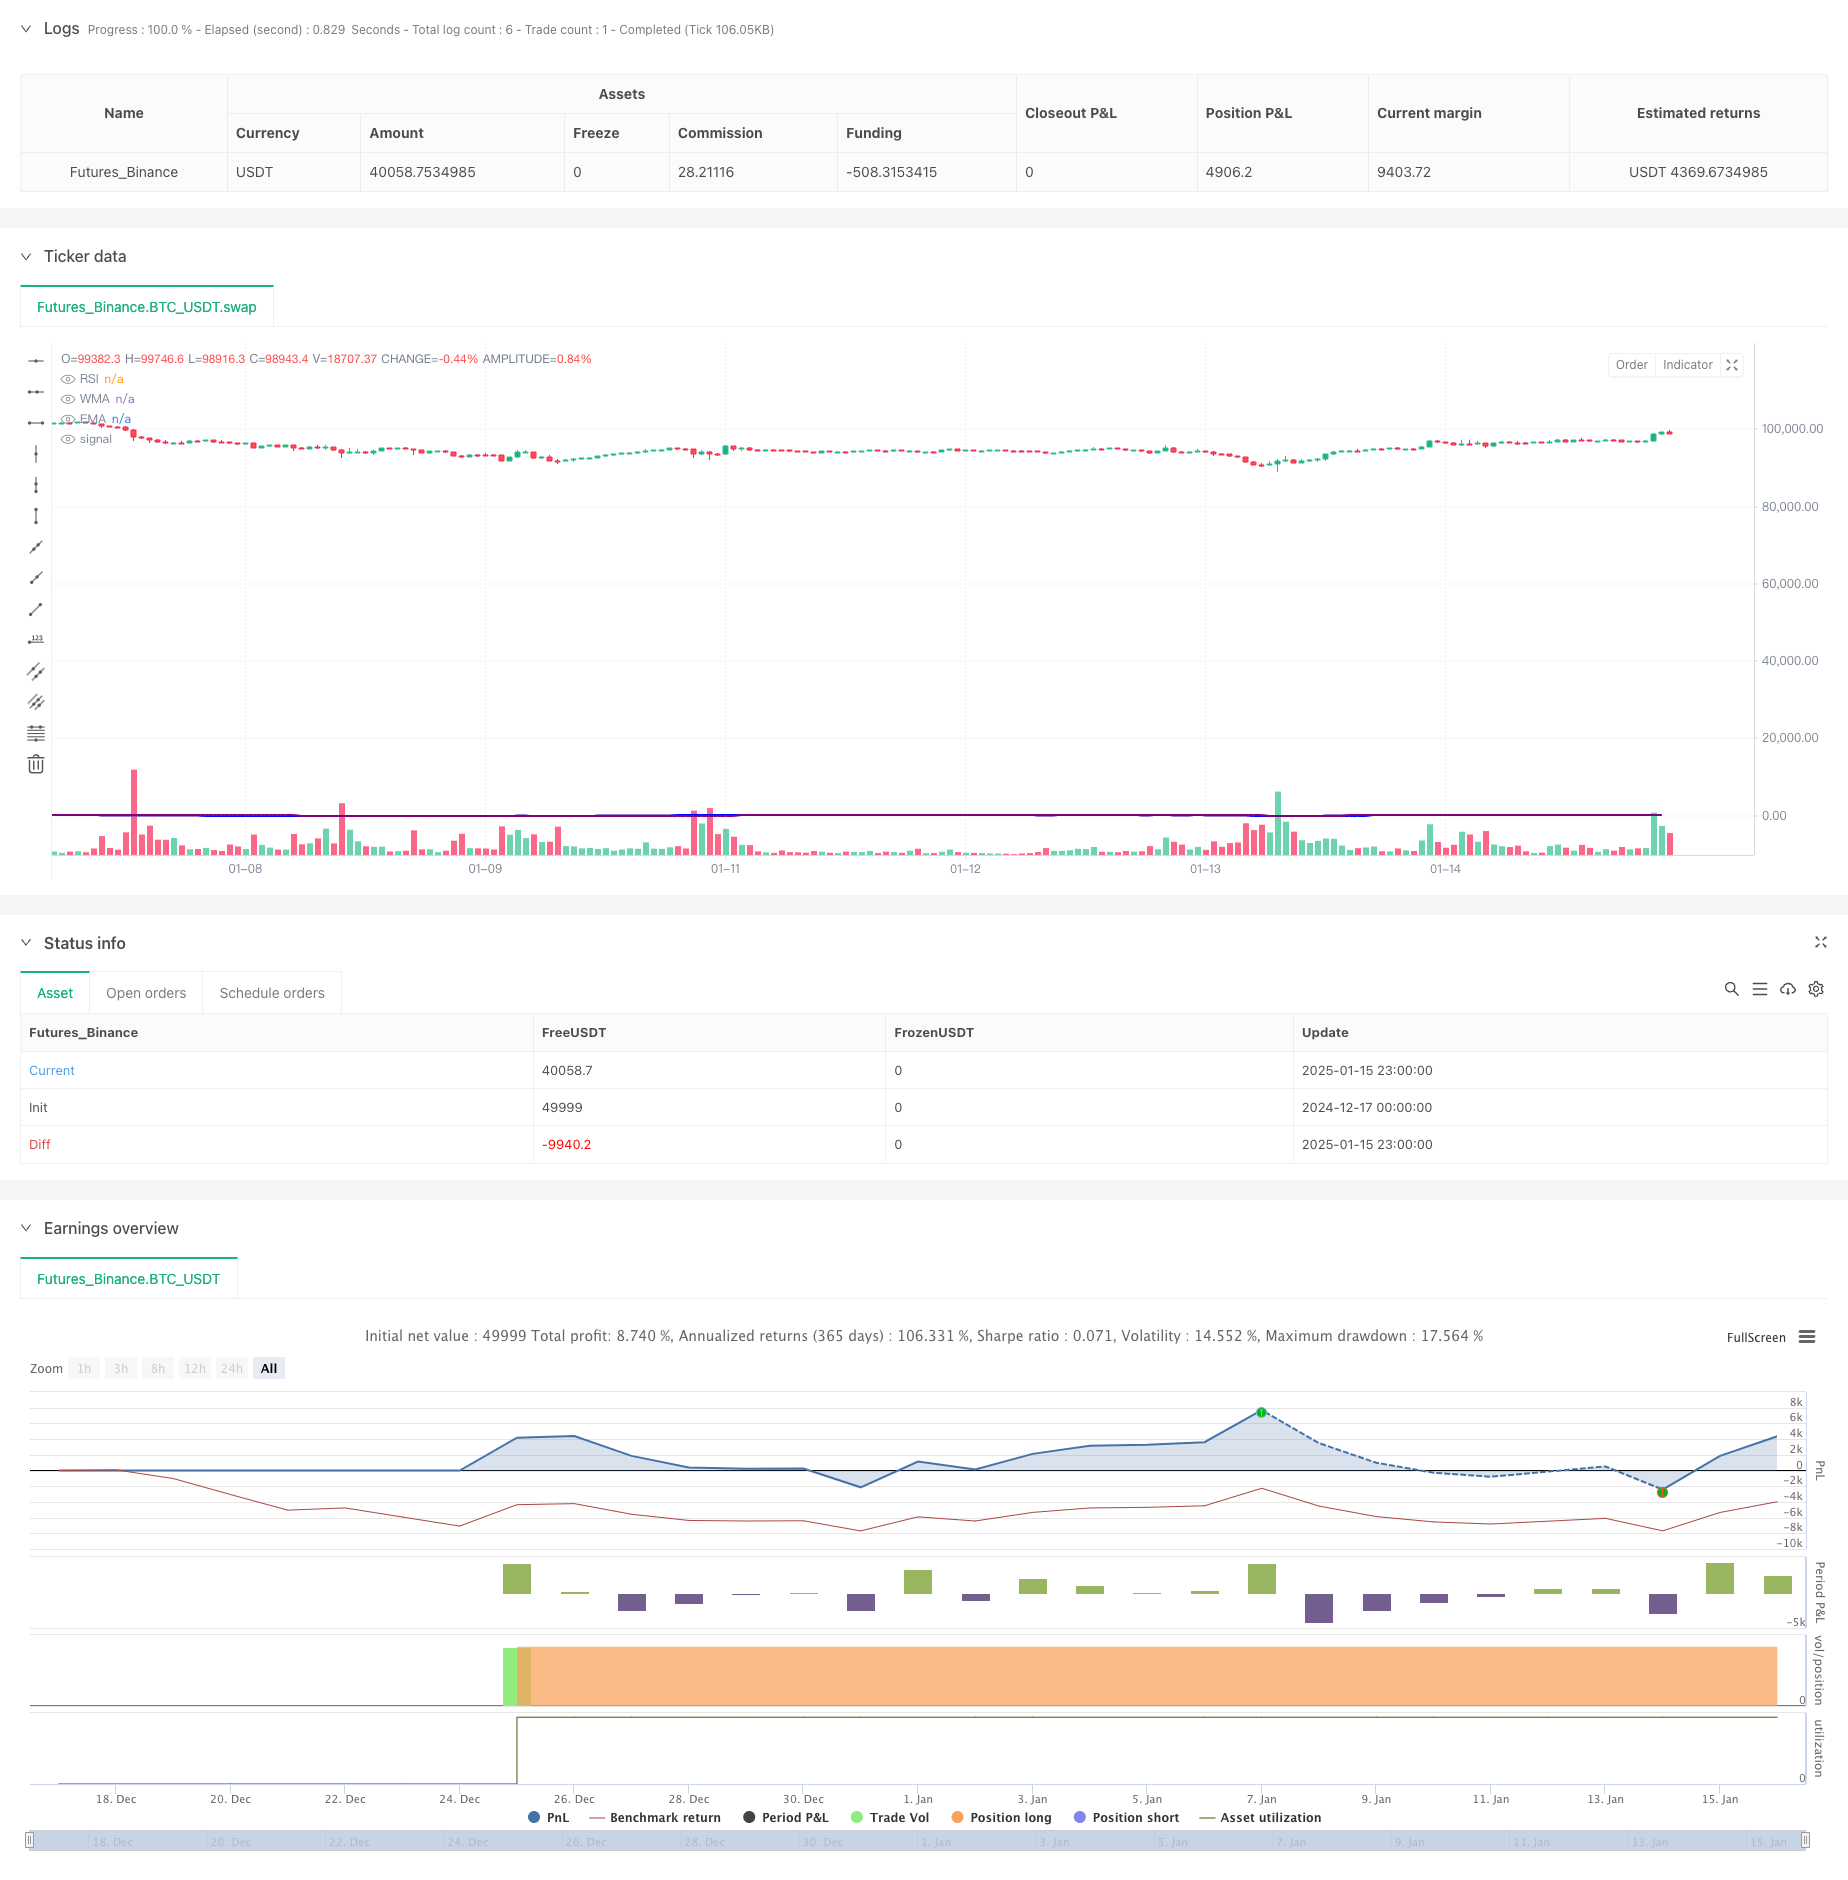
[trans]
概述
该策略是一个结合了相对强弱指标(RSI)、加权移动平均线(WMA)和指数移动平均线(EMA)的趋势跟踪交易系统。策略通过监测RSI值的位置以及WMA与EMA的交叉来识别市场趋势变化,从而产生买卖信号。这种组合方法既考虑了市场的超买超卖状态,又结合了不同周期移动平均线的趋势判断,能够更准确地捕捉市场转折点。
策略原理
策略的核心逻辑基于以下几个关键要素:
- 使用14周期的RSI指标计算市场的超买超卖状态
- 计算45周期的WMA和89周期的EMA
- 入场条件:
- 做多信号: 当RSI低于50且WMA向上穿越EMA时
- 做空信号: 当RSI高于50且WMA向下穿越EMA时
- 策略采用了ta.rma函数来平滑RSI计算,提高了信号的稳定性
- 通过plotshape功能在图表上标注买卖点,方便交易者直观判断
策略优势
- 信号可靠性高:结合了动量指标(RSI)和趋势指标(移动平均线),能够有效过滤假信号
- 风险控制优秀:通过RSI的50分界线作为趋势确认,降低了逆势交易的风险
- 适应性强:策略参数可调整性强,能够适应不同市场环境
- 可视化清晰:交易信号在图表上清晰可见,便于分析和回测
- 计算效率高:使用了Pine Script的原生函数,运算速度快
策略风险
- 震荡市场风险:在横盘震荡市场中可能产生频繁的假信号
- 滞后性风险:移动平均线本身具有一定滞后性,可能导致入场时机略有延迟
- 参数敏感性:不同时间周期的参数设置会显著影响策略表现
- 市场环境依赖:策略在趋势明显的市场中表现更好,而在震荡市场中效果可能不佳
- 回撤风险:在剧烈波动时期可能面临较大回撤
策略优化方向
- 引入波动率过滤:可添加ATR指标来过滤低波动率环境下的交易信号
- 优化止损设置:建议根据ATR动态设置止损位置,提高风险管理能力
- 增加趋势强度确认:可引入ADX等趋势强度指标,提高交易信号的可靠性
- 完善仓位管理:建议基于波动率和风险度量来动态调整持仓规模
- 增加市场环境判断:可添加市场环境分类逻辑,在不同市场条件下使用不同的参数设置
总结
该策略通过结合RSI、WMA和EMA三个技术指标,构建了一个相对完善的趋势跟踪系统。策略的核心优势在于其信号的可靠性和风险控制能力,但同时也需要注意震荡市场中的假信号风险。通过添加波动率过滤和趋势强度确认等优化措施,可以进一步提升策略的稳定性和盈利能力。整体而言,这是一个具有实战价值的交易策略,特别适合中长期趋势交易者使用。 ||
Overview
This strategy is a trend-following trading system that combines the Relative Strength Index (RSI), Weighted Moving Average (WMA), and Exponential Moving Average (EMA). The strategy identifies market trend changes by monitoring RSI levels and the crossover between WMA and EMA to generate buy and sell signals. This combination method considers both market overbought/oversold conditions and trend judgments from different period moving averages, enabling more accurate capture of market turning points.
Strategy Principles
The core logic of the strategy is based on the following key elements:
- Uses 14-period RSI to calculate market overbought/oversold conditions
- Calculates 45-period WMA and 89-period EMA
- Entry conditions:
- Long signal: When RSI is below 50 and WMA crosses above EMA
- Short signal: When RSI is above 50 and WMA crosses below EMA
- Strategy uses ta.rma function to smooth RSI calculation, improving signal stability
- Uses plotshape functionality to mark buy/sell points on the chart for intuitive judgment
Strategy Advantages
- High signal reliability: Combines momentum indicator (RSI) and trend indicators (moving averages) to effectively filter false signals
- Excellent risk control: Uses RSI 50 level as trend confirmation to reduce counter-trend trading risk
- Strong adaptability: Strategy parameters are highly adjustable to adapt to different market conditions
- Clear visualization: Trading signals are clearly visible on the chart for analysis and backtesting
- High computational efficiency: Uses Pine Script native functions for fast calculation
Strategy Risks
- Choppy market risk: May generate frequent false signals in sideways markets
- Lag risk: Moving averages inherently have some lag, which may lead to slightly delayed entry timing
- Parameter sensitivity: Different timeframe parameter settings significantly affect strategy performance
- Market environment dependence: Strategy performs better in trending markets but may underperform in ranging markets
- Drawdown risk: May face significant drawdowns during periods of intense volatility
Strategy Optimization Directions
- Incorporate volatility filtering: Add ATR indicator to filter trading signals in low volatility environments
- Optimize stop-loss settings: Suggest setting dynamic stop-loss levels based on ATR to improve risk management
- Add trend strength confirmation: Consider incorporating ADX or other trend strength indicators to improve signal reliability
- Enhance position management: Suggest dynamic position sizing based on volatility and risk metrics
- Add market environment classification: Consider adding market condition logic to use different parameter settings in different market conditions
Summary
The strategy constructs a relatively complete trend-following system by combining RSI, WMA, and EMA indicators. Its core advantages lie in signal reliability and risk control capabilities, while attention must be paid to false signal risks in ranging markets. Through optimization measures such as adding volatility filtering and trend strength confirmation, the strategy's stability and profitability can be further improved. Overall, this is a trading strategy with practical value, particularly suitable for medium to long-term trend traders.[/trans]
Source (PineScript)
/*backtest
start: 2024-12-17 00:00:00
end: 2025-01-16 00:00:00
period: 1h
basePeriod: 1h
exchanges: [{"eid":"Futures_Binance","currency":"BTC_USDT","balance":49999}]
*/

//@version=5
strategy(title="RSI + WMA + EMA Strategy", shorttitle="RSI Strategy", overlay=true)

// RSI Settings
rsiLengthInput = input.int(14, minval=1, title="RSI Length", group="RSI Settings")
rsiSourceInput = input.source(close, "Source", group="RSI Settings")

// WMA and EMA Settings
wmaLengthInput = input.int(45, minval=1, title="WMA Length", group="WMA Settings")
wmaColorInput = input.color(color.blue, title="WMA Color", group="WMA Settings")
emaLengthInput = input.int(89, minval=1, title="EMA Length", group="EMA Settings")
emaColorInput = input.color(color.purple, title="EMA Color", group="EMA Settings")

// RSI Calculation
change = ta.change(rsiSourceInput)
up = ta.rma(math.max(change, 0), rsiLengthInput)
down = ta.rma(-math.min(change, 0), rsiLengthInput)
rsi = down == 0 ? 100 : up == 0 ? 0 : 100 - (100 / (1 + up / down))

// WMA and EMA Calculation
wma = ta.wma(rsi, wmaLengthInput)
ema = ta.ema(rsi, emaLengthInput)

// Plot RSI, WMA, and EMA
plot(rsi, "RSI", color=#7E57C2)
plot(wma, title="WMA", color=wmaColorInput, linewidth=2)
plot(ema, title="EMA", color=emaColorInput, linewidth=2)

// Entry and Exit Conditions
longCondition = ta.crossover(wma, ema) and rsi < 50
shortCondition = ta.crossunder(wma, ema) and rsi > 50

if (longCondition)
    strategy.entry("Long", strategy.long)

if (shortCondition)
    strategy.entry("Short", strategy.short)

// Optional: Plot Buy/Sell Signals on Chart
plotshape(series=longCondition, style=shape.labelup, location=location.belowbar, color=color.green, size=size.small, title="Buy Signal")
plotshape(series=shortCondition, style=shape.labeldown, location=location.abovebar, color=color.red, size=size.small, title="Sell Signal")
Detail
https://www.fmz.com/strategy/478733
Last Modified
2025-01-17 16:12:08