
18 KiB
Name
动态网格趋势追踪量化交易策略Dynamic-Grid-Trend-Following-Quantitative-Trading-Strategy
Author
ChaoZhang
Strategy Description
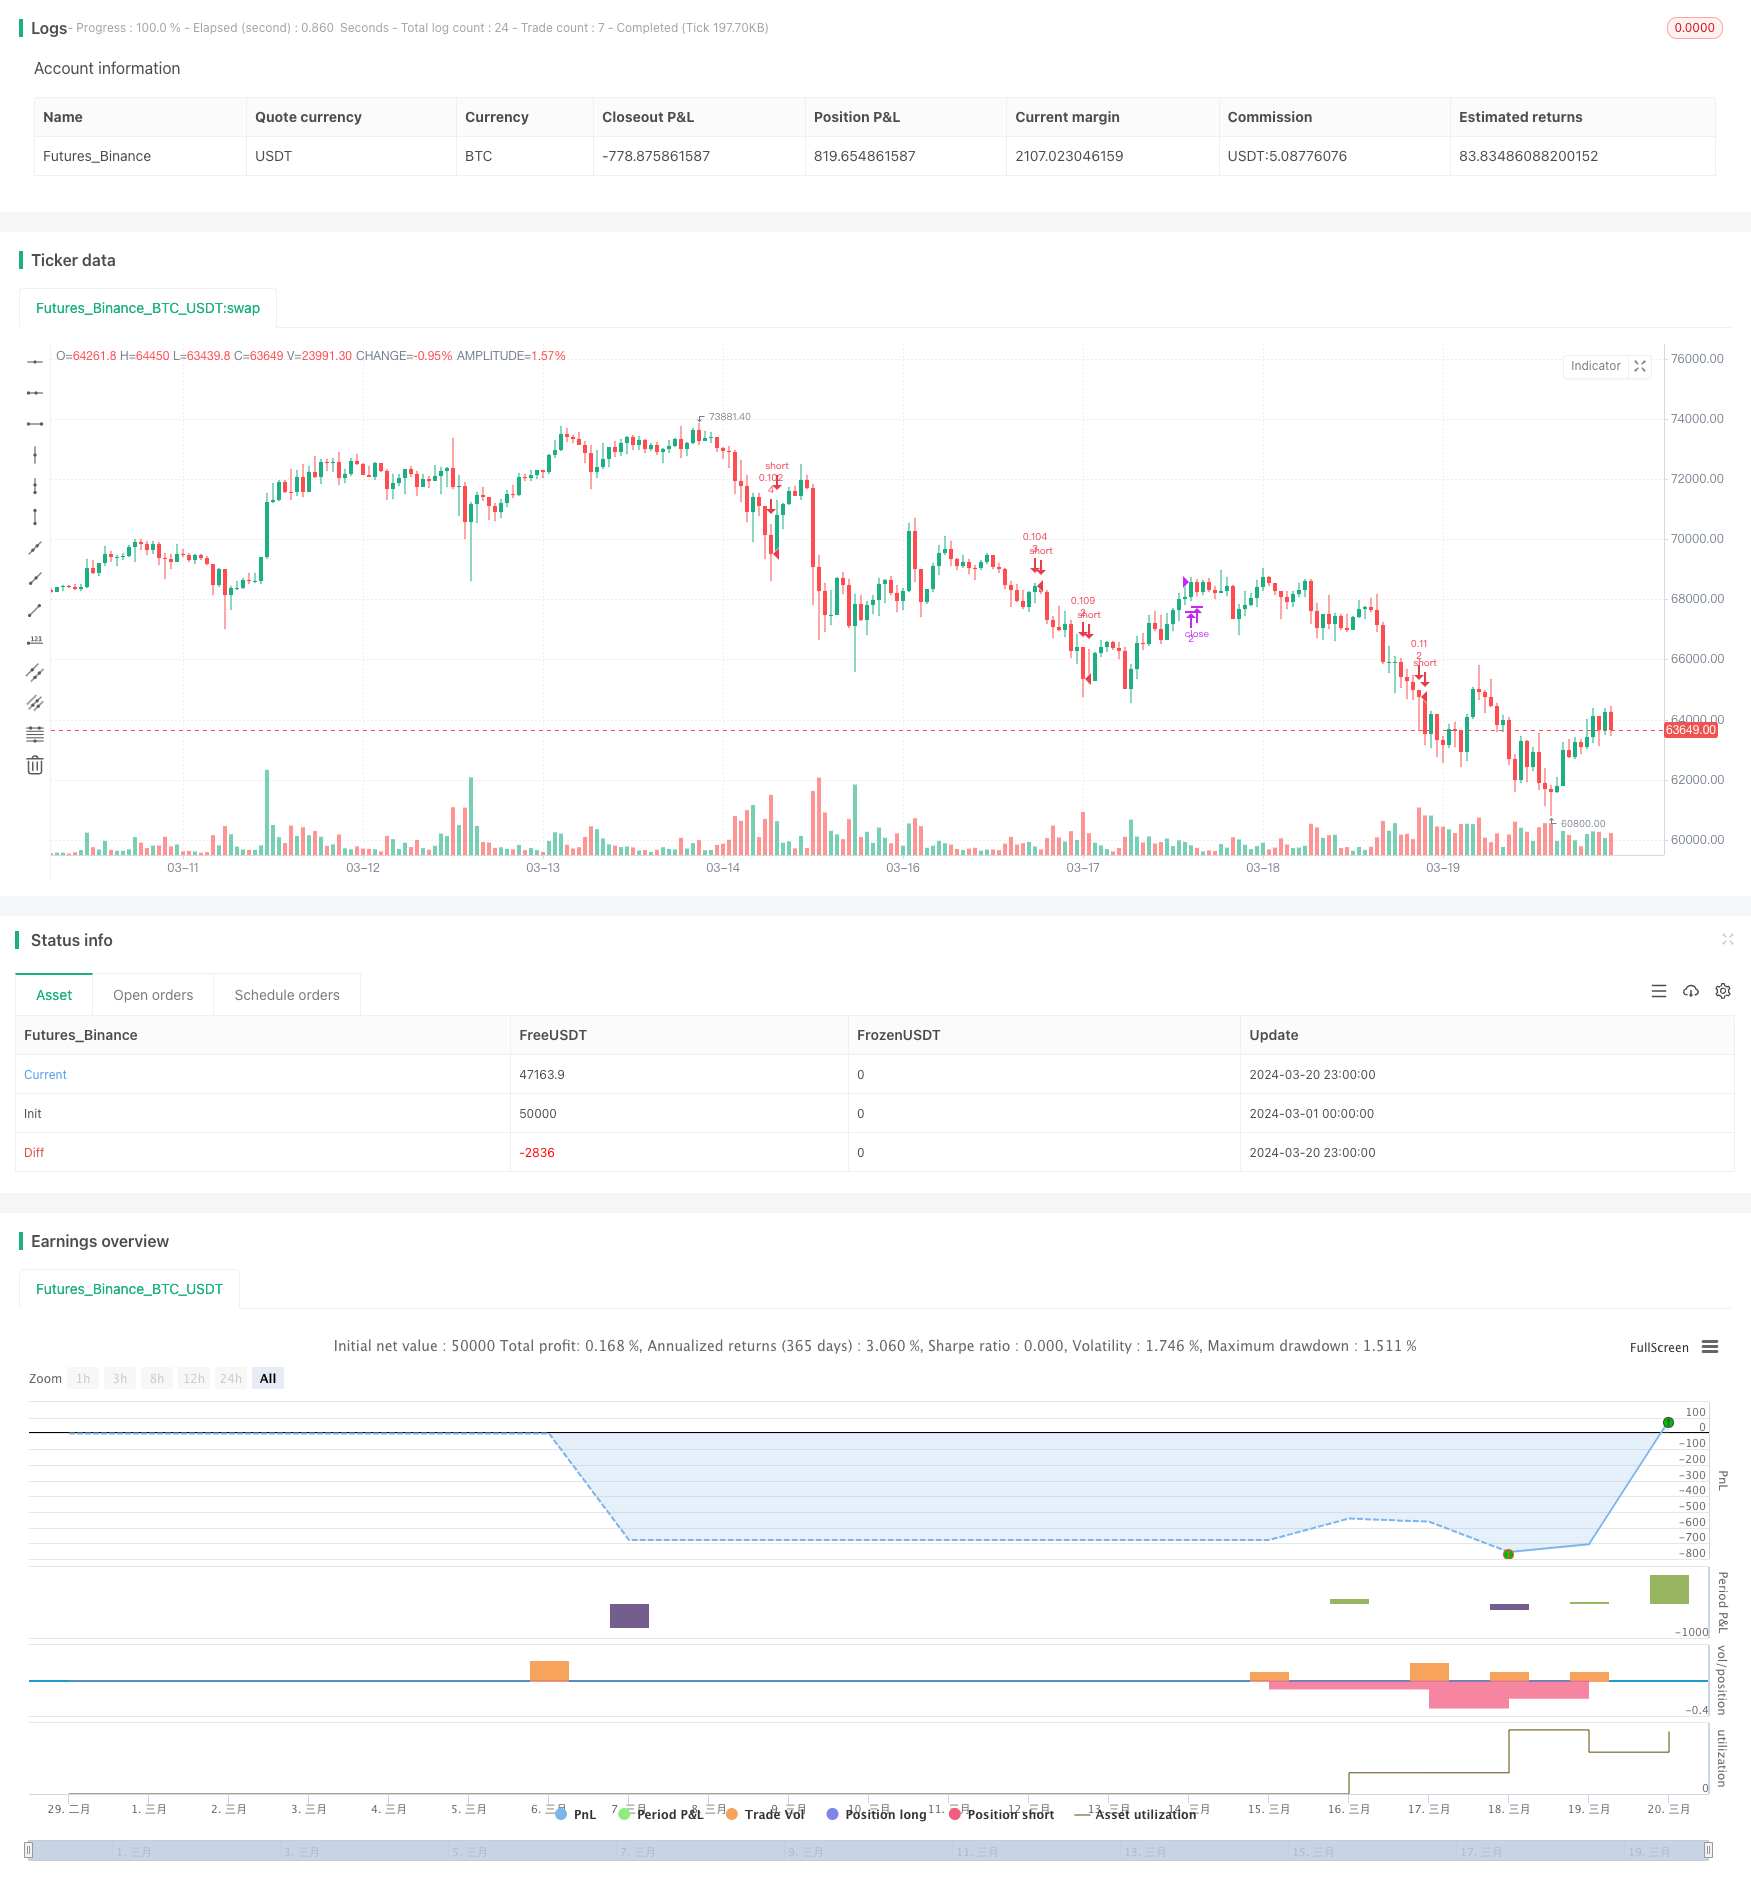 [trans]
概述
这是一个高级的动态网格趋势追踪量化交易策略。该策略的主要思想是在预先设定的价格区间内划分多条网格线,并在价格触及网格线时自动建仓买入或平仓卖出,从而在震荡行情中获利。同时,该策略还具有动态调整网格线位置的功能,可以根据最近的价格走势自适应地优化网格布局。
策略原理
该策略的核心原理如下:
-
首先根据用户设置,确定网格的上下边界和网格线的数量。边界可以是固定值,也可以基于近期高低点或移动平均线自动计算得出。
-
在确定的边界内,将价格区间等分为若干网格。每条网格线对应一个买入或卖出的价位。
-
在每个价格触及网格线时,策略会检查是否已经持有该网格线对应的仓位。如果没有则建仓买入,如果有则平仓卖出。
-
通过在相对高位卖出,低位买入的方式,策略可以在价格震荡时不断获利。
-
同时,如果用户启用了自动边界调整功能,则网格线的位置会根据近期价格的高低点或所设置的移动平均线进行自适应调整,以优化网格布局。
通过以上原理,该策略能够实现在价格震荡行情下的自动低买高卖,并根据趋势调整获利点位,从而提高整体收益。
优势分析
该动态网格策略具有以下优势:
-
适应性强。可以通过参数设置适应不同的市场和品种,对震荡行情有很好的适应性。
-
自动化程度高。由于策略基于严格的数学逻辑,建仓平仓点位明确,因此可以实现完全自动化交易,减少主观情绪的干扰。
-
风险可控。通过设置网格数量、网格边界等参数,可以有效控制每次交易的风险敞口,从而将总体风险维持在可接受范围内。
-
趋势适应性。策略中加入了动态调整网格边界的功能,使得网格能够跟随价格趋势而优化,提高了趋势行情下的盈利能力。
-
胜率稳定。由于网格交易本质上是在价格震荡中频繁高抛低吸,只要价格维持震荡,该策略就能持续获利,因此长期来看具有较高的胜率。
风险分析
尽管该策略优势明显,但同时也存在一定风险:
-
趋势风险。如果价格发生强烈单边趋势突破网格边界,该策略的盈利空间将受到限制,并可能面临较大回撤。
-
参数优化难度大。该策略参数较多,包括网格数量、初始边界、动态边界参数等,不同参数组合对策略绩效影响很大,实际优化难度不小。
-
频繁交易。网格策略本质上是一种高频策略,建仓平仓非常频繁,这意味着较高的交易成本和潜在的滑点风险。
-
对行情依赖性强。该策略对震荡行情的依赖性很强,一旦价格进入快速单边趋势,该策略很可能面临较大回撤。
针对这些风险,可以从以下方面着手改进:加入趋势判断指标作为策略启动的过滤条件,优化参数搜索空间和方法,引入资金管理和仓位控制逻辑,增加趋势突破平仓逻辑等。通过这些优化,可以进一步提升该策略的稳健性和盈利能力。
优化方向
基于以上分析,该策略的优化方向主要有:
-
引入趋势过滤条件。在策略启动前加入趋势判断指标,如移动平均线、ADX等,只有在震荡行情下才启动策略,而在趋势行情下则保持观望,这样可以有效避免趋势行情下的回撤风险。
-
优化参数搜索。采用智能算法优化网格参数,如遗传算法、粒子群算法等,从而自动寻找最优参数组合,提高优化效率和质量。
-
增强风控逻辑。在策略中加入更多风控逻辑,如根据价格波动率动态调整网格宽度,设置最大回撤阈值触发平仓等,从而更好地控制风险。
-
引入趋势止损。设置趋势突破止损线,如网格边界的一定比例,一旦价格突破止损线则全平仓位,避免趋势行情下的巨大回撤。
-
优化交易执行。对交易执行环节进行优化,如采用更高级的条件单和订单算法,尽量降低交易频率和成本,提高执行效率。
通过以上优化,可以全面提升该策略的适应性、稳健性和盈利能力,使其更加贴近实盘需求。
总结
总的来说,该动态网格趋势追踪策略是一个基于网格交易原理、同时融入了动态调整和趋势适应机制的中高频量化交易策略。它的优势在于适应性强、自动化程度高、风险可控、趋势适应性好、胜率稳定等,但同时也存在趋势风险、参数优化难度大、频繁交易、对行情依赖性强等风险。针对这些问题,可以从趋势过滤、参数优化、风控增强、趋势止损、交易优化等方面着手改进,提升策略的整体性能。
网格交易思路本身是一种相对成熟和实用的量化方法,通过该策略的动态优化和趋势适应机制的加入,使得经典网格交易的优势得到了延伸和发展。为投资者在震荡行情下提供了一种新的量化交易思路和可能性。经过进一步的优化和改进,该策略有望成为一个优秀的中高频量化交易工具。
||
Overview
This is an advanced dynamic grid trend-following quantitative trading strategy. The main idea of this strategy is to divide multiple grid lines within a pre-set price range and automatically open positions when the price hits the grid lines and close positions when selling, thus profiting from fluctuating markets. At the same time, this strategy also has the function of dynamically adjusting the position of grid lines, which can adaptively optimize the grid layout according to recent price trends.
Strategy Principle
The core principles of this strategy are as follows:
-
First, determine the upper and lower boundaries of the grid and the number of grid lines based on user settings. The boundaries can be fixed values or automatically calculated based on recent highs and lows or moving averages.
-
Within the determined boundaries, divide the price range into several grids. Each grid line corresponds to a buy or sell price.
-
When the price hits each grid line, the strategy will check whether the position corresponding to the grid line is already held. If not, it will open a position and buy, if so, it will close the position and sell.
-
By selling at relatively high positions and buying at low positions, the strategy can continuously profit when prices fluctuate.
-
At the same time, if the user enables the automatic boundary adjustment function, the position of the grid lines will be adaptively adjusted according to the recent price highs and lows or the set moving average to optimize the grid layout.
Through the above principles, this strategy can realize automatic low buying and high selling in fluctuating price trends, and adjust profit points according to trends, thereby improving overall returns.
Advantage Analysis
This dynamic grid strategy has the following advantages:
-
Strong adaptability. It can adapt to different markets and varieties through parameter settings, and has good adaptability to fluctuating markets.
-
High degree of automation. Since the strategy is based on strict mathematical logic and clear position opening and closing points, it can achieve fully automated trading and reduce subjective emotional interference.
-
Controllable risk. By setting parameters such as the number of grids and grid boundaries, the risk exposure of each transaction can be effectively controlled, thereby maintaining the overall risk within an acceptable range.
-
Trend adaptability. The function of dynamically adjusting grid boundaries is added to the strategy, so that the grid can follow price trends and be optimized, improving the profitability in trend markets.
-
Stable win rate. Since grid trading is essentially frequent high-throwing and low-sucking in price fluctuations, as long as the price maintains fluctuations, this strategy can continue to profit, so it has a high win rate in the long run.
Risk Analysis
Although this strategy has obvious advantages, it also has certain risks:
-
Trend risk. If the price breaks through the grid boundary with a strong unilateral trend, the profit space of this strategy will be limited and it may face a large retracement.
-
Difficulty in parameter optimization. This strategy has many parameters, including the number of grids, initial boundaries, dynamic boundary parameters, etc. Different parameter combinations have a great impact on strategy performance, and the actual optimization difficulty is not small.
-
Frequent trading. Grid strategy is essentially a high-frequency strategy, with very frequent opening and closing of positions, which means higher transaction costs and potential slippage risks.
-
Strong dependence on market conditions. This strategy is highly dependent on fluctuating markets. Once the price enters a rapid unilateral trend, this strategy is likely to face a large retracement.
In view of these risks, improvements can be made from the following aspects: adding trend judgment indicators as filter conditions for strategy startup, optimizing parameter search space and methods, introducing fund management and position control logic, increasing trend breakthrough closing logic, etc. Through these optimizations, the robustness and profitability of this strategy can be further improved.
Optimization Direction
Based on the above analysis, the optimization directions of this strategy mainly include:
-
Introduce trend filtering conditions. Add trend judgment indicators before the strategy starts, such as moving averages, ADX, etc. Only start the strategy in fluctuating market conditions, and keep watching in trend markets to effectively avoid the risk of retracement in trend markets.
-
Optimize parameter search. Use intelligent algorithms to optimize grid parameters, such as genetic algorithms, particle swarm algorithms, etc., to automatically find the optimal parameter combination and improve optimization efficiency and quality.
-
Enhance risk control logic. Add more risk control logic to the strategy, such as dynamically adjusting the grid width according to price volatility, setting the maximum retracement threshold to trigger closing, etc., to better control risks.
-
Introduce trend stop loss. Set a trend breakthrough stop loss line, such as a certain percentage of the grid boundary. Once the price breaks through the stop loss line, close all positions to avoid huge retracements in trend markets.
-
Optimize transaction execution. Optimize the transaction execution link, such as adopting more advanced order types and order algorithms, minimizing transaction frequency and costs, and improving execution efficiency.
Through the above optimization, the adaptability, robustness and profitability of this strategy can be comprehensively improved, making it closer to the actual trading needs.
Summary
In general, this dynamic grid trend-following strategy is a mid-to-high frequency quantitative trading strategy based on the principle of grid trading, and integrates dynamic adjustment and trend adaptation mechanisms. Its advantages lie in strong adaptability, high degree of automation, controllable risk, good trend adaptability, and stable win rate. At the same time, it also has risks such as trend risk, difficulty in parameter optimization, frequent trading, and strong dependence on market conditions. In view of these problems, improvements can be made from trend filtering, parameter optimization, risk control enhancement, trend stop loss, transaction optimization and other aspects to improve the overall performance of the strategy.
The idea of grid trading itself is a relatively mature and practical quantitative method. Through the addition of dynamic optimization and trend adaptation mechanisms to this strategy, the advantages of classic grid trading have been extended and developed. It provides investors with a new quantitative trading idea and possibility in fluctuating markets. With further optimization and improvement, this strategy is expected to become an excellent mid-to-high frequency quantitative trading tool. [/trans]
Strategy Arguments
| Argument | Default | Description |
|---|---|---|
| v_input_1 | true | (?Grid Bounds)Use Auto Bounds? |
| v_input_2 | 0 | (Auto) Bound Source: Hi & Low |
| v_input_3 | 250 | (Auto) Bound Lookback |
| v_input_4 | 0.1 | (Auto) Bound Deviation |
| v_input_5 | 0.285 | (Manual) Upper Boundry |
| v_input_6 | 0.225 | (Manual) Lower Boundry |
| v_input_7 | 8 | (?Grid Lines)Grid Line Quantity |
Source (PineScript)
/*backtest
start: 2024-03-01 00:00:00
end: 2024-03-21 00:00:00
period: 1h
basePeriod: 15m
exchanges: [{"eid":"Futures_Binance","currency":"BTC_USDT"}]
*/

//@version=4
strategy("(IK) Grid Script", overlay=true, pyramiding=14, close_entries_rule="ANY", default_qty_type=strategy.cash, initial_capital=100.0, currency="USD", commission_type=strategy.commission.percent, commission_value=0.1)
i_autoBounds    = input(group="Grid Bounds", title="Use Auto Bounds?", defval=true, type=input.bool)                             // calculate upper and lower bound of the grid automatically? This will theorhetically be less profitable, but will certainly require less attention
i_boundSrc      = input(group="Grid Bounds", title="(Auto) Bound Source", defval="Hi & Low", options=["Hi & Low", "Average"])     // should bounds of the auto grid be calculated from recent High & Low, or from a Simple Moving Average
i_boundLookback = input(group="Grid Bounds", title="(Auto) Bound Lookback", defval=250, type=input.integer, maxval=500, minval=0) // when calculating auto grid bounds, how far back should we look for a High & Low, or what should the length be of our sma
i_boundDev      = input(group="Grid Bounds", title="(Auto) Bound Deviation", defval=0.10, type=input.float, maxval=1, minval=-1)  // if sourcing auto bounds from High & Low, this percentage will (positive) widen or (negative) narrow the bound limits. If sourcing from Average, this is the deviation (up and down) from the sma, and CANNOT be negative.
i_upperBound    = input(group="Grid Bounds", title="(Manual) Upper Boundry", defval=0.285, type=input.float)                      // for manual grid bounds only. The upperbound price of your grid
i_lowerBound    = input(group="Grid Bounds", title="(Manual) Lower Boundry", defval=0.225, type=input.float)                      // for manual grid bounds only. The lowerbound price of your grid.
i_gridQty       = input(group="Grid Lines",  title="Grid Line Quantity", defval=8, maxval=15, minval=3, type=input.integer)       // how many grid lines are in your grid

f_getGridBounds(_bs, _bl, _bd, _up) =>
    if _bs == "Hi & Low"
        _up ? highest(close, _bl) * (1 + _bd) : lowest(close, _bl)  * (1 - _bd)
    else
        avg = sma(close, _bl)
        _up ? avg * (1 + _bd) : avg * (1 - _bd)

f_buildGrid(_lb, _gw, _gq) =>
    gridArr = array.new_float(0)
    for i=0 to _gq-1
        array.push(gridArr, _lb+(_gw*i))
    gridArr

f_getNearGridLines(_gridArr, _price) =>
    arr = array.new_int(3)
    for i = 0 to array.size(_gridArr)-1
        if array.get(_gridArr, i) > _price
            array.set(arr, 0, i == array.size(_gridArr)-1 ? i : i+1)
            array.set(arr, 1, i == 0 ? i : i-1)
            break
    arr

var upperBound      = i_autoBounds ? f_getGridBounds(i_boundSrc, i_boundLookback, i_boundDev, true) : i_upperBound  // upperbound of our grid
var lowerBound      = i_autoBounds ? f_getGridBounds(i_boundSrc, i_boundLookback, i_boundDev, false) : i_lowerBound // lowerbound of our grid
var gridWidth       = (upperBound - lowerBound)/(i_gridQty-1)                                                       // space between lines in our grid
var gridLineArr     = f_buildGrid(lowerBound, gridWidth, i_gridQty)                                                 // an array of prices that correspond to our grid lines
var orderArr        = array.new_bool(i_gridQty, false)                                                              // a boolean array that indicates if there is an open order corresponding to each grid line

var closeLineArr    = f_getNearGridLines(gridLineArr, close)                                                        // for plotting purposes - an array of 2 indices that correspond to grid lines near price
var nearTopGridLine = array.get(closeLineArr, 0)                                                                    // for plotting purposes - the index (in our grid line array) of the closest grid line above current price
var nearBotGridLine = array.get(closeLineArr, 1)                                                                    // for plotting purposes - the index (in our grid line array) of the closest grid line below current price
strategy.initial_capital = 50000
for i = 0 to (array.size(gridLineArr) - 1)
    if close < array.get(gridLineArr, i) and not array.get(orderArr, i) and i < (array.size(gridLineArr) - 1)
        buyId = i
        array.set(orderArr, buyId, true)
        strategy.entry(id=tostring(buyId), long=true, qty=(strategy.initial_capital/(i_gridQty-1))/close, comment="#"+tostring(buyId))
    if close > array.get(gridLineArr, i) and i != 0
        if array.get(orderArr, i-1)
            sellId = i-1
            array.set(orderArr, sellId, false)
            strategy.close(id=tostring(sellId), comment="#"+tostring(sellId))

if i_autoBounds
    upperBound  := f_getGridBounds(i_boundSrc, i_boundLookback, i_boundDev, true)
    lowerBound  := f_getGridBounds(i_boundSrc, i_boundLookback, i_boundDev, false)
    gridWidth   := (upperBound - lowerBound)/(i_gridQty-1)
    gridLineArr := f_buildGrid(lowerBound, gridWidth, i_gridQty)

closeLineArr    := f_getNearGridLines(gridLineArr, close)
nearTopGridLine := array.get(closeLineArr, 0)
nearBotGridLine := array.get(closeLineArr, 1)
Detail
https://www.fmz.com/strategy/445838
Last Modified
2024-03-22 16:03:09