
12 KiB
Name
动态移动平均线双策略Dynamic-Moving-Average-Dual-Strategy
Author
ChaoZhang
Strategy Description
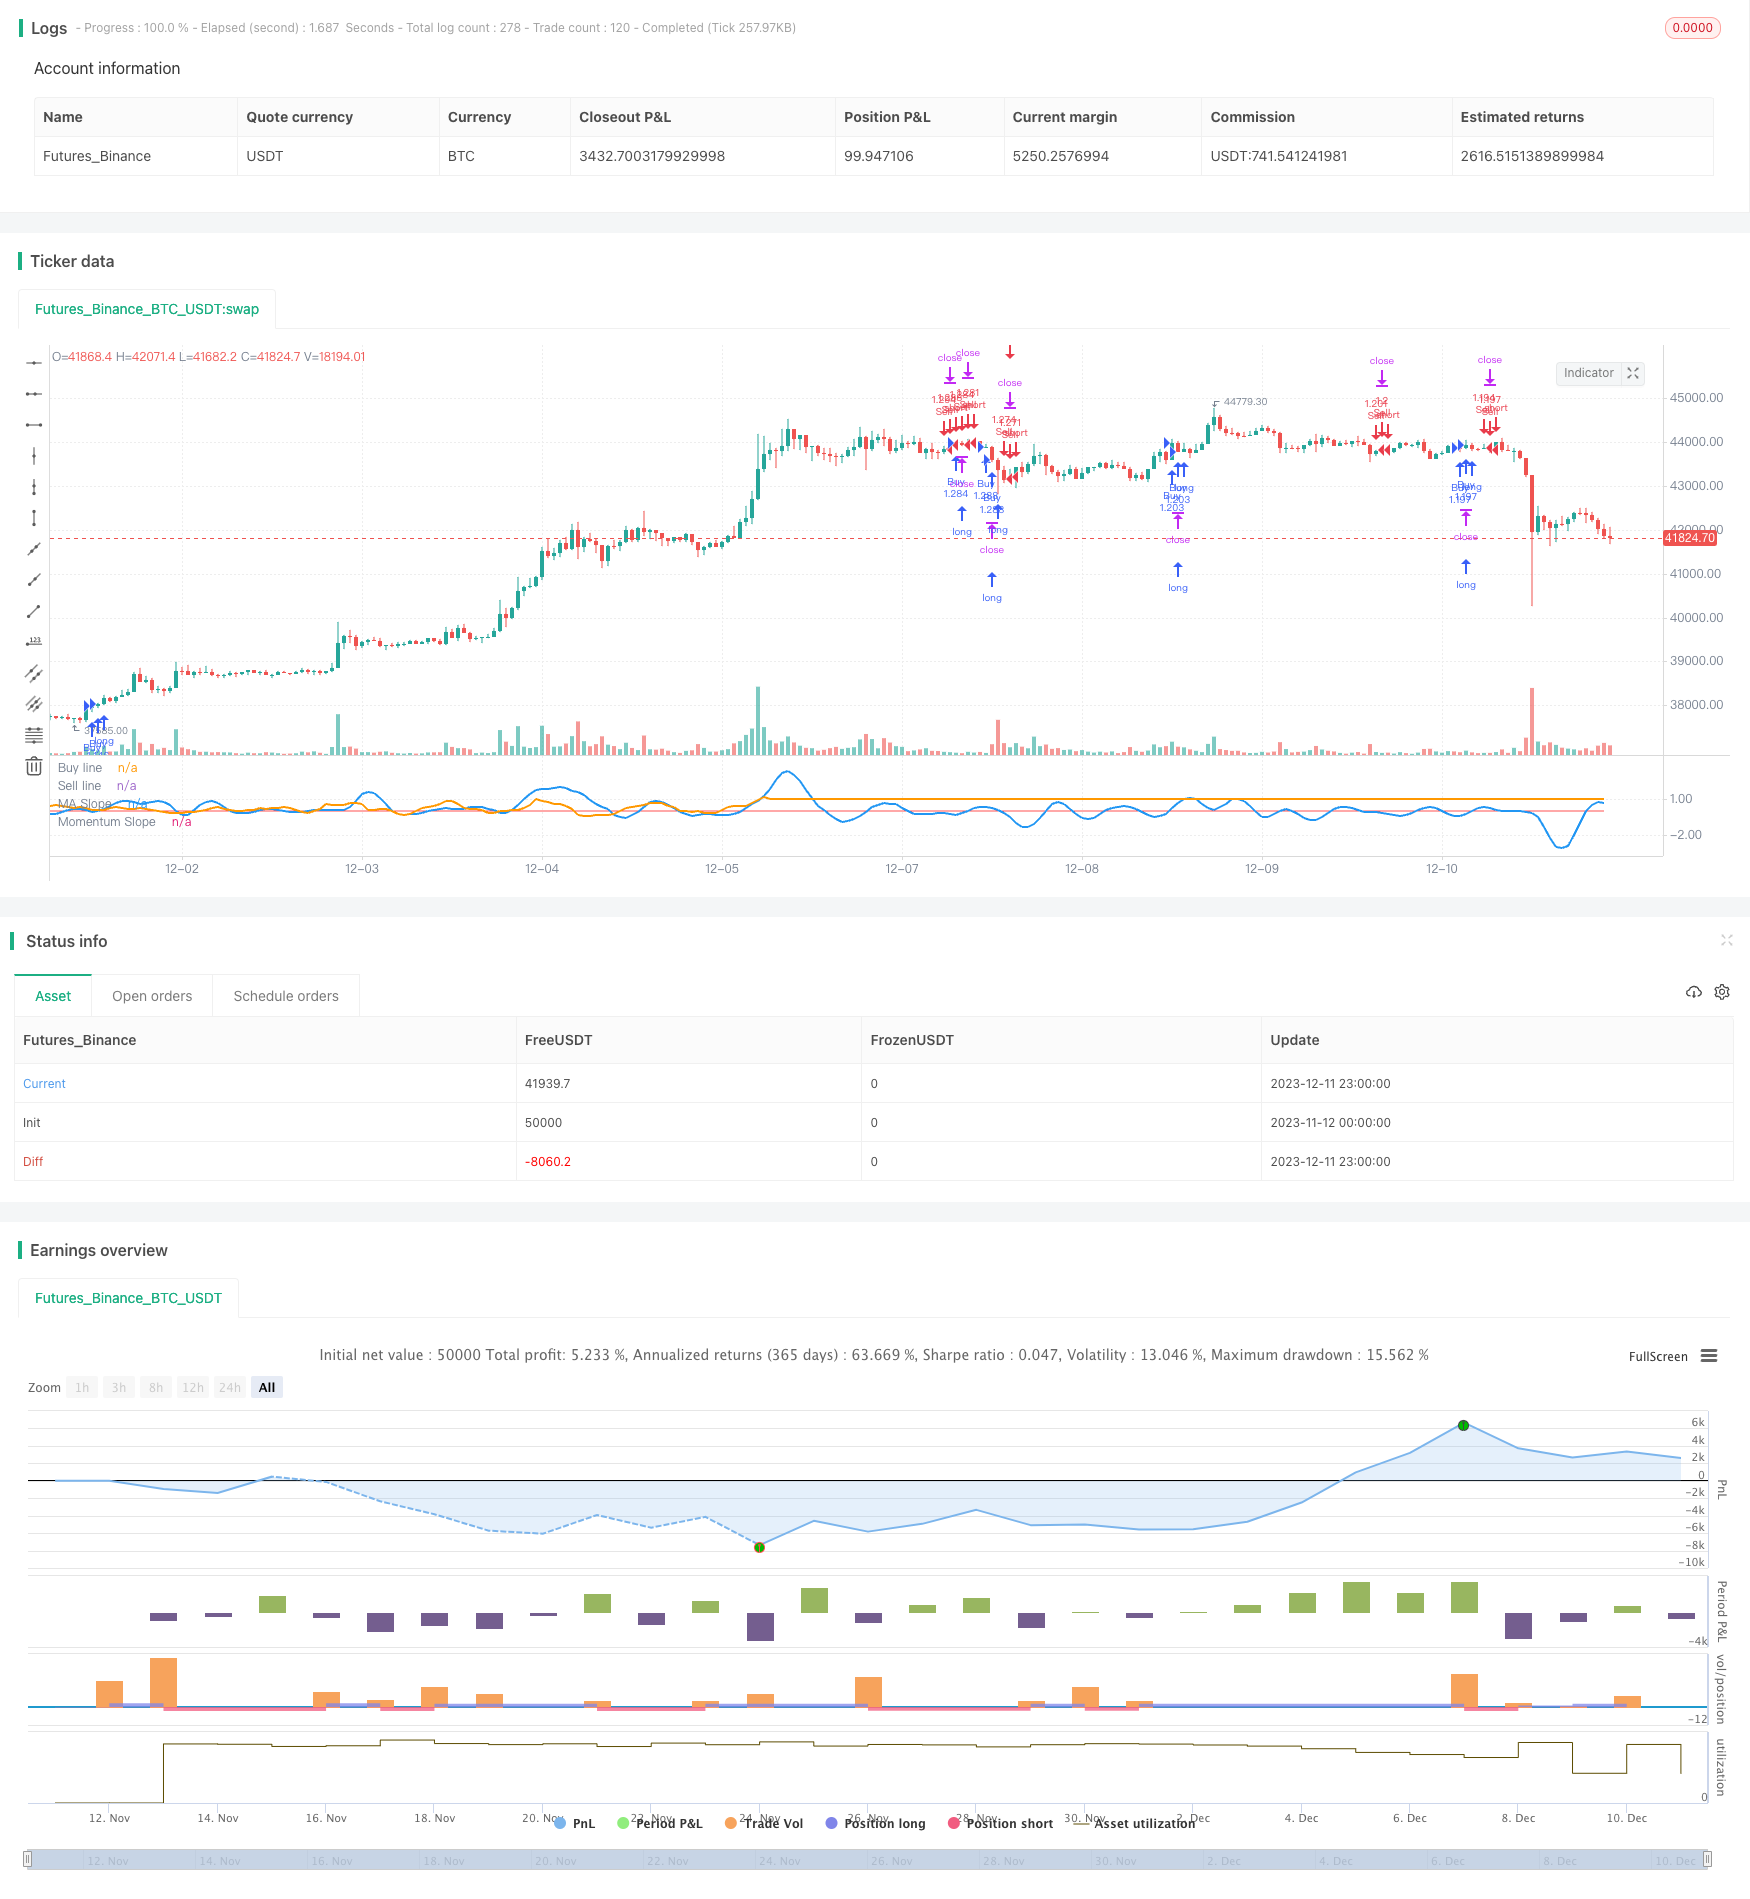 [trans]
概述
本策略利用移动平均线(MA)的斜率和动量指标的斜率进行交易决策。它会比较 MA 斜率和动量斜率与设定的阈值,当两条斜率都超过阈值时产生交易信号。该策略还包含低波动过滤器,在市场波动性低时使用不同的 MA 生成信号。
策略原理
本策略的核心在于比较两条斜率曲线。首先,它会计算 MA 和动量指标的斜率。斜率反映曲线的变化速度和方向。然后使用两个阈值,当两条斜率曲线都超过相应的阈值时产生交易信号。
例如,当 MA 斜率和动量斜率都超过上轨时,产生买入信号;当两条曲线都跌破下轨时,产生卖出信号。这样可以过滤掉部分假信号。
低波动过滤器使用一个长期 MA 判断市场波动性。当波动性低时,使用不同参数的 MA 生成交易信号,从而适应不同市场状态。
优势分析
本策略具有以下几个优势:
-
使用双重过滤器设定交易信号,可以过滤掉部分噪音,提高信号质量。
-
低波动过滤器使得策略可以适应不同的市场状态,具有弹性。
-
允许高度自定义不同参数,可以针对不同品种进行优化。
-
含有无复漆功能,可以减少曲线拟合对结果的影响。
风险分析
本策略也存在一些风险:
-
双重过滤可能过滤掉部分真实信号,导致错过机会。可以通过调整参数优化。
-
低波动过滤器判定阈值需要仔细测试确定。如果参数不当可能出现信号偏差。
-
MA 和动量指标参数设置需要针对具体品种优化,全市场通用参数难以确定。
-
无复漆功能无法完全规避回测曲线拟合问题,实盘效果仍需验证。
-
高度自定义参数会使参数空间复杂化,优化难度增加。
优化方向
本策略可以从以下几个方向进行优化:
-
测试更多种类的 MA 和动量指标的组合,找到最匹配的指标。
-
优化 MA 和动量指标的长度参数,平衡延迟和噪音。
-
优化斜率计算的参数,找到更稳定指标的组合。
-
测试不同的低波动性指标和参数,提高弹性。
-
在不同品种和周期上测试,寻找最佳适用范围。
-
构建参数自适应机制,减少手动优化工作量。
总结
本策略整体是一个非常灵活和可自定义的双 MA 策略。它同时参考价格和动量信息进行决策,可以有效过滤假信号。低波动过滤器也使得策略更具弹性,能够适应市场的变化。
通过参数优化和指标选择的改进,本策略可以成为一个值得考虑在实盘中应用的选择。它为利用 MA 和动量指标进行交易决策提供了一个参考模板。
||
Overview
This strategy uses the slope of the Moving Average (MA) and the slope of momentum indicators for trading decisions. It compares the MA slope and momentum slope with set thresholds, and generates trading signals when both slope exceed the thresholds. The strategy also contains a low volatility filter that uses a different MA to generate signals when the market volatility is low.
Strategy Logic
The core of this strategy lies in comparing two slope curves. Firstly, it calculates the slope of the MA and momentum indicator. The slope reflects the rate of change and direction of the curve. Then two thresholds are used, when both the MA slope and the momentum slope exceed the corresponding thresholds, trading signals are generated.
For example, when both the MA slope and momentum slope exceed the upper line, a buy signal is generated; when both curves fall below the lower line, a sell signal is generated. This can filter out some false signals.
The low volatility filter uses a long-term MA to determine market volatility. When volatility is low, a MA with different parameters is used to generate trading signals to adapt to different market states.
Advantage Analysis
This strategy has the following advantages:
-
The dual filter for setting up trading signals can filter out some noise and improve signal quality.
-
The low volatility filter allows the strategy to adapt to different market conditions with elasticity.
-
High customizability for different parameters can be optimized for different products.
-
It contains no repainting function to reduce the impact from curve fitting.
Risk Analysis
This strategy also has some risks:
-
The dual filter may filter out some real signals and miss opportunities. This can be optimized by adjusting parameters.
-
The threshold determination of the low volatility filter needs careful testing. Improper settings may cause signal deviations.
-
Parameter settings for MA and momentum indicators need to be optimized for specific products, and universal parameters are hard to determine.
-
The no repainting function cannot completely avoid the backtest curve fitting problem, and real trading performance still needs verification.
-
High customizability increases the complexity of the parameter space and the difficulty of optimization.
Optimization Directions
The strategy can be optimized in the following directions:
-
Test more combinations of MA and momentum indicators to find the best matching indicators.
-
Optimize the length parameters of MA and momentum indicators to balance lag and noise.
-
Optimize the parameters for calculating slope to find more stable indicator combinations.
-
Test different low volatility indicators and parameters to improve elasticity.
-
Test on different products and timeframes to find the best applicable scope.
-
Build parameter adaptive mechanisms to reduce manual optimization workload.
Conclusion
This is a very flexible and customizable dual MA strategy. It references both price and momentum information for decision making, which can effectively filter out false signals. The low volatility filter also makes the strategy more elastic to adapt to market changes.
With improvements in parameter optimization and indicator selection, this strategy can become a viable choice for real life trading. It provides a reference template for trading decisions using MA and momentum indicators. [/trans]
Strategy Arguments
| Argument | Default | Description |
|---|---|---|
| v_input_1 | 7 | (?Moving Average)1=SMA, 2=EMA, 3=WMA, 4=HullMA, 5=VWMA, 6=RMA, 7=TEMA, 8=Tilson T3 |
| v_input_2_close | 0 | MA Source: close |
| v_input_3 | 5 | Moving Average Length - LookBack Period |
| v_input_4 | 7 | Tilson T3 Factor - *.10 - so 7 = .7 etc. |
| v_input_5 | 3 | MA Slope Lookback |
| v_input_6 | 5 | MA Slope Smoothing |
| v_input_7 | 3 | (?Momentum Moving Average)1=RSI, 2=CCI, 3=RSI/ROC |
| v_input_8_close | 0 | Momentum Source: close |
| v_input_9 | 3 | Momentum Length |
| v_input_10 | 8 | Momentum Slope Lookback |
| v_input_11 | 7 | Momentum Slope Smoothing |
| v_input_12 | 1 | (?Time Resolution)Higher timeframe? |
| v_input_13 | 130 | MA Slope multiplier for Alternate Resolutions (Make the waves of the blue line similar size as the orange line) |
| v_input_14 | 0.02 | (?Buy and Sell Threshold)Buy when both slopes cross this line |
| v_input_15 | -0.03 | Sell when both slopes cross this line |
| v_input_16 | 28 | (?Low Volatility Function)Big MA Length |
| v_input_17 | 10 | Low Volatility Moving Average Length |
| v_input_18 | 0.05 | Low Volatility Buy and Sell Threshold |
| v_input_19 | 2.5 | Minimum volatility to trade |
Source (PineScript)
/*backtest
start: 2023-11-12 00:00:00
end: 2023-12-12 00:00:00
period: 1h
basePeriod: 15m
exchanges: [{"eid":"Futures_Binance","currency":"BTC_USDT"}]
*/

// This source code is subject to the terms of the Mozilla Public License 2.0 at https://mozilla.org/MPL/2.0/
// © Allenlk
//@version=4
strategy("DRSI DMA Scalping Strategy", shorttitle="DRSIDMA", overlay=false, initial_capital=1000, pyramiding=2, default_qty_type=strategy.percent_of_equity, default_qty_value=100)

//Inputs
matype             = input(7, minval=1, maxval=8, title="1=SMA, 2=EMA, 3=WMA, 4=HullMA, 5=VWMA, 6=RMA, 7=TEMA, 8=Tilson T3", group="Moving Average")
masrc              = input(close, title="MA Source", group="Moving Average")
malen              = input(5, title="Moving Average Length - LookBack Period", group="Moving Average")
factorT3           = input(defval=7, title="Tilson T3 Factor - *.10 - so 7 = .7 etc.", minval=0, group="Moving Average")
maderiv            = input(3, title="MA Slope Lookback", minval=1, group="Moving Average")
masmooth           = input(5, title="MA Slope Smoothing", minval=1, group="Moving Average")
momtype            = input(3, minval=1, maxval=3, title="1=RSI, 2=CCI, 3=RSI/ROC", group="Momentum Moving Average")
momsrc             = input(close, title="Momentum Source", group="Momentum Moving Average")
momlen             = input(3, title="Momentum Length", minval=1, group="Momentum Moving Average")
momderiv           = input(8, title="Momentum Slope Lookback", minval=1, group="Momentum Moving Average")
momsmooth          = input(7, title="Momentum Slope Smoothing", minval=1, group="Momentum Moving Average")
higherTf           = input("1", title="Higher timeframe?", type = input.resolution, group="Time Resolution")
higherTfmult       = input(130, title="MA Slope multiplier for Alternate Resolutions (Make the waves of the blue line similar size as the orange line)", group="Time Resolution")
buffup             = input(0.02, title="Buy when both slopes cross this line", step=0.01, group="Buy and Sell Threshold")
bufflow            = input(-0.03, title="Sell when both slopes cross this line", step=0.01, group="Buy and Sell Threshold")
lowVolMALength     = input(28, title="Big MA Length", minval=1, group="Low Volatility Function")
MAlength           = input(10, title="Low Volatility Moving Average Length", minval=1, group="Low Volatility Function")
MAThresh           = input(0.05, title="Low Volatility Buy and Sell Threshold", step=0.01, group="Low Volatility Function")
Volminimum         = input(2.5, title="Minimum volatility to trade", minval=0, step=0.01, group="Low Volatility Function")

//Low Volatility Function
//When Volatility is low refer to the slope of a long moving average
low_vol_MA         = sma(close, lowVolMALength)
low_vol_down       = (low_vol_MA[3] - low_vol_MA[1]) > MAThresh
low_vol_up         = (low_vol_MA[3] - low_vol_MA[1]) < MAThresh * -1
percent_volatility = (1 - (low / high)) * 100
chng_MA            = sma(percent_volatility, MAlength)
bad_vol            = chng_MA < Volminimum

//No repaint function
nrp_funct(_symbol, _res, _src) => security(_symbol, _res, _src[barstate.isrealtime ? 1 : 0])

//hull ma definition
hullma = wma(2*wma(masrc, malen/2)-wma(masrc, malen), round(sqrt(malen)))

//TEMA definition
ema1 = ema(masrc, malen)
ema2 = ema(ema1, malen)
ema3 = ema(ema2, malen)
tema = 3 * (ema1 - ema2) + ema3

//Tilson T3
factor = factorT3 *.10
gd(masrc, malen, factor) => ema(masrc, malen) * (1 + factor) - ema(ema(masrc, malen), malen) * factor
t3(masrc, malen, factor) => gd(gd(gd(masrc, malen, factor), malen, factor), malen, factor)
tilT3 = t3(masrc, malen, factor)

//MA Type
avg = matype == 1 ? sma(masrc,malen) : matype == 2 ? ema(masrc,malen) : matype == 3 ? wma(masrc,malen) : matype == 4 ? hullma : matype == 5 ? vwma(masrc, malen) : matype == 6 ? rma(masrc,malen) : matype == 7 ? 3 * (ema1 - ema2) + ema3 : tilT3

//MA Slope Percentage
DeltaAvg      = (avg / avg[maderiv]) - 1
SmoothedAvg   = sma(DeltaAvg, masmooth)
MAout         = nrp_funct(syminfo.tickerid, higherTf, SmoothedAvg) * higherTfmult

//Momentum indicators
Momentum = momtype == 1 ? rsi(momsrc, momlen) : momtype == 2 ? cci(momsrc, momlen) : momtype == 3 ? rsi(roc(momsrc,momlen),momlen) : na

//Momentum Slope Percentage
Deltamom = (Momentum / Momentum[momderiv]) - 1
SmoothedMom = sma(Deltamom, momsmooth)
Momout   = nrp_funct(syminfo.tickerid, higherTf, SmoothedMom)

//Plottings
plot(buffup, color=color.green, title="Buy line")
plot(bufflow, color=color.red, title="Sell line")
plot(MAout, color=color.blue, linewidth=2, title="MA Slope")
plot(Momout, color=color.orange, linewidth=2, title="Momentum Slope")

longCondition = bad_vol ? low_vol_up : MAout > buffup and Momout > buffup
if (longCondition)
    strategy.entry("Buy", strategy.long)

shortCondition = bad_vol ? low_vol_down : MAout < bufflow and Momout < bufflow
if (shortCondition)
    strategy.entry("Sell", strategy.short)
Detail
https://www.fmz.com/strategy/435265
Last Modified
2023-12-13 16:37:05