
7.7 KiB
Name
动态流动性级联捕捉策略-Dynamic-Liquidity-Cascade-Capture-Strategy
Author
ianzeng123
Strategy Description
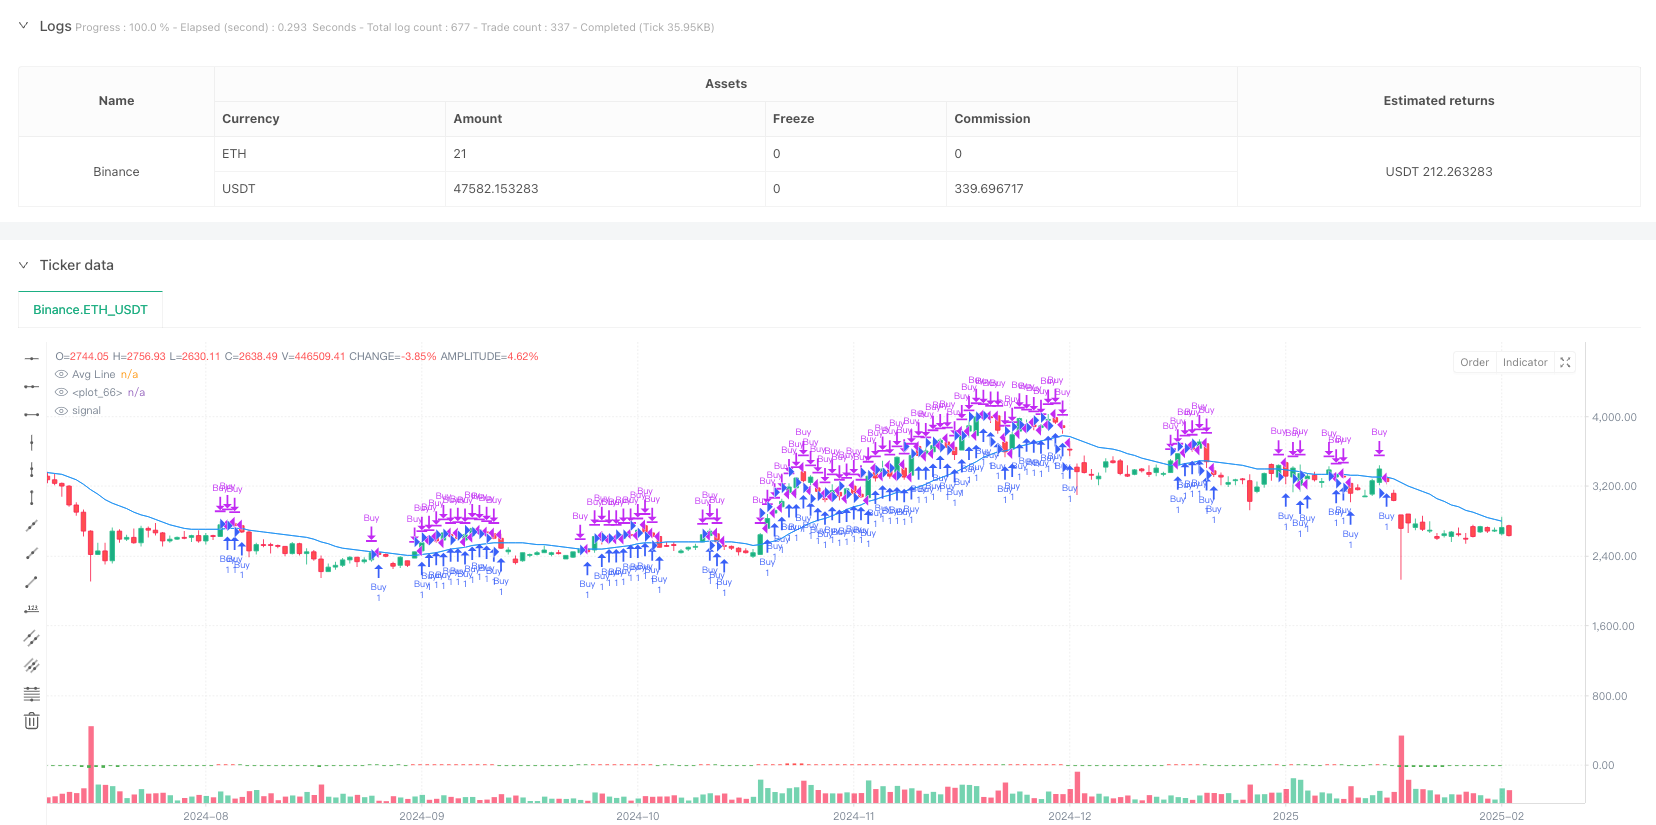
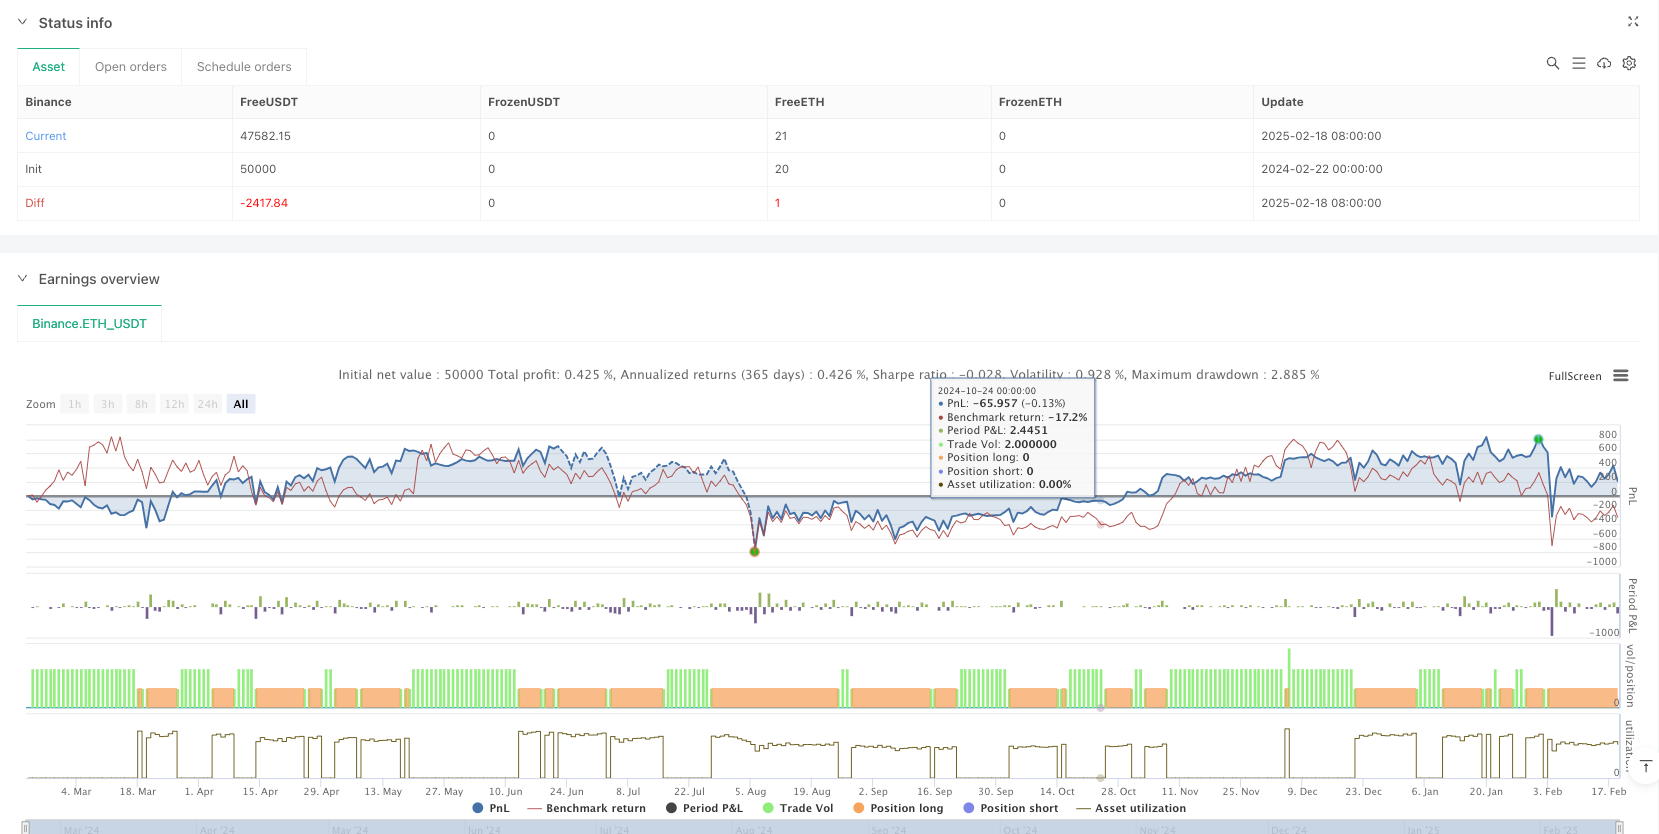
[trans]
概述
该策略是一个专门设计用于捕捉市场极端波动时期的量化交易系统。它通过监控价格与均线之间的偏离程度,识别市场中可能出现的流动性枯竭情况,从而捕捉市场反转机会。策略采用了均线组合、波动率跟踪以及动态止损机制,构建了一个完整的交易系统。
策略原理
策略的核心是通过计算价格与均线偏离度来识别市场异常。具体实现包括:
- 使用15周期简单移动平均线(SMA)和30周期指数移动平均线(EMA)的组合作为基准价格
- 计算当前价格与均线组合之间的百分比偏离度
- 通过89周期的最高值和最低值来确定历史极值
- 在出现连续3次做多型流动性枯竭时进场做多
- 设置了三重退出机制:技术反弹、反向流动性枯竭信号以及跟踪止损
策略优势
- 精确的市场时机把握:通过多重指标确认,提高入场准确性
- 风险控制完善:采用多层次的止损机制,有效控制下行风险
- 适应性强:策略可以根据市场波动度自动调整止损范围
- 执行力强:策略设定了明确的入场和出场条件,减少主观判断
- 系统化程度高:整个交易过程都是基于量化指标,易于实现自动化
策略风险
- 假信号风险:在横盘市场可能产生错误的流动性枯竭信号
- 滑点风险:在极端市场条件下,可能面临较大的执行滑点
- 参数敏感性:策略效果对均线周期和止损倍数较为敏感
- 市场环境依赖:在低波动率环境下,策略收益可能不够理想
- 技术风险:需要保证系统稳定性,避免信号延迟或丢失
策略优化方向
- 引入成交量指标:通过成交量确认流动性枯竭信号的有效性
- 优化参数自适应:根据市场波动状态动态调整策略参数
- 增加市场环境过滤:在不适合的市场环境下暂停交易
- 完善止损机制:可以考虑加入基于波动率的动态止损
- 优化信号确认机制:增加更多的技术指标来过滤假信号
总结
动态流动性级联捕捉策略是一个专注于捕捉市场极端情况的量化交易系统。通过科学的指标组合和严格的风险控制,策略能够在市场出现剧烈波动时捕捉交易机会。虽然存在一定的风险,但通过持续优化和完善,策略有望在各种市场环境下保持稳定的表现。
||
Overview
This strategy is a quantitative trading system specifically designed to capture extreme market volatility periods. It monitors the deviation between price and moving averages to identify potential market liquidity exhaustion situations and capture market reversal opportunities. The strategy incorporates moving average combinations, volatility tracking, and dynamic stop-loss mechanisms to build a complete trading system.
Strategy Principles
The core of the strategy is to identify market anomalies by calculating the deviation between price and moving averages. Specific implementation includes:
- Using a combination of 15-period Simple Moving Average (SMA) and 30-period Exponential Moving Average (EMA) as benchmark prices
- Calculating the percentage deviation between current price and moving average combination
- Determining historical extremes through 89-period highs and lows
- Entering long positions when three consecutive long-side liquidity exhaustion signals occur
- Implementing a triple exit mechanism: technical rebound, reverse liquidity exhaustion signals, and trailing stop-loss
Strategy Advantages
- Precise Market Timing: Multiple indicator confirmation improves entry accuracy
- Comprehensive Risk Control: Multi-layered stop-loss mechanism effectively controls downside risk
- High Adaptability: Strategy automatically adjusts stop-loss range based on market volatility
- Strong Execution: Clear entry and exit conditions reduce subjective judgment
- High Systematization: Entire trading process is based on quantitative indicators, easy to automate
Strategy Risks
- False Signal Risk: May generate incorrect liquidity exhaustion signals in sideways markets
- Slippage Risk: May face significant execution slippage under extreme market conditions
- Parameter Sensitivity: Strategy performance is sensitive to moving average periods and stop-loss multipliers
- Market Environment Dependency: Strategy returns may be suboptimal in low volatility environments
- Technical Risk: System stability must be maintained to avoid signal delays or losses
Strategy Optimization Directions
- Incorporate Volume Indicators: Confirm liquidity exhaustion signals through volume analysis
- Optimize Parameter Adaptivity: Dynamically adjust strategy parameters based on market volatility states
- Add Market Environment Filters: Pause trading in unsuitable market conditions
- Enhance Stop-Loss Mechanism: Consider adding volatility-based dynamic stop-loss
- Improve Signal Confirmation: Add more technical indicators to filter false signals
Summary
The Dynamic Liquidity Cascade Capture Strategy is a quantitative trading system focused on capturing extreme market situations. Through scientific indicator combinations and strict risk control, the strategy can capture trading opportunities during intense market volatility. While certain risks exist, through continuous optimization and improvement, the strategy has the potential to maintain stable performance across various market environments. [/trans]
Source (PineScript)
/*backtest
start: 2024-02-22 00:00:00
end: 2025-02-19 08:00:00
period: 1d
basePeriod: 1d
exchanges: [{"eid":"Binance","currency":"ETH_USDT"}]
*/

//@version=5
strategy("Liquidation Cascade Strategy", overlay=true)

// Paramètres de l'indicateur de liquidation
var float lastHigh = na
var float lastLow = na
var float lastPriceLow = na
var float lastPriceHigh = na
var bool shortLiq = na
var bool longLiq = na

src = close
maLength1 = 15
maLength2 = 30
ma1 = ta.sma(src, maLength1)
ma2 = ta.ema(src, maLength2)
avgLine = (ma1 + ma2) / 2
distVal = ((src - avgLine) / avgLine) * 100

ph = ta.highest(distVal, 89)
pl = ta.lowest(distVal, 89)

if ph == distVal and ph > 0
    lastHigh := distVal
    lastPriceHigh := high

if pl == distVal and pl < 0
    lastLow := distVal
    lastPriceLow := low

shortLiq := not na(lastHigh) and lastHigh == distVal and distVal > 0
longLiq := not na(lastLow) and lastLow == distVal and distVal < 0

// Condition d'achat : 3 liquidations longues consécutives
buyCondition = ta.valuewhen(longLiq, longLiq, 0) and ta.valuewhen(longLiq, longLiq, 1) and ta.valuewhen(longLiq, longLiq, 2)
if (buyCondition)
    strategy.entry("Buy", strategy.long)

// Conditions de vente
var float entryPrice = na
var bool positionOpen = false

// Mise à jour du prix d'entrée
if (buyCondition)
    entryPrice := close
    positionOpen := true

// 1. Vente sur rebond technique (distVal > -1%)
sellCondition1 = distVal > -1 and positionOpen

// 2. Vente sur liquidation courte
sellCondition2 = shortLiq and positionOpen

// 3. Trailing Stop (2x ATR)
atr = ta.atr(14)
trailingStop = close - 2 * atr
sellCondition3 = close < trailingStop and positionOpen

// Exécution des ventes
if (sellCondition1 or sellCondition2 or sellCondition3)
    strategy.close("Buy")
    positionOpen := false

// Visualisation
plot(avgLine, color=color.blue, title="Avg Line")
plot(distVal, color=distVal > 0 ? color.red : color.green, style=plot.style_columns)
Detail
https://www.fmz.com/strategy/483051
Last Modified
2025-02-24 15:16:23