
14 KiB
Name
动态波幅突破策略Bollinger-Band-Breakout-Strategy
Author
ChaoZhang
Strategy Description
 [trans]
概述
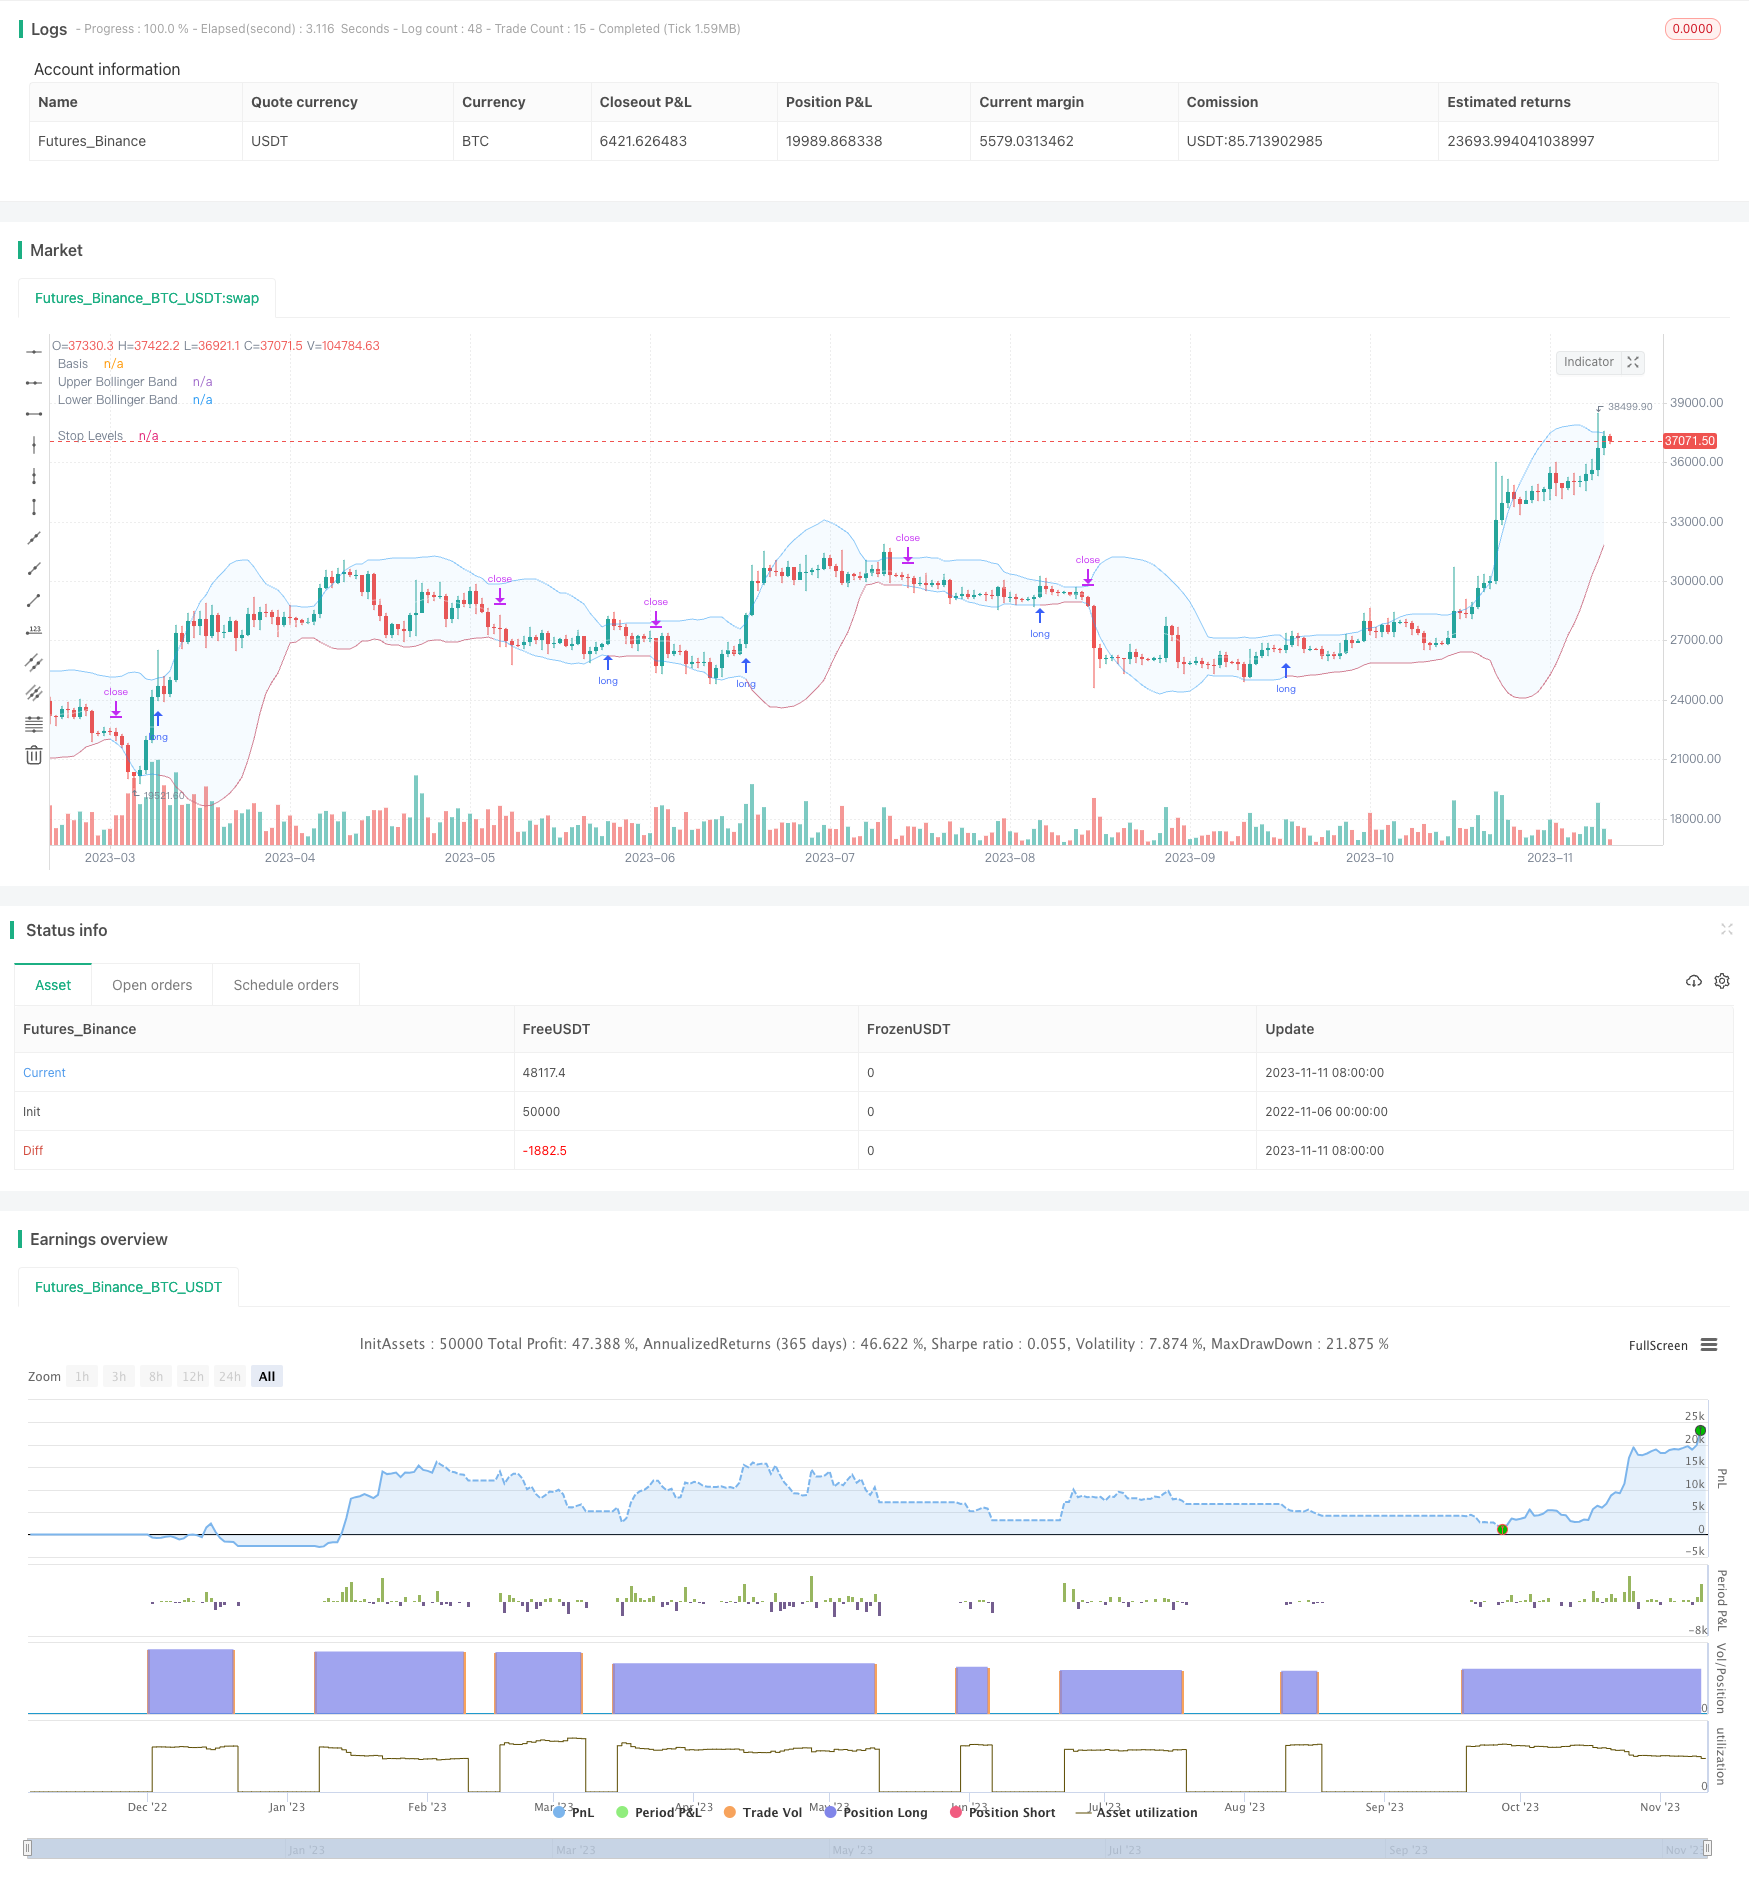
这个策略利用布林带的动态上下轨,实现当价格突破布林带上轨的时候做多,当价格跌破布林带下轨的时候平仓。与传统的突破策略不同的是,布林带上下轨会根据历史波动率动态变化,可以更好地判断市场的超买超卖状态。
策略原理
该策略主要依靠布林带指标判断价格的突破。布林带包含三条线:
- 中线:n天移动平均线
- 上轨:中线 + k * n天标准差
- 下轨:中线 - k * n天标准差
当价格上涨超过上轨时,认为市场处于超买状况,可以做多。当价格下跌超过下轨时,认为市场处于超卖状况,应该平仓。
该策略允许自定义布林带的参数:中线长度n和标准差的倍数k。默认中线长度为20天,标准差倍数为2。
股票每日收盘后,会检查当天的收盘价是否突破上轨。如果是,则第二天开盘时执行做多信号。做多后,会实时监控价格是否突破下轨,如果突破则平仓。
该策略还引入了均线过滤器,只有当价格高于均线时,才会生成做多信号。可以选择在当前周期或更高周期绘制均线,以控制进入的时间点。
止损方式也提供了两个选择:固定百分比止损或跟踪布林带下轨。后者可以提供更大的空间让利润运行。
策略优势
- 利用布林带判断市场 SUPERBUY/SUPPERSELL
- 均线过滤,避免逆势交易
- 可自定义布林带参数,适应不同周期
- 提供两种止损方式选择
- 支持回测优化参数,实盘验证策略
策略风险
- 布林带并不能完全判断超买超卖
- 均线过滤可能错过较快突破机会
- 固定止损可能过于保守,跟踪止损可能过于激进
- 需要优化参数以适应不同品种和周期
- 无法限制亏损大小,须考虑资金管理
策略优化
- 测试不同的均线参数组合
- 尝试不同的布林带参数
- 比较固定百分比止损和下轨跟踪止损的收益率
- 增加资金管理模块,限制单笔损失
- 结合其他指标验证布林带信号
总结
该策略利用布林带的动态上下轨判断超买超卖,参考均线过滤信号,采用止损保护资金。相比传统固定轨道突破,更能适应市场的波动。通过参数优化和风险控制,可以进一步提高策略稳定性和收益率。总体来说,该策略利用布林带的动态特性,获取了突破策略的优点,值得实盘验证和长期跟踪优化。
||
Overview
This strategy utilizes the dynamic upper and lower bands of Bollinger Bands to go long when the price breaks above the upper band and close position when the price falls below the lower band. Unlike traditional breakout strategies with fixed levels, the bands of Bollinger Bands change dynamically based on historical volatility, making it better at identifying overbought and oversold conditions.
Strategy Logic
The strategy relies primarily on the Bollinger Bands indicator to identify breakouts. The Bollinger Bands consist of three lines:
- Middle Line: n-period moving average
- Upper Band: Middle Line + k * n-period standard deviation
- Lower Band: Middle Line - k * n-period standard deviation
When the price rises above the upper band, the market is considered overbought, and a long position can be initiated. When the price falls below the lower band, the market is oversold, and the position should be closed.
The strategy allows customization of the Bollinger Bands parameters: the moving average period n and the standard deviation multiplier k. The default values are 20 periods for the moving average and 2 for the standard deviation multiplier.
The strategy checks if the closing price breaks above the upper band after each trading day. If it does, a long signal is triggered on the next day's opening. Once long, the strategy monitors if the price breaks below the lower band in real-time and closes the position if it does.
The strategy also incorporates a moving average filter that only generates buy signals when the price is above the moving average line. The moving average can be set on the current or higher timeframe to better control entry timing.
Two stop loss choices are provided: fixed percentage stop loss or trailing the lower band. The latter gives more room for profits to run.
Advantages of the Strategy
- Utilize Bollinger Bands to judge overbought/oversold levels
- Moving average filter avoids trading against the trend
- Customizable Bollinger Bands parameters suit different periods
- Choice between two stop loss methods
- Backtesting allows parameter optimization and out-of-sample verification
Risks of the Strategy
- Bollinger Bands cannot fully determine overbought/oversold
- Moving average filter may miss faster breakouts
- Fixed stop loss can be too conservative, trailing stop may be too aggressive
- Parameters need optimization for different products and timeframes
- Unable to limit loss size, need to consider money management
Optimization Directions
- Test different moving average parameter combinations
- Try different Bollinger Bands parameters
- Compare fixed percentage stop loss vs trailing lower band in terms of return
- Add money management module to limit per trade loss
- Incorporate other indicators to confirm Bollinger Bands signal
Conclusion
The strategy identifies overbought/oversold conditions using Bollinger Bands' dynamic bands, refers to moving average filters, and uses stops to protect capital. Compared to traditional fixed-level breakouts, it adapts better to market fluctuations. With further parameter optimization and risk controls, the strategy can achieve higher stability and returns. Overall, by utilizing the dynamic nature of Bollinger Bands, the strategy captures the strengths of breakout strategies and is worth live trading and long-term optimization.
[/trans]
Strategy Arguments
| Argument | Default | Description |
|---|---|---|
| v_input_float_1 | 2 | Standard Deviation (Top) |
| v_input_float_2 | 2 | Standard Deviation (Bottom) |
| v_input_1 | timestamp(01 Jan 2019 06:00 +0000) | (?backtest window)Backtest Start Date |
| v_input_2 | timestamp(01 Jan 2100 00:00 +0000) | Backtest End Date |
| v_input_int_1 | 20 | (?Bollinger Band Settings)Bollinger Band Length |
| v_input_bool_1 | false | (?order entry)Use Fixed Percentage for Initial Stop? |
| v_input_int_2 | 8 | Stop |
| v_input_string_1 | 0 | Execute Trades On...: Wick |
| v_input_bool_2 | false | (?moving average filtering)Use Moving Average for Filtering (Current Timeframe)? |
| v_input_string_2 | 0 | MA Type For Filtering: SMA |
| v_input_int_3 | 50 | Moving Average: Length |
| v_input_color_1 | green | Color |
| v_input_bool_3 | false | Use Moving Average for Filtering (High Timeframe)? |
| v_input_timeframe_1 | D | Timeframe of Moving Average |
| v_input_string_3 | 0 | MA Type For Filtering: SMA |
| v_input_int_4 | 50 | Moving Average: Length |
| v_input_color_2 | white | Color |
Source (PineScript)
/*backtest
start: 2022-11-06 00:00:00
end: 2023-11-12 00:00:00
period: 1d
basePeriod: 1h
exchanges: [{"eid":"Futures_Binance","currency":"BTC_USDT"}]
*/

//@version=5

// Revision:        1
// Author:          @millerrh
// Strategy:
//      Entry: Buy when price breaks out of upper Bollinger Band
//      Exit: Trail a stop with the lower Bollinger Band
// Conditions/Variables:
//    1. Can add a filter to only take setups that are above a user-defined moving average on current timeframe and/or longer timeframe (helps avoid trading counter trend)
//    2. Manually configure which dates to back test
//    3. User-Configurable Bollinger Band Settings
//    4. Optionally use a tighter initial stop level.  Once Bollinger Band catches up, trail with lower Bollinger Band to give more breathing room.

// strategy('Donchian Breakout', overlay=true, initial_capital=100000, currency='USD', default_qty_type=strategy.percent_of_equity, calc_on_every_tick = true,
//   default_qty_value=100, commission_type=strategy.commission.percent, commission_value=0.1)

strategy('Bollinger Breakout', overlay=true, initial_capital=100000, currency='USD', default_qty_type=strategy.percent_of_equity,
  default_qty_value=100, commission_type=strategy.commission.percent, commission_value=0.0, calc_on_order_fills=true)

// === BACKTEST RANGE ===
Start = input(defval = timestamp("01 Jan 2019 06:00 +0000"), title = "Backtest Start Date", group = "backtest window")
Finish = input(defval = timestamp("01 Jan 2100 00:00 +0000"), title = "Backtest End Date", group = "backtest window")

// == INPUTS ==
// Bollinger Band Inputs
bbLength = input.int(20, minval=1, group = "Bollinger Band Settings", title="Bollinger Band Length",
  tooltip = "Bollinger Band moving average length.")
bbMultTop = input.float(2.0, minval=0.001, maxval=50, title="Standard Deviation (Top)")
bbMultBot = input.float(2.0, minval=0.001, maxval=50, title="Standard Deviation (Bottom)")

useTightStop = input.bool(title='Use Fixed Percentage for Initial Stop?', defval=false, group = "order entry",
  tooltip = "'Keep your losers small and let winners run' is the saying.  This will allow you to use a tight initial stop
  until the lower Bollinger Band catches up.")
percStop = input.int(title="Stop", defval=8, group = "order entry", inline = "perc")
trigInput = input.string(title='Execute Trades On...', defval='Wick', options=['Wick', 'Close'], group = "order entry",
  tooltip = "Useful for comparing standing stop orders at the Bollinger Band boundary (executing on the wick) vs. waiting for candle closes prior to taking action")

// Moving Average Filtering Inputs
useMaFilter = input.bool(title='Use Moving Average for Filtering (Current Timeframe)?', defval=false, group = "moving average filtering",
  tooltip = "Signals will be ignored when price is under this moving average.  The intent is to keep you out of bear periods and only buying when
             price is showing strength.")
maType = input.string(defval='SMA', options=['EMA', 'SMA'], title='MA Type For Filtering', group = "moving average filtering")
maLength = input.int(defval=50, title="Moving Average:    Length", minval=1, group = "moving average filtering", inline = "1ma")
ma1Color = input.color(color.new(color.green, 50), title = " Color", group = "moving average filtering", inline = "1ma")
useMaFilter2 = input.bool(title='Use Moving Average for Filtering (High Timeframe)?', defval=false, group = "moving average filtering")
tfSet = input.timeframe(defval="D", title="Timeframe of Moving Average", group = "moving average filtering",
  tooltip = "Allows you to set a different time frame for a moving average filter.  Trades will be ignored when price is under this moving average.
  The idea is to keep your eye on the larger moves in the market and stay on the right side of the longer term trends and help you be pickier about
  the stocks you trade.")
ma2Type = input.string(defval='SMA', options=['EMA', 'SMA'], title='MA Type For Filtering', group = "moving average filtering")
ma2Length = input.int(defval=50, title="Moving Average:    Length", minval=1, group = "moving average filtering", inline = "2ma")
ma2Color = input.color(color.new(color.white, 50), title = " Color", group = "moving average filtering", inline = "2ma")


// === THE BOLLINGER BAND ===
// Logic
bbBasis = ta.sma(close, bbLength)
bbUpper = bbBasis + bbMultTop * ta.stdev(close, bbLength)
bbLower = bbBasis - bbMultBot * ta.stdev(close, bbLength)

// Plotting
plot(bbBasis, "Basis", color=color.new(color.white, 50))
p1 = plot(bbUpper, color=color.new(color.blue, 50), linewidth=1, title='Upper Bollinger Band')
p2 = plot(bbLower, color=color.new(color.blue, 50), linewidth=1, title='Lower Bollinger Band')
fill(p1, p2, title = "Background", color=color.rgb(33, 150, 243, 95))

// == FILTERING LOGIC ==
// Declare function to be able to swap out EMA/SMA
ma(maType, src, length) =>
    maType == 'EMA' ? ta.ema(src, length) : ta.sma(src, length)  //Ternary Operator (if maType equals EMA, then do ema calc, else do sma calc)
maFilter = ma(maType, close, maLength)
maFilter2 = request.security(syminfo.tickerid, tfSet, ma(ma2Type, close, ma2Length))

// Plotting
plot(useMaFilter ? maFilter : na, title='Trend Filter MA - CTF', color=ma1Color, linewidth=2, style=plot.style_line)
plot(useMaFilter2 ? maFilter2 : na, title='Trend Filter MA - HTF', color=ma2Color, linewidth=2, style=plot.style_line)


// == ENTRY AND EXIT CRITERIA ==
// Trigger stop based on candle close or High/Low (i.e. Wick)
trigResistance = trigInput == 'Close' ? close : trigInput == 'Wick' ? high : na
trigSupport = trigInput == 'Close' ? close : trigInput == 'Wick' ? low : na
buySignal = trigResistance >= bbUpper

buyConditions = (useMaFilter ? bbUpper > maFilter : true) and
  (useMaFilter2 ? bbUpper > maFilter2 : true)

// == STOP AND PRICE LEVELS ==
// Configure initial stop level
inPosition = strategy.position_size > 0
stopLevel = strategy.position_avg_price - (strategy.position_avg_price * percStop/100)
posStop = stopLevel > bbLower ? stopLevel : bbLower


// Check if using stop vs. not
stop = useTightStop ? posStop : bbLower
plot(inPosition ? stop : na, style=plot.style_linebr, color=color.new(color.red, 40), linewidth = 1, title = "Stop Levels", trackprice=false)

sellSignal = trigSupport <= stop

// == STRATEGY ENTRIES & EXITS ==
// This string of code enters and exits at the candle close
if trigInput == 'Close'
    strategy.entry('Long', strategy.long, when=buyConditions and buySignal)
    strategy.close('Long', when=sellSignal)

// This string of code enters and exits at the wick (i.e. with pre-set stops)
if trigInput == 'Wick'
    strategy.entry('Long', strategy.long, stop=bbUpper, when=buyConditions)
    strategy.exit('Exit Long', from_entry='Long', stop=stop)
strategy.cancel('Long',when= not(buyConditions)) // Resets stop level once buyConditions aren't true anymore
Detail
https://www.fmz.com/strategy/431922
Last Modified
2023-11-13 11:26:50