
14 KiB
Name
动态止损止盈的双均线趋势跟踪与蜡烛图反应策略-Dynamic-Stop-Loss-and-Take-Profit-Dual-Moving-Average-Trend-Following-Strategy-with-Candlestick-Reactions
Author
ChaoZhang
Strategy Description
[trans]
概述
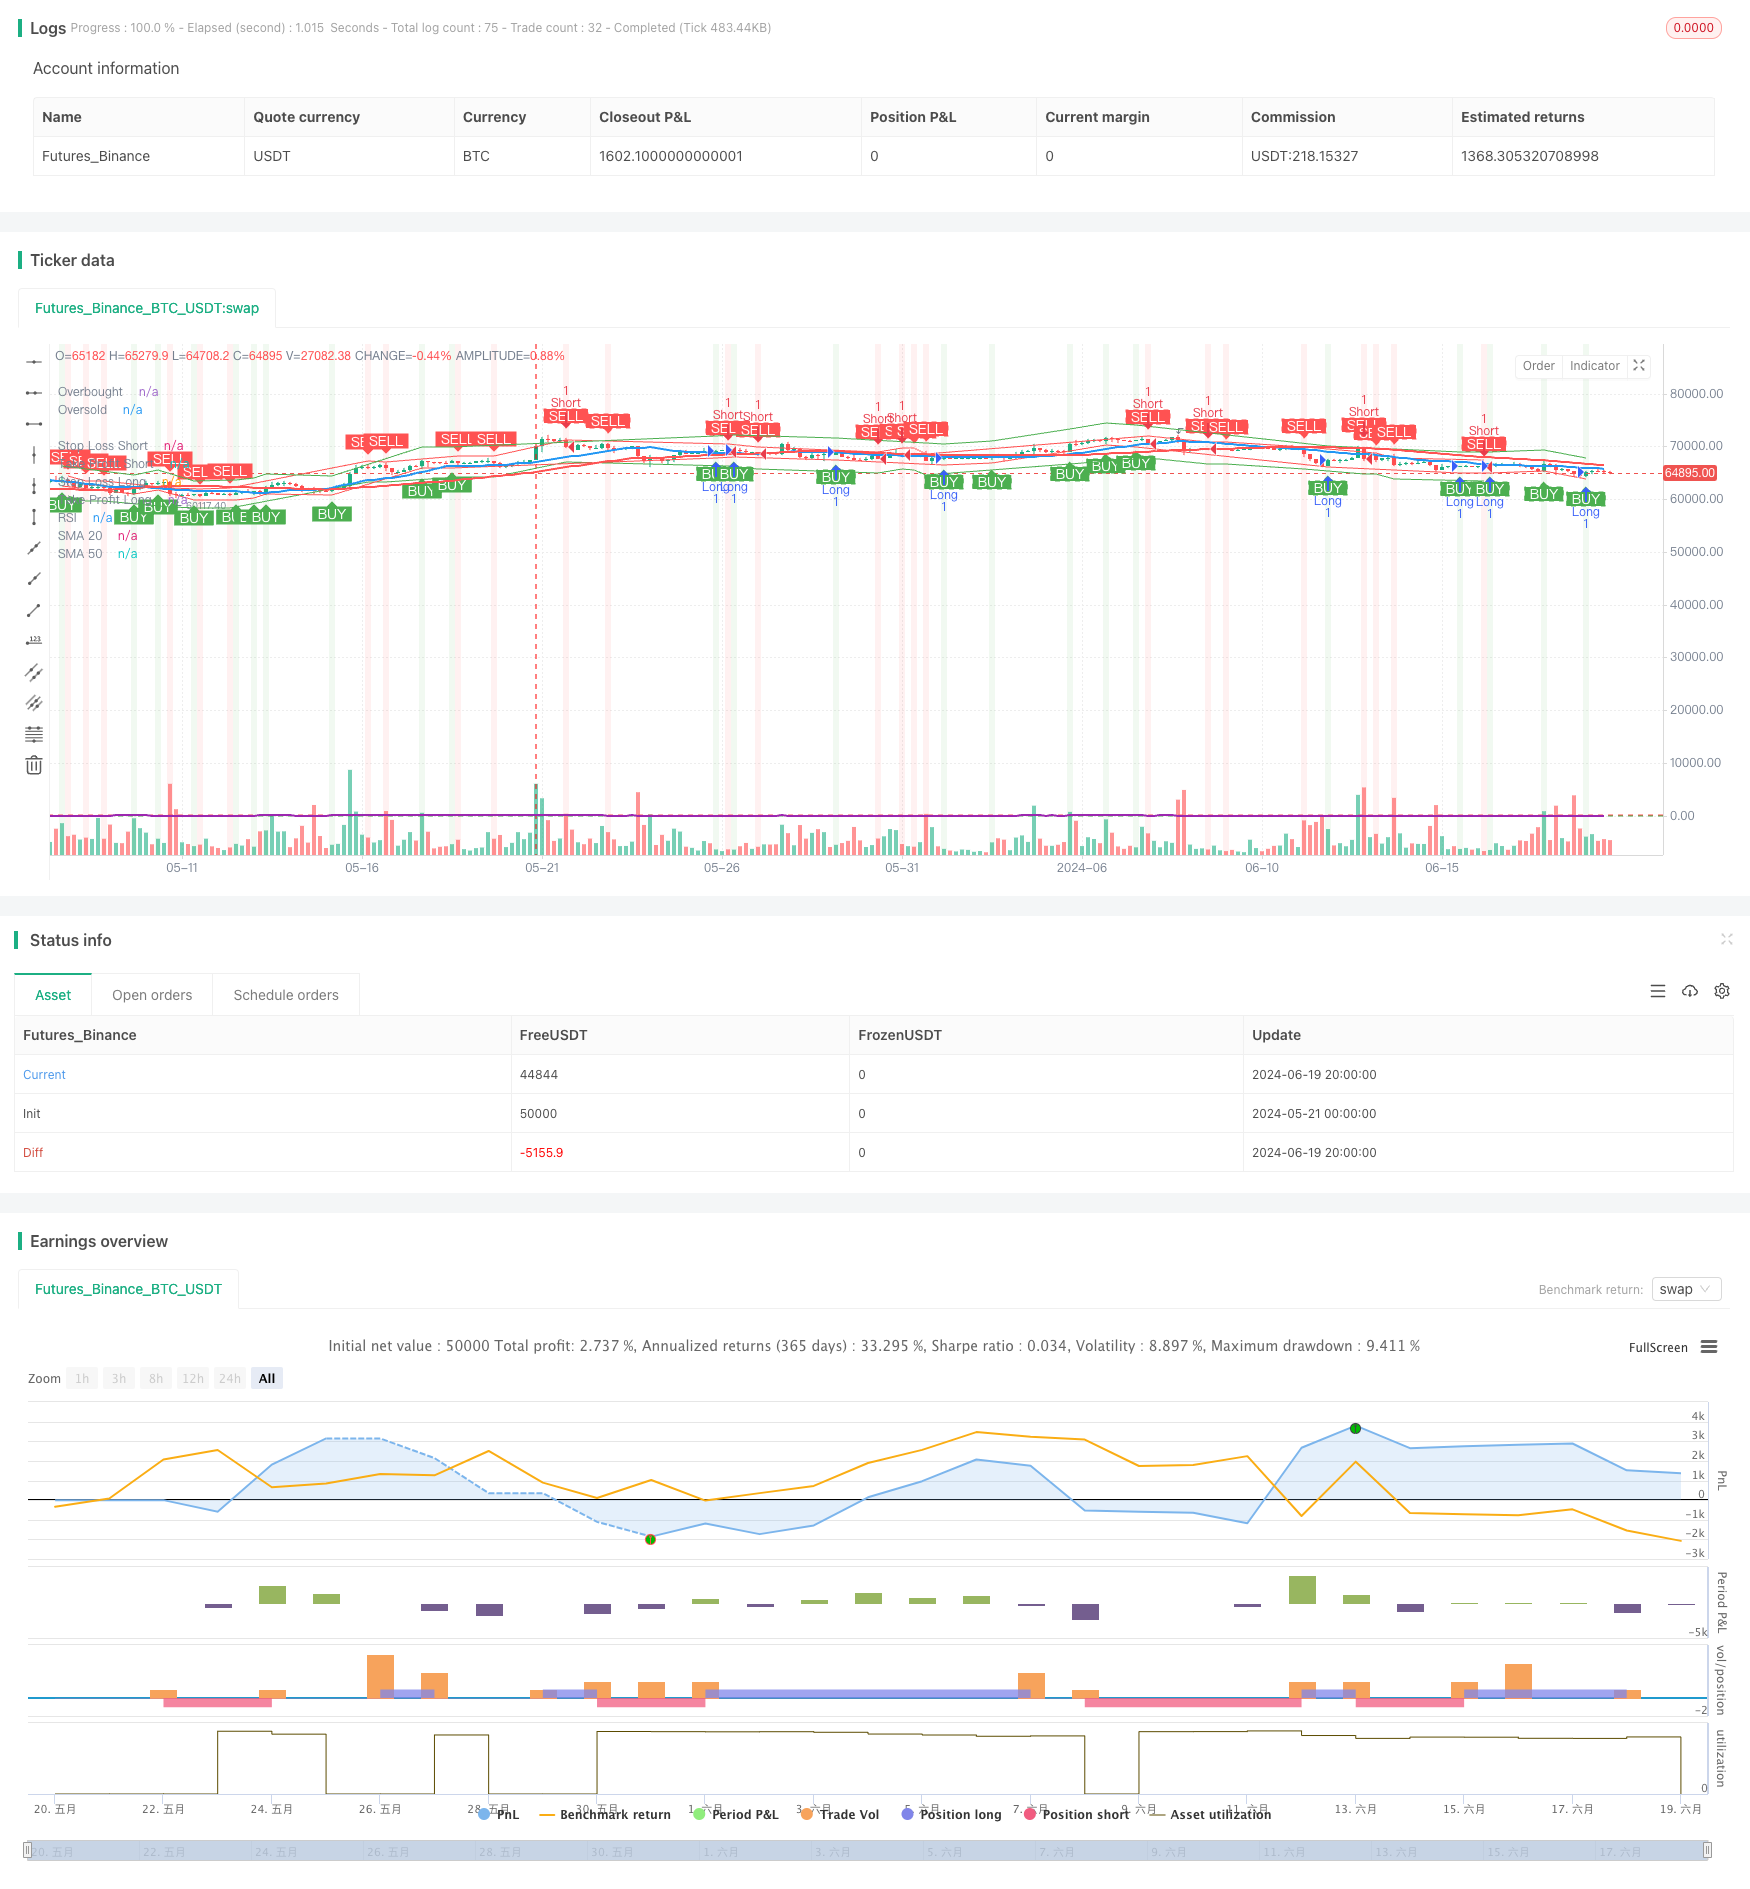
这个策略是一个结合了技术指标和蜡烛图形态分析的趋势跟踪系统。它主要利用双均线交叉、RSI指标和蜡烛图吞没形态来识别潜在的交易机会。策略还包含了动态止损和止盈机制,以管理风险和锁定利润。这种多因子approach旨在提高交易决策的准确性和稳健性。
策略原理
策略的核心原理包括以下几个方面:
-
双均线系统: 使用20日和50日简单移动平均线(SMA)来确定市场趋势。这两条均线的交叉可以提供潜在的趋势变化信号。
-
RSI指标: 利用14周期的相对强弱指标(RSI)来衡量市场的超买或超卖状态。RSI值超过70被视为超买,低于30则被视为超卖。
-
蜡烛图形态识别: 策略重点关注看涨和看跌吞没形态。这些形态可能预示着市场情绪的转变和潜在的反转点。
-
动态止损和止盈: 根据入场价格设置百分比止损和止盈水平,以控制风险和保护利润。
-
交易信号生成: 当检测到看涨吞没形态时,策略生成做多信号;当检测到看跌吞没形态时,生成做空信号。
-
可视化: 策略在图表上绘制均线、RSI、蜡烛图背景色、交易箭头以及止损止盈水平,以增强分析的直观性。
策略优势
-
多因子分析: 通过结合移动平均线、RSI和蜡烛图形态,策略能够从多个角度分析市场,提高信号的可靠性。
-
趋势确认: 双均线系统有助于确认整体市场趋势,减少逆势交易的风险。
-
动态风险管理: 百分比止损和止盈机制能够根据市场波动性自动调整,提供灵活的风险控制。
-
市场情绪捕捉: 蜡烛图吞没形态分析有助于捕捉短期市场情绪变化,提高入场时机的准确性。
-
可视化分析: 策略提供丰富的图表标记和指标显示,便于交易者直观理解市场状况和策略逻辑。
-
灵活性: 策略参数可调,允许用户根据个人偏好和不同市场条件进行优化。
策略风险
-
假突破风险: 在横盘市场中,均线交叉和蜡烛图形态可能产生虚假信号,导致频繁交易和不必要的损失。
-
滞后性: 移动平均线本质上是滞后指标,可能在快速变化的市场中错过重要的转折点。
-
过度依赖技术指标: 策略主要基于技术分析,忽视了基本面因素可能导致在重大新闻事件或经济数据发布时表现不佳。
-
参数敏感性: 策略的性能可能对所选择的参数值(如均线周期、RSI设置、止损止盈百分比)高度敏感。
-
市场条件依赖: 策略可能在某些市场条件下表现良好,但在其他情况下效果不佳,需要持续监控和调整。
策略优化方向
-
引入自适应参数: 考虑使用自适应移动平均线或动态RSI阈值,以更好地适应不同的市场环境。
-
增加过滤器: 引入额外的过滤条件,如成交量确认或波动率指标,以减少假信号。
-
整合多时间框架分析: 结合更长和更短的时间框架分析,以提高趋势判断的准确性。
-
优化止损止盈机制: 考虑使用跟踪止损或基于ATR的动态止损,以更好地适应市场波动。
-
加入机器学习算法: 利用机器学习技术优化参数选择和信号生成过程,提高策略的适应性。
-
引入基本面分析: 考虑整合经济日历或新闻情绪分析,以应对重大事件的影响。
-
改进风险管理: 实施更复杂的仓位管理策略,如基于波动率的头寸规模调整。
总结
动态止损止盈的双均线趋势跟踪与蜡烛图反应策略是一个多维度的技术分析系统,结合了趋势跟踪、动量分析和形态识别。通过整合多个技术指标和图表分析工具,该策略旨在捕捉市场趋势变化和短期情绪波动,同时通过动态风险管理机制来保护交易资金。
尽管该策略提供了一个全面的分析框架,但仍然存在一些固有的风险和局限性。为了提高策略的稳健性和适应性,建议交易者持续监控策略表现,并考虑引入更多高级技术,如自适应参数、多时间框架分析和机器学习算法。
最终,成功应用这一策略需要交易者深入理解其原理,谨慎管理风险,并根据不断变化的市场环境进行必要的调整和优化。通过持续改进和细致的回测,这个策略有潜力成为一个有效的交易工具,帮助交易者在复杂多变的金融市场中做出更明智的决策。
||
Overview
This strategy is a trend-following system that combines technical indicators with candlestick pattern analysis. It primarily uses dual moving average crossovers, the RSI indicator, and candlestick engulfing patterns to identify potential trading opportunities. The strategy also incorporates dynamic stop-loss and take-profit mechanisms to manage risk and lock in profits. This multi-factor approach aims to enhance the accuracy and robustness of trading decisions.
Strategy Principles
The core principles of the strategy include:
-
Dual Moving Average System: Uses 20-day and 50-day Simple Moving Averages (SMA) to determine market trends. Crossovers of these two lines can provide potential signals for trend changes.
-
RSI Indicator: Utilizes the 14-period Relative Strength Index (RSI) to measure overbought or oversold market conditions. An RSI value above 70 is considered overbought, while below 30 is considered oversold.
-
Candlestick Pattern Recognition: The strategy focuses on bullish and bearish engulfing patterns. These patterns may indicate shifts in market sentiment and potential reversal points.
-
Dynamic Stop-Loss and Take-Profit: Sets percentage-based stop-loss and take-profit levels based on the entry price to control risk and protect profits.
-
Trade Signal Generation: Generates long signals when a bullish engulfing pattern is detected and short signals when a bearish engulfing pattern is identified.
-
Visualization: The strategy plots moving averages, RSI, candlestick background colors, trade arrows, and stop-loss/take-profit levels on the chart to enhance the intuitiveness of the analysis.
Strategy Advantages
-
Multi-Factor Analysis: By combining moving averages, RSI, and candlestick patterns, the strategy can analyze the market from multiple angles, increasing the reliability of signals.
-
Trend Confirmation: The dual moving average system helps confirm overall market trends, reducing the risk of counter-trend trading.
-
Dynamic Risk Management: Percentage-based stop-loss and take-profit mechanisms automatically adjust to market volatility, providing flexible risk control.
-
Market Sentiment Capture: Candlestick engulfing pattern analysis helps capture short-term market sentiment changes, improving the accuracy of entry timing.
-
Visual Analysis: The strategy provides rich chart markings and indicator displays, making it easier for traders to intuitively understand market conditions and strategy logic.
-
Flexibility: Strategy parameters are adjustable, allowing users to optimize based on personal preferences and different market conditions.
Strategy Risks
-
False Breakout Risk: In ranging markets, moving average crossovers and candlestick patterns may produce false signals, leading to frequent trading and unnecessary losses.
-
Lag: Moving averages are inherently lagging indicators and may miss important turning points in rapidly changing markets.
-
Over-reliance on Technical Indicators: The strategy is primarily based on technical analysis, ignoring fundamental factors that may lead to poor performance during major news events or economic data releases.
-
Parameter Sensitivity: The strategy's performance may be highly sensitive to the chosen parameter values (such as moving average periods, RSI settings, stop-loss/take-profit percentages).
-
Market Condition Dependency: The strategy may perform well under certain market conditions but poorly in others, requiring ongoing monitoring and adjustment.
Strategy Optimization Directions
-
Introduce Adaptive Parameters: Consider using adaptive moving averages or dynamic RSI thresholds to better adapt to different market environments.
-
Add Filters: Introduce additional filtering conditions, such as volume confirmation or volatility indicators, to reduce false signals.
-
Integrate Multi-Timeframe Analysis: Combine analysis from longer and shorter timeframes to improve trend judgment accuracy.
-
Optimize Stop-Loss and Take-Profit Mechanisms: Consider using trailing stops or ATR-based dynamic stops to better adapt to market volatility.
-
Incorporate Machine Learning Algorithms: Utilize machine learning techniques to optimize parameter selection and signal generation processes, improving strategy adaptability.
-
Introduce Fundamental Analysis: Consider integrating economic calendars or news sentiment analysis to account for the impact of major events.
-
Improve Risk Management: Implement more sophisticated position sizing strategies, such as volatility-based position size adjustments.
Conclusion
The Dynamic Stop-Loss and Take-Profit Dual Moving Average Trend Following Strategy with Candlestick Reactions is a multidimensional technical analysis system that combines trend following, momentum analysis, and pattern recognition. By integrating multiple technical indicators and chart analysis tools, the strategy aims to capture market trend changes and short-term sentiment fluctuations while protecting trading capital through dynamic risk management mechanisms.
Although the strategy provides a comprehensive analytical framework, it still has some inherent risks and limitations. To enhance the strategy's robustness and adaptability, traders are advised to continuously monitor strategy performance and consider introducing more advanced techniques such as adaptive parameters, multi-timeframe analysis, and machine learning algorithms.
Ultimately, successful application of this strategy requires traders to deeply understand its principles, carefully manage risks, and make necessary adjustments and optimizations based on ever-changing market environments. Through continuous improvement and meticulous backtesting, this strategy has the potential to become an effective trading tool, helping traders make more informed decisions in complex and dynamic financial markets.
[/trans]
Source (PineScript)
/*backtest
start: 2024-05-21 00:00:00
end: 2024-06-20 00:00:00
period: 4h
basePeriod: 15m
exchanges: [{"eid":"Futures_Binance","currency":"BTC_USDT"}]
*/

//@version=5
strategy("Gold Technical Analysis with Candle Reactions", overlay=true)

// Parameters for Stop Loss and Take Profit
stopLossPercent = input.float(2, title="Stop Loss Percentage", minval=0.1) / 100
takeProfitPercent = input.float(4, title="Take Profit Percentage", minval=0.1) / 100

// Fetch Gold data
gold = request.security("BTC_USDT:swap", "D", close)

// Moving Averages
sma20 = ta.sma(gold, 20)
sma50 = ta.sma(gold, 50)

// Relative Strength Index
rsi = ta.rsi(gold, 14)

// Candlestick Patterns
bullish_engulfing = (close[1] < open[1]) and (close > open) and (close >= open[1]) and (open <= close[1])
bearish_engulfing = (close[1] > open[1]) and (close < open) and (close <= open[1]) and (open >= close[1])

// Plot Moving Averages
plot(sma20, title="SMA 20", color=color.blue, linewidth=2)
plot(sma50, title="SMA 50", color=color.red, linewidth=2)

// RSI Plot
hline(70, "Overbought", color=color.red)
hline(30, "Oversold", color=color.green)
plot(rsi, title="RSI", color=color.purple, linewidth=2, style=plot.style_line)

// Candlestick Pattern Detection
bgcolor(bullish_engulfing ? color.new(color.green, 90) : na)
bgcolor(bearish_engulfing ? color.new(color.red, 90) : na)

// User Reaction Logic
var string reaction = na
var string action = na
var float stopLossLevel = na
var float takeProfitLevel = na

if (bullish_engulfing)
    reaction := "Positive sentiment, consider buying opportunities."
    action := "Long Buy"
    stopLossLevel := close * (1 - stopLossPercent)
    takeProfitLevel := close * (1 + takeProfitPercent)
    strategy.entry("Long", strategy.long)
    strategy.exit("Take Profit/Stop Loss", "Long", limit=takeProfitLevel, stop=stopLossLevel)
else if (bearish_engulfing)
    reaction := "Negative sentiment, consider selling opportunities."
    action := "Short Sell"
    stopLossLevel := close * (1 + stopLossPercent)
    takeProfitLevel := close * (1 - takeProfitPercent)
    strategy.entry("Short", strategy.short)
    strategy.exit("Take Profit/Stop Loss", "Short", limit=takeProfitLevel, stop=stopLossLevel)

// Display Reaction and Action for the most recent pattern
var label last_label = na
if (reaction != na and action != na)
    if (not na(last_label))
        label.delete(last_label)
    last_label := label.new(x=bar_index, y=high, text=reaction + " Action: " + action, style=label.style_label_down, color=color.white, textcolor=color.black)

// Plot buy/sell arrows on the chart for past data
plotshape(series=bullish_engulfing, title="Long Buy", location=location.belowbar, color=color.green, style=shape.labelup, text="BUY", textcolor=color.white)
plotshape(series=bearish_engulfing, title="Short Sell", location=location.abovebar, color=color.red, style=shape.labeldown, text="SELL", textcolor=color.white)

// Plot Stop Loss and Take Profit Levels
plot(series=(bullish_engulfing ? stopLossLevel : na), title="Stop Loss Long", style=plot.style_line, color=color.red, linewidth=1)
plot(series=(bullish_engulfing ? takeProfitLevel : na), title="Take Profit Long", style=plot.style_line, color=color.green, linewidth=1)
plot(series=(bearish_engulfing ? stopLossLevel : na), title="Stop Loss Short", style=plot.style_line, color=color.red, linewidth=1)
plot(series=(bearish_engulfing ? takeProfitLevel : na), title="Take Profit Short", style=plot.style_line, color=color.green, linewidth=1)
Detail
https://www.fmz.com/strategy/454764
Last Modified
2024-06-21 18:03:18