
10 KiB
Name
动态指标驱动的趋势跟踪策略结合风险管理系统-Dynamic-Indicator-Driven-Trend-Following-Strategy-with-Risk-Management-System
Author
ChaoZhang
Strategy Description
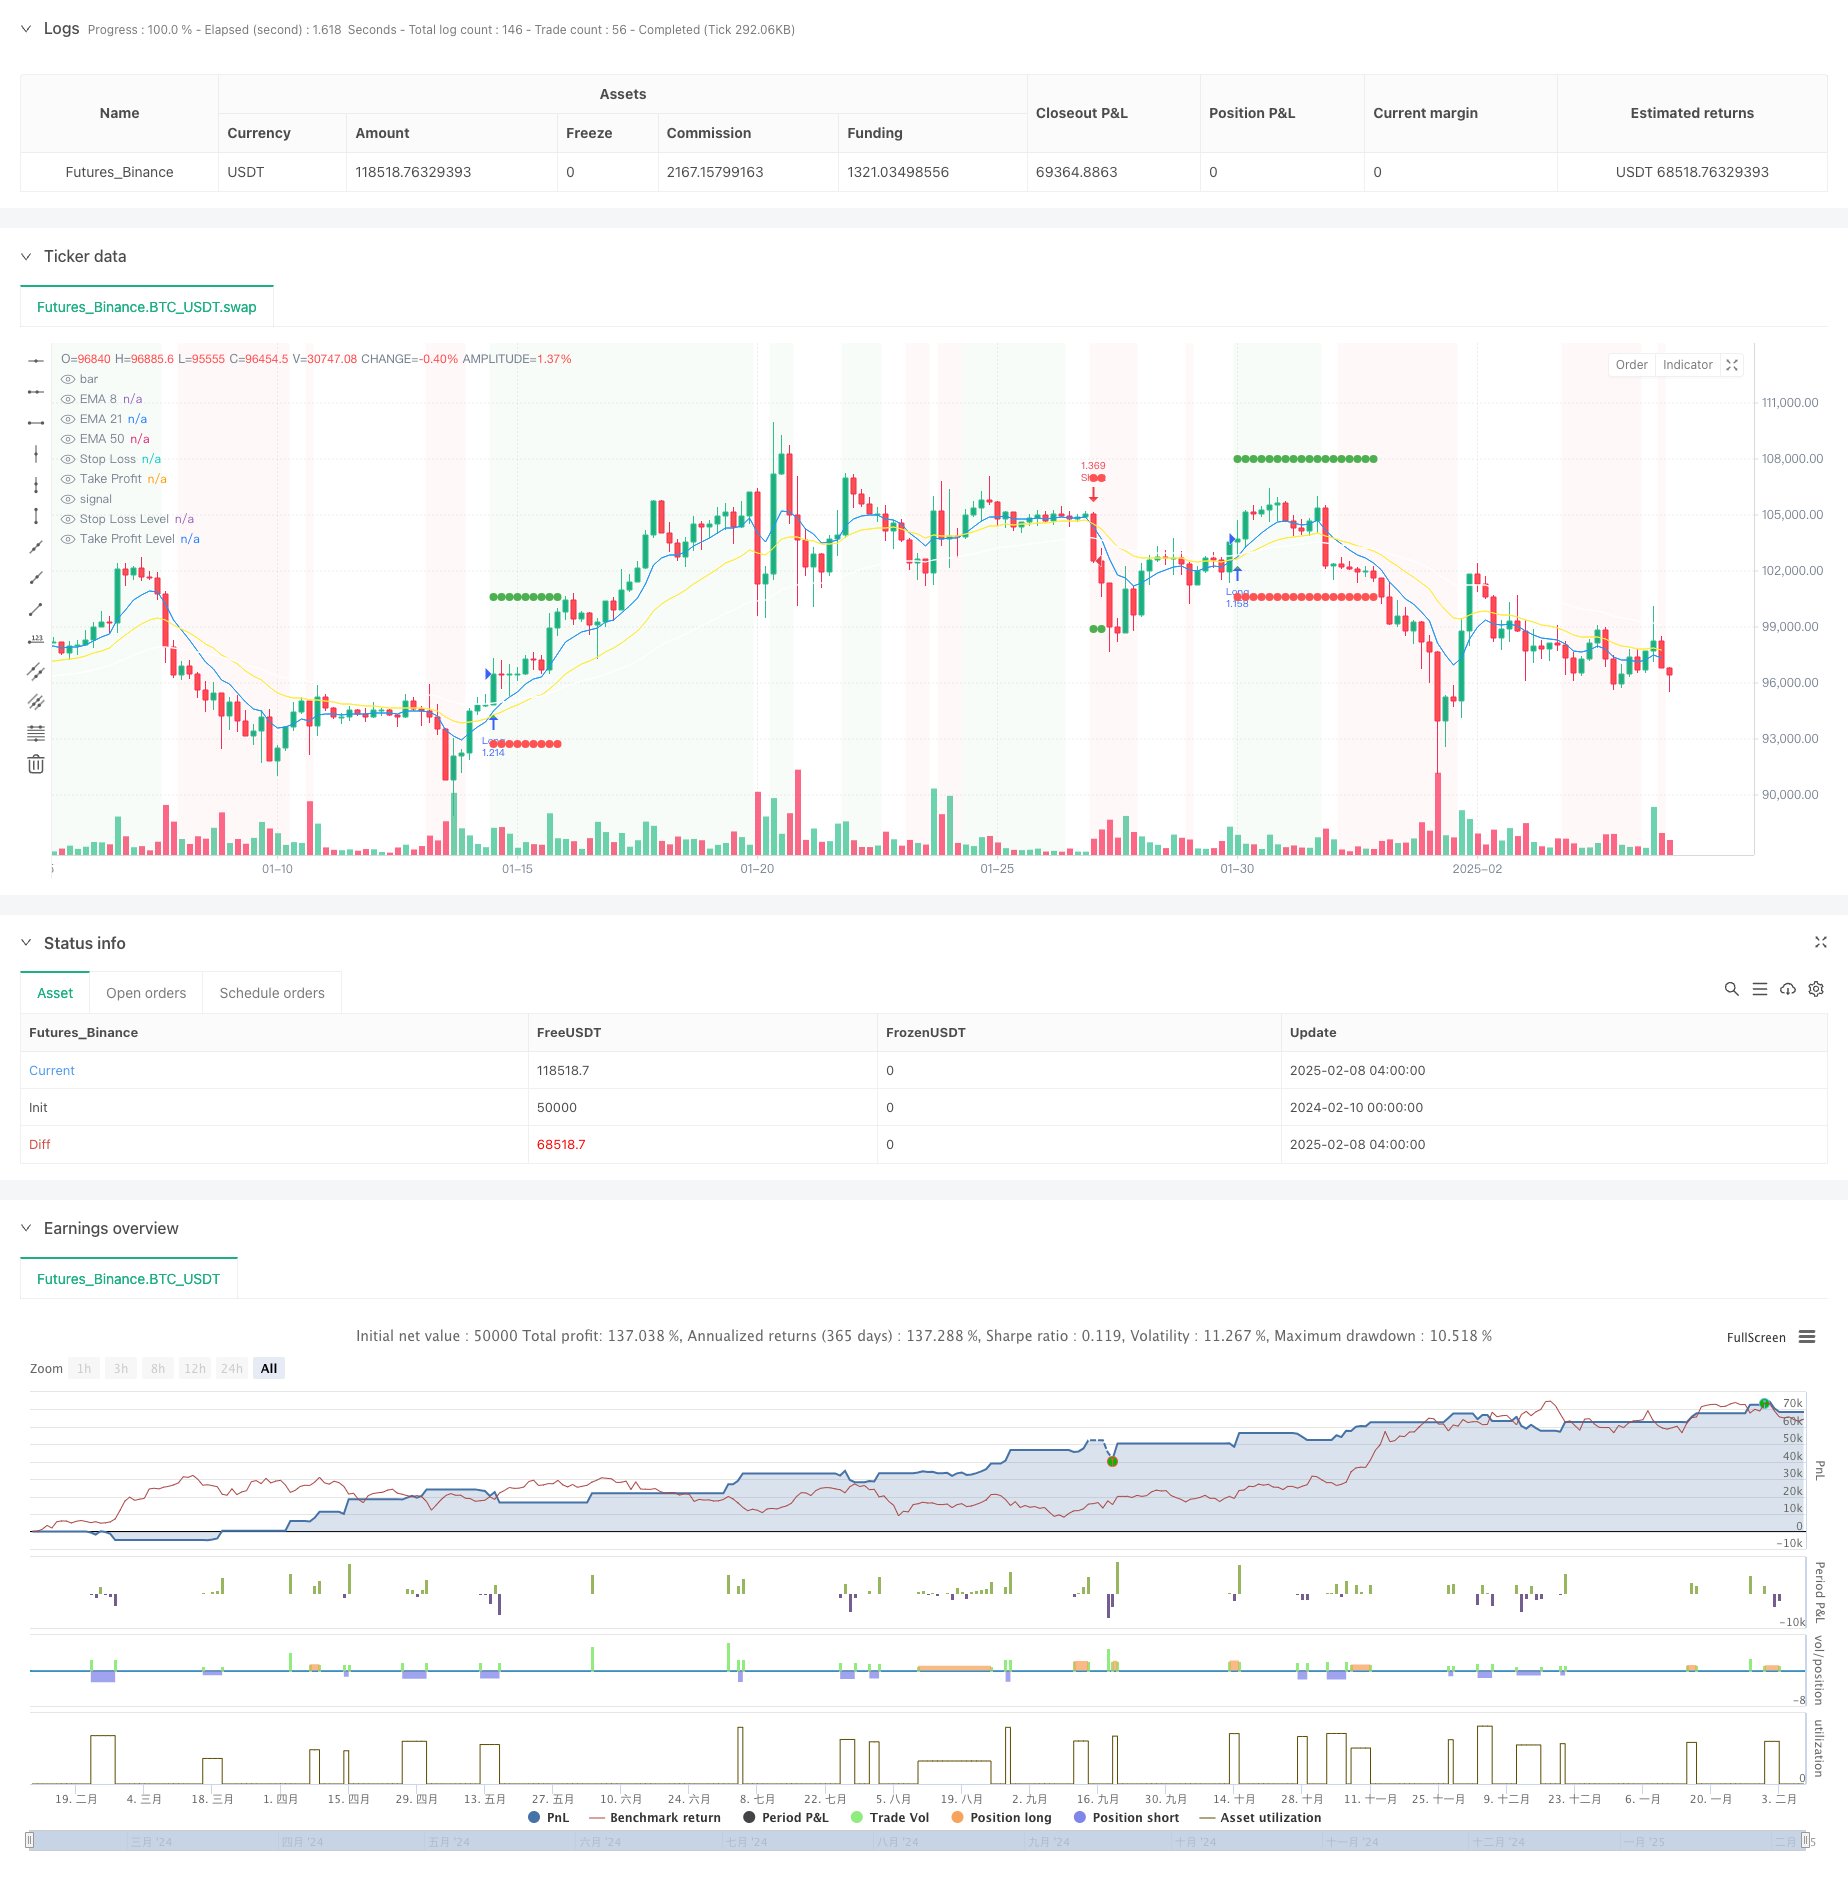
[trans]
概述
这是一个基于多重技术指标和风险管理的趋势跟踪策略。该策略综合运用了移动平均线、相对强弱指标(RSI)、动向指标(DMI)等多个技术指标来识别市场趋势,并通过动态止损、头寸管理和每月最大回撤限制等风险控制手段来保护资金安全。策略的核心在于通过多维度的技术指标来确认趋势的有效性,同时严格控制风险敞口。
策略原理
策略采用多层次的趋势确认机制:
- 通过8/21/50周期指数移动平均线(EMA)判断趋势方向
- 使用价格通道中线作为趋势过滤器
- 结合RSI均线(5周期)在35-65区间内的运动来过滤假突破
- 通过DMI指标(14周期)确认趋势强度
- 利用动量指标(8周期)和成交量放大来验证趋势的持续性
- 采用基于ATR的动态止损来控制风险
- 实施固定风险模式的头寸管理,每次交易风险额度为初始资金的5%
- 设置10%的月度最大回撤限制以避免过度损失
策略优势
- 多重技术指标交叉验证,提高了趋势判断的准确性
- 动态止损机制有效控制单笔交易风险
- 固定风险的头寸管理方式使资金利用更加合理
- 月度最大回撤限制提供了系统性风险防护
- 结合成交量指标,增强了趋势确认的可靠性
- 2:1的盈亏比设置提高了长期盈利能力
策略风险
- 多重指标的使用可能导致信号滞后
- 在震荡市场中可能产生频繁虚假信号
- 固定风险模式在波动率剧烈变化时可能不够灵活
- 月度回撤限制可能导致错过重要交易机会
- 趋势反转时可能承受较大回撤
策略优化方向
- 引入自适应的指标参数,以适应不同市场环境
- 开发更灵活的头寸管理方案,考虑市场波动率变化
- 增加趋势强度的量化评估,优化入场时机
- 设计更智能的月度风险限制机制
- 加入市场环境识别模块,在不同市场条件下调整策略参数
总结
该策略通过多维度技术指标的综合运用,建立了一个相对完整的趋势跟踪交易系统。策略的优势在于其全面的风险管理框架,包括动态止损、头寸管理和回撤控制。虽然存在一定的滞后性风险,但通过优化和改进,策略有望在不同市场环境下保持稳定的表现。关键是要在保持策略核心逻辑的同时,增强其对市场环境的适应能力。 ||
Overview
This is a trend-following strategy based on multiple technical indicators and risk management. The strategy combines moving averages, Relative Strength Index (RSI), Directional Movement Index (DMI), and other technical indicators to identify market trends, while protecting capital through dynamic stop-loss, position management, and monthly maximum drawdown limits. The core concept lies in confirming trend validity through multi-dimensional technical indicators while strictly controlling risk exposure.
Strategy Principles
The strategy employs a multi-layered trend confirmation mechanism:
- Uses 8/21/50 period Exponential Moving Averages (EMA) to determine trend direction
- Utilizes price channel midline as a trend filter
- Incorporates RSI moving average (5-period) movement within 35-65 range to filter false breakouts
- Confirms trend strength through DMI indicator (14-period)
- Verifies trend continuation using momentum indicator (8-period) and volume expansion
- Implements ATR-based dynamic stop-loss for risk control
- Applies fixed-risk position sizing with 5% risk per trade of initial capital
- Sets 10% monthly maximum drawdown limit to prevent excessive losses
Strategy Advantages
- Multiple technical indicators cross-validation improves trend judgment accuracy
- Dynamic stop-loss mechanism effectively controls single trade risk
- Fixed-risk position sizing enables more rational capital utilization
- Monthly maximum drawdown limit provides systemic risk protection
- Volume indicator integration enhances trend confirmation reliability
- 2:1 reward-to-risk ratio improves long-term profitability
Strategy Risks
- Multiple indicators may lead to signal lag
- May generate frequent false signals in ranging markets
- Fixed-risk approach may lack flexibility during dramatic volatility changes
- Monthly drawdown limit might cause missing important trading opportunities
- May experience significant drawdowns during trend reversals
Strategy Optimization Directions
- Introduce adaptive indicator parameters to suit different market environments
- Develop more flexible position sizing schemes considering volatility changes
- Add quantitative trend strength assessment to optimize entry timing
- Design smarter monthly risk limit mechanisms
- Include market environment recognition module to adjust strategy parameters under different market conditions
Summary
The strategy establishes a relatively complete trend-following trading system through the comprehensive use of multi-dimensional technical indicators. Its strength lies in the comprehensive risk management framework, including dynamic stop-loss, position sizing, and drawdown control. While there are certain lag risks, the strategy has the potential to maintain stable performance across different market environments through optimization and improvement. The key is to enhance its adaptability to market environments while maintaining the core strategy logic.[/trans]
Source (PineScript)
/*backtest
start: 2024-02-10 00:00:00
end: 2025-02-08 08:00:00
period: 4h
basePeriod: 4h
exchanges: [{"eid":"Futures_Binance","currency":"BTC_USDT"}]
*/

//@version=5
strategy("High Win-Rate Crypto Strategy with Drawdown Limit", overlay=true, initial_capital=10000, default_qty_type=strategy.fixed, process_orders_on_close=true)

// Moving Averages
ema8 = ta.ema(close, 8)
ema21 = ta.ema(close, 21)
ema50 = ta.ema(close, 50)

// RSI settings
rsi = ta.rsi(close, 14)
rsi_ma = ta.sma(rsi, 5)

// Momentum and Volume
mom = ta.mom(close, 8)
vol_ma = ta.sma(volume, 15)
high_vol = volume > vol_ma * 1

// Trend Strength
[diplus, diminus, _] = ta.dmi(14, 14)
strong_trend = diplus > 20 or diminus > 20

// Price channels
highest_15 = ta.highest(high, 15)
lowest_15 = ta.lowest(low, 15)
mid_channel = (highest_15 + lowest_15) / 2

// Trend Conditions
uptrend = ema8 > ema21 and close > mid_channel
downtrend = ema8 < ema21 and close < mid_channel

// Entry Conditions
longCondition = uptrend and ta.crossover(ema8, ema21) and rsi_ma > 35 and rsi_ma < 65 and mom > 0 and high_vol and diplus > diminus
shortCondition = downtrend and ta.crossunder(ema8, ema21) and rsi_ma > 35 and rsi_ma < 65 and mom < 0 and high_vol and diminus > diplus

// Dynamic Stop Loss based on ATR
atr = ta.atr(14)
stopSize = atr * 1.3

// Calculate position size based on fixed risk
riskAmount = strategy.initial_capital * 0.05

getLongPosSize(riskAmount, stopSize) => riskAmount / stopSize
getShortPosSize(riskAmount, stopSize) => riskAmount / stopSize

// Monthly drawdown tracking
var float peakEquity = na
var int currentMonth = na
var float monthlyDrawdown = na
maxDrawdownPercent = 10

// Variables for SL and TP
var float stopLoss = na
var float takeProfit = na
var bool inTrade = false
var string tradeType = na

// Reset monthly metrics
monthNow = month(time)
if na(currentMonth) or currentMonth != monthNow
    currentMonth := monthNow
    peakEquity := strategy.equity
    monthlyDrawdown := 0.0

// Update drawdown metrics
peakEquity := math.max(peakEquity, strategy.equity)
monthlyDrawdown := math.max(monthlyDrawdown, (peakEquity - strategy.equity) / peakEquity * 100)

// Trading condition
canTrade = monthlyDrawdown < maxDrawdownPercent

// Entry and Exit Logic
if strategy.position_size == 0
    inTrade := false
    if longCondition and canTrade
        stopLoss := low - stopSize
        takeProfit := close + (stopSize * 2)
        posSize = getLongPosSize(riskAmount, stopSize)
        strategy.entry("Long", strategy.long, qty=posSize)
        strategy.exit("Long Exit", "Long", stop=stopLoss, limit=takeProfit)
        inTrade := true
        tradeType := "long"
    if shortCondition and canTrade
        stopLoss := high + stopSize
        takeProfit := close - (stopSize * 2)
        posSize = getShortPosSize(riskAmount, stopSize)
        strategy.entry("Short", strategy.short, qty=posSize)
        strategy.exit("Short Exit", "Short", stop=stopLoss, limit=takeProfit)
        inTrade := true
        tradeType := "short"

// Plot variables
plotSL = inTrade ? stopLoss : na
plotTP = inTrade ? takeProfit : na

// EMA Plots
plot(ema8, "EMA 8", color=color.blue, linewidth=1)
plot(ema21, "EMA 21", color=color.yellow, linewidth=1)
plot(ema50, "EMA 50", color=color.white, linewidth=1)

// SL and TP Plots
plot(plotSL, "Stop Loss", color=color.red, style=plot.style_linebr, linewidth=1)
plot(plotTP, "Take Profit", color=color.green, style=plot.style_linebr, linewidth=1)

// Signal Plots
plotshape(longCondition and canTrade, "Buy Signal", style=shape.triangleup, location=location.belowbar, color=color.green, size=size.small)
plotshape(shortCondition and canTrade, "Sell Signal", style=shape.triangledown, location=location.abovebar, color=color.red, size=size.small)

// SL/TP Markers with correct y parameter syntax
plot(inTrade ? stopLoss : na, "Stop Loss Level", style=plot.style_circles, color=color.red, linewidth=2)
plot(inTrade ? takeProfit : na, "Take Profit Level", style=plot.style_circles, color=color.green, linewidth=2)

// Background Color
noTradingMonth = monthlyDrawdown >= maxDrawdownPercent
bgcolor(noTradingMonth ? color.new(color.gray, 80) : uptrend ? color.new(color.green, 95) : downtrend ? color.new(color.red, 95) : na)

// Drawdown Label
var label drawdownLabel = na
label.delete(drawdownLabel)
drawdownLabel := label.new(bar_index, high, "Monthly Drawdown: " + str.tostring(monthlyDrawdown, "#.##") + "%\n" + (noTradingMonth ? "NO TRADING" : "TRADING ALLOWED"), style=label.style_label_down, color=noTradingMonth ? color.red : color.green, textcolor=color.white, size=size.small)
Detail
https://www.fmz.com/strategy/481341
Last Modified
2025-02-10 14:20:44