
9.0 KiB
Name
动态成交量均线趋势跟踪与HLCC4突破交易策略-Dynamic-Volume-Weighted-Moving-Average-Trend-Following-with-HLCC4-Breakout-Trading-Strategy
Author
ChaoZhang
Strategy Description
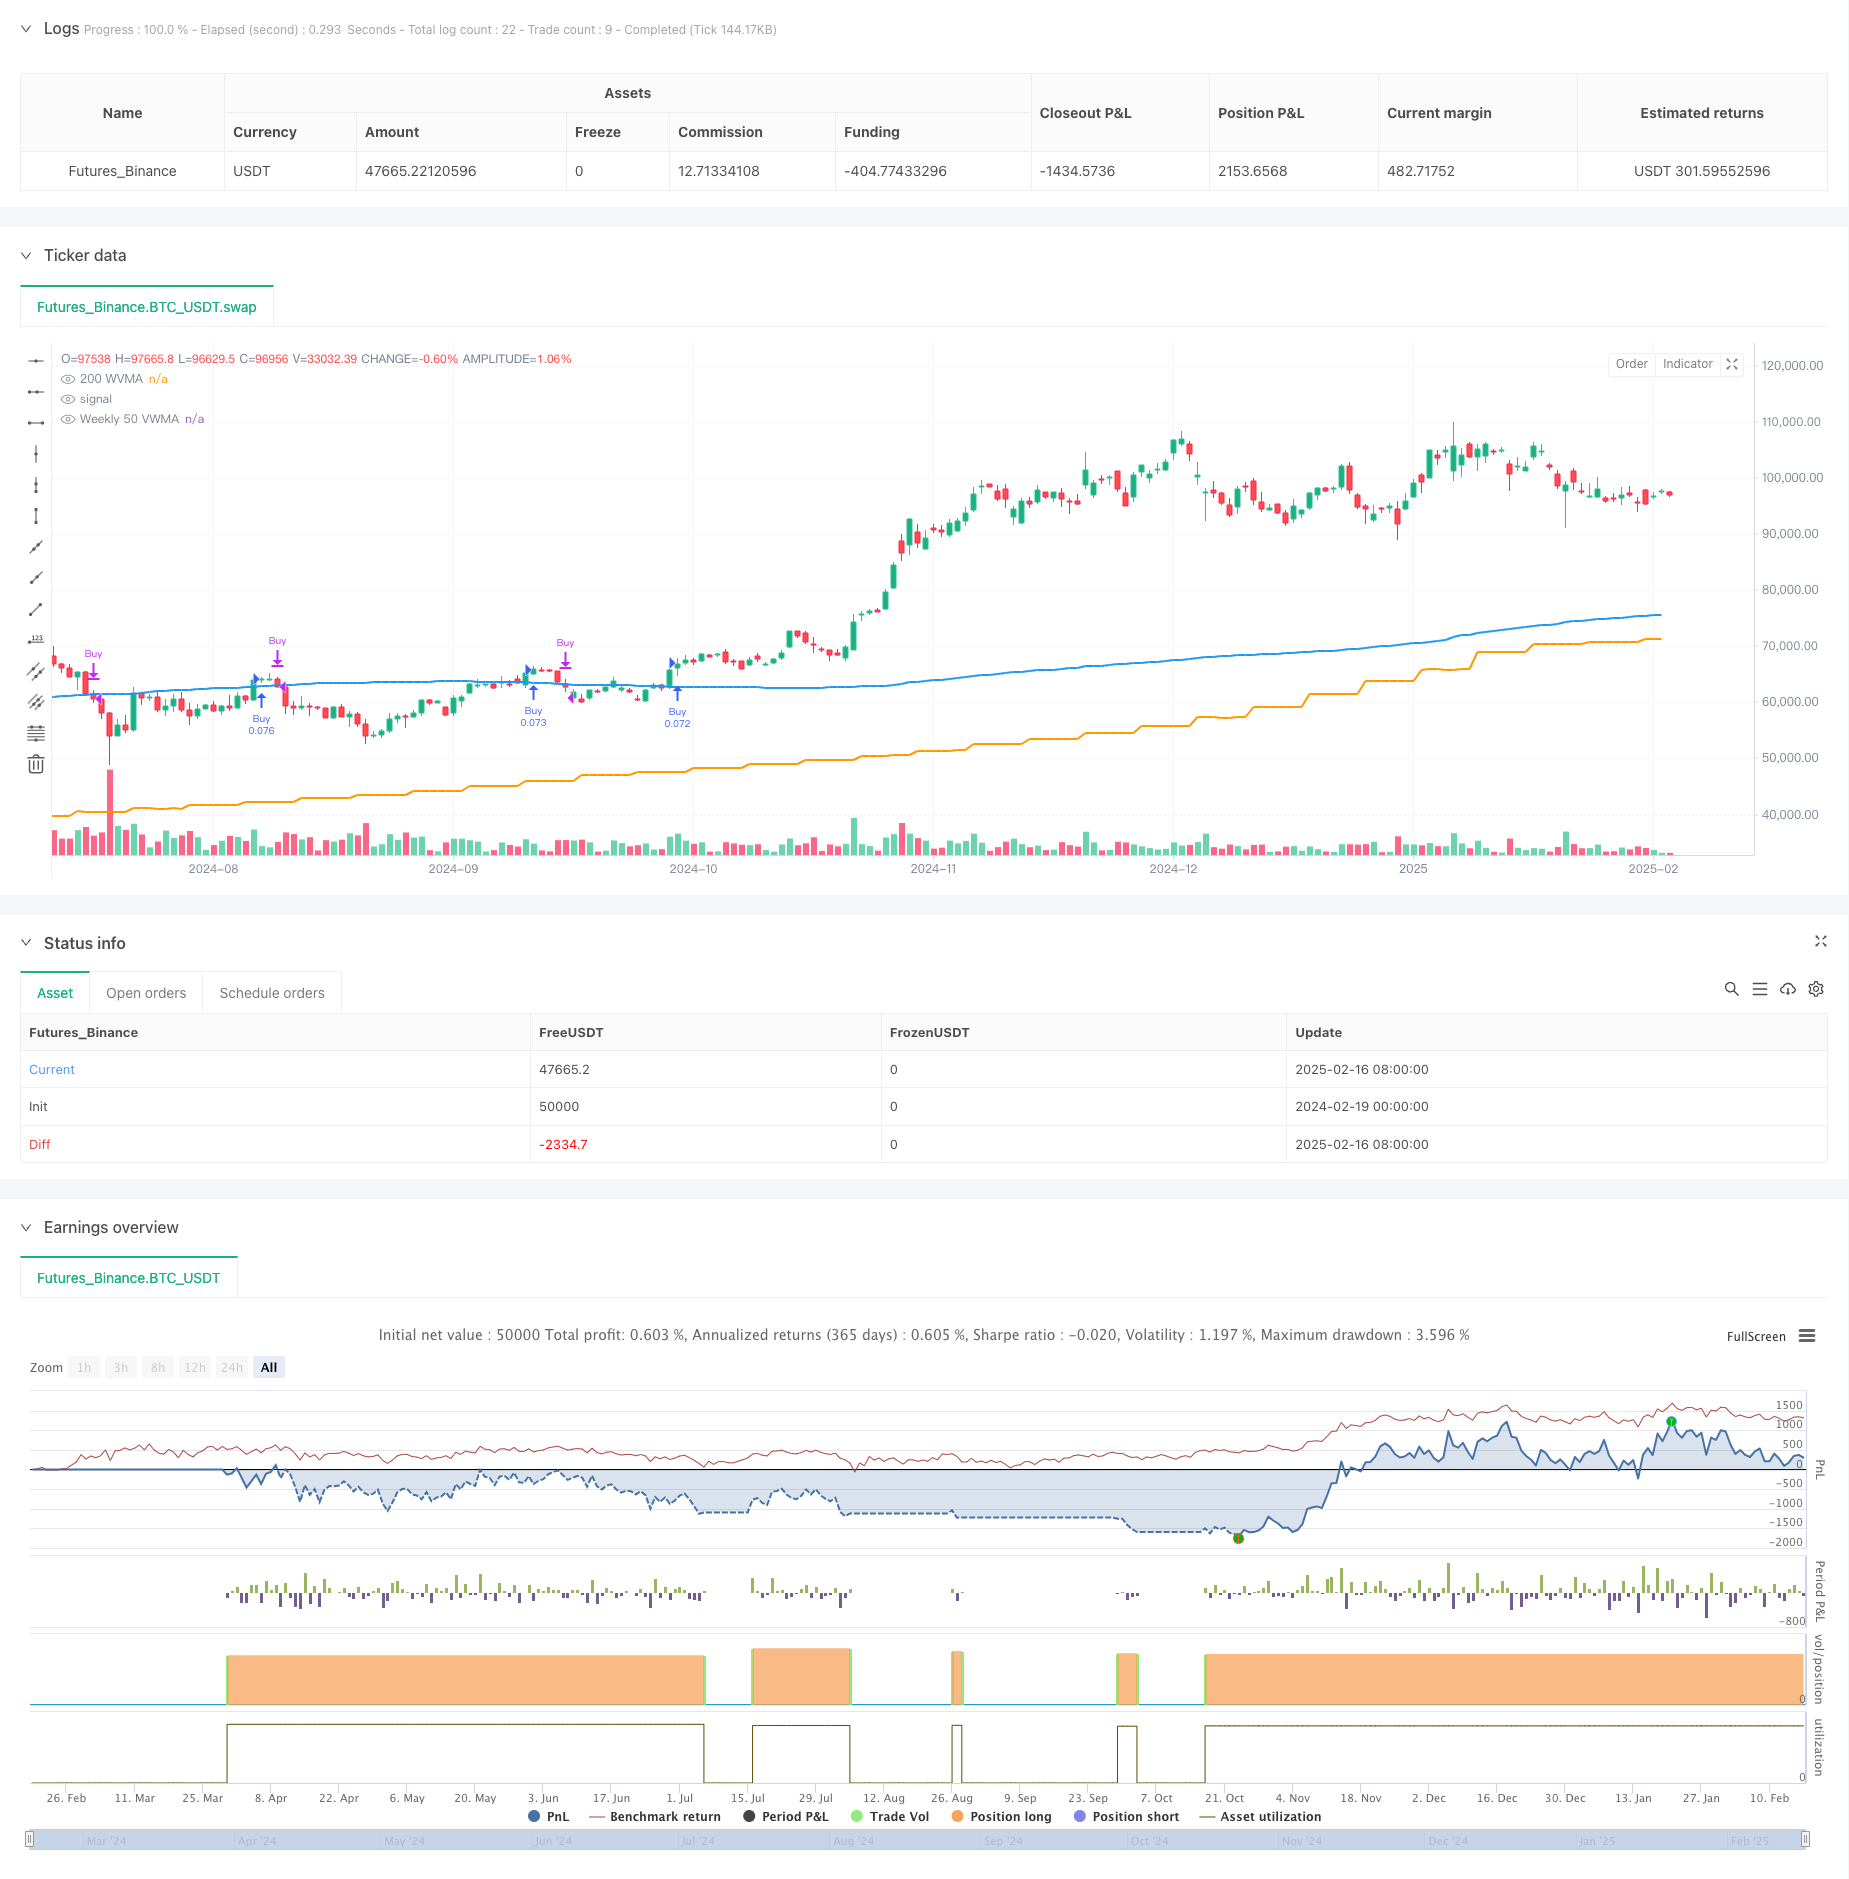
[trans]
概述
该策略是一个基于多重时间周期的趋势跟踪系统,结合了周线50周期成交量加权移动平均线(VWMA)作为大趋势过滤器,并使用当前时间周期的200周期VWMA和HLCC4价格突破作为具体的交易信号。这是一个仅做多的策略,通过严格的趋势确认和多重时间周期验证来提高交易的可靠性。
策略原理
策略的核心逻辑包含以下几个关键环节:
- 使用周线50周期VWMA作为大趋势判断标准,只有当价格位于该均线之上时才允许开仓。
- 入场条件需要满足两个连续K线收盘价都在200周期VWMA之上,并且第二根K线的收盘价要高于第一根K线的HLCC4均价。
- 出场信号基于日线级别,当日线收盘价跌破日线200周期VWMA时平仓。
- 策略采用固定仓位管理方式,每次交易使用账户权益的10%。
- 回测周期限制在最近5年内,确保策略在近期市场环境下的有效性。
策略优势
- 多重时间周期验证:通过周线和日线的配合,既能把握大趋势,又能及时应对市场变化。
- 风险控制完善:使用VWMA替代简单移动平均线,能更好地反映市场的真实走势。
- 趋势确认严谨:要求多重条件同时满足才能入场,降低了假突破的风险。
- 仓位管理合理:固定比例的仓位管理方式既控制了风险,又保持了收益空间。
- 自动化程度高:策略逻辑清晰,可以完全实现自动化交易。
策略风险
- 趋势反转风险:在剧烈的市场波动中,可能会出现较大的回撤。
- 滑点影响:在市场流动性不足时,实际交易价格可能与理论价格有偏差。
- 信号滞后:由于使用了较长周期的均线,策略在趋势转折点的反应可能会相对滞后。
- 假突破风险:虽然有多重确认,但仍可能遇到假突破带来的损失。
- 单向交易限制:策略仅做多,在下跌趋势中会错过潜在的做空机会。
策略优化方向
- 动态参数优化:可以根据市场波动率自动调整VWMA的周期参数。
- 仓位管理优化:引入基于波动率的动态仓位管理系统。
- 出场机制改进:可以添加移动止损或者基于技术指标的动态止损。
- 增加市场情绪指标:结合RSI或MACD等指标来提高信号的可靠性。
- 引入成交量分析:深化对成交量的分析,优化VWMA的计算方法。
总结
这是一个设计严谨的趋势跟踪策略,通过多重时间周期的配合和严格的交易条件,实现了较好的风险控制。策略的核心优势在于其完善的趋势确认机制和清晰的交易逻辑,适合在强势市场中把握中长期趋势性机会。通过建议的优化方向,策略还有进一步提升的空间。 ||
Overview
This strategy is a multi-timeframe trend following system that combines a 50-period Weekly Volume-Weighted Moving Average (VWMA) as a major trend filter, using the 200-period VWMA and HLCC4 price breakout on the current timeframe for specific trading signals. It is a long-only strategy that enhances trading reliability through strict trend confirmation and multi-timeframe validation.
Strategy Principles
The core logic includes several key components:
- Uses the 50-period Weekly VWMA as a major trend criterion, allowing positions only when price is above this moving average.
- Entry conditions require two consecutive closing prices above the 200-period VWMA, with the second candle's close higher than the first candle's HLCC4 average.
- Exit signals are based on the daily timeframe, closing positions when the daily close falls below the daily 200-period VWMA.
- The strategy employs fixed position sizing, using 10% of account equity per trade.
- Backtesting is restricted to the last 5 years to ensure strategy effectiveness in recent market conditions.
Strategy Advantages
- Multi-timeframe validation: Combines weekly and daily timeframes to capture major trends while responding to market changes timely.
- Robust risk control: Uses VWMA instead of simple moving averages for better reflection of true market trends.
- Rigorous trend confirmation: Requires multiple conditions to be met for entry, reducing false breakout risks.
- Rational position management: Fixed proportion position sizing controls risk while maintaining profit potential.
- High automation level: Clear strategy logic enables full automation implementation.
Strategy Risks
- Trend reversal risk: Significant drawdowns may occur during violent market fluctuations.
- Slippage impact: Actual trading prices may deviate from theoretical prices during low liquidity periods.
- Signal lag: Using longer-period moving averages may result in delayed reactions at trend turning points.
- False breakout risk: Despite multiple confirmations, losses from false breakouts are still possible.
- Unidirectional trading limitation: Being long-only, the strategy misses potential short opportunities in downtrends.
Strategy Optimization Directions
- Dynamic parameter optimization: Automatically adjust VWMA periods based on market volatility.
- Position management enhancement: Introduce volatility-based dynamic position sizing system.
- Exit mechanism improvement: Add trailing stops or technical indicator-based dynamic stop losses.
- Market sentiment integration: Incorporate RSI or MACD indicators to improve signal reliability.
- Volume analysis enhancement: Deepen volume analysis and optimize VWMA calculation methods.
Summary
This is a rigorously designed trend following strategy that achieves effective risk control through multi-timeframe coordination and strict trading conditions. Its core advantages lie in its comprehensive trend confirmation mechanism and clear trading logic, suitable for capturing medium to long-term trending opportunities in strong markets. Through the suggested optimization directions, the strategy has room for further improvement.[/trans]
Source (PineScript)
/*backtest
start: 2024-02-19 00:00:00
end: 2025-02-17 00:00:00
period: 1d
basePeriod: 1d
exchanges: [{"eid":"Futures_Binance","currency":"BTC_USDT"}]
*/

//@version=6
strategy("Long-Only 200 WVMA + HLCC4 Strategy (Weekly 50 VWMA Filter, Daily Exit, Last 5 Years)", overlay=true, default_qty_type=strategy.percent_of_equity, default_qty_value=10)

// Parameters
wvma_length = input(200, title="200 WVMA Length")

// Restrict backtesting to the last 5 years
var int backtest_start_year = na
if na(backtest_start_year)
    backtest_start_year = year - 5  // Calculate the start year (5 years ago)

// Check if the current time is within the last 5 years
within_backtest_period = true

// Fetch Weekly 50 VWMA
weekly_vwma_50 = request.security(syminfo.tickerid, "W", ta.vwma(close, 50))

// Basic Condition: Price must be above Weekly 50 VWMA
above_weekly_vwma = (close > weekly_vwma_50)

// 200 Weighted Volume Moving Average (WVMA) on the current timeframe
wvma = ta.vwma(close, wvma_length)
plot(wvma, title="200 WVMA", color=color.blue, linewidth=2)

// HLCC4 Calculation
hlcc4 = (high + low + close + close) / 4

// Fetch Daily 200 WVMA
daily_wvma = request.security(syminfo.tickerid, "D", ta.vwma(close, wvma_length))

// Fetch Daily Close
daily_close = request.security(syminfo.tickerid, "D", close)

// Long Entry Condition
long_condition = (close[1] > wvma[1]) and (close > wvma) and (close > hlcc4[1])

// Long Exit Condition (Daily Close below Daily 200 WVMA)
exit_condition = (daily_close < daily_wvma)

// Check if there is an open position
var bool in_position = false

// Execute trades only within the last 5 years and above Weekly 50 VWMA
if within_backtest_period and above_weekly_vwma
    if (long_condition and not in_position)
        strategy.entry("Buy", strategy.long)
        in_position := true

    if (exit_condition and in_position)
        strategy.close("Buy")
        in_position := false

// Plotting Entry and Exit Signals
plotshape(series=long_condition and not in_position and within_backtest_period and above_weekly_vwma, style=shape.labelup, location=location.belowbar, color=color.green, text="Buy", size=size.small)
plotshape(series=exit_condition and in_position and within_backtest_period and above_weekly_vwma, style=shape.labeldown, location=location.abovebar, color=color.red, text="Exit", size=size.small)

// Highlight background for trend direction
bgcolor(long_condition and not in_position and within_backtest_period and above_weekly_vwma ? color.new(color.green, 90) : na, title="Uptrend Background")
bgcolor(exit_condition and in_position and within_backtest_period and above_weekly_vwma ? color.new(color.red, 90) : na, title="Exit Background")

// Plot Weekly 50 VWMA
plot(weekly_vwma_50, title="Weekly 50 VWMA", color=color.orange, linewidth=2)
Detail
https://www.fmz.com/strategy/482509
Last Modified
2025-02-18 18:12:05