
16 KiB
Name
动态多指标趋势动量优化交易策略-Dynamic-Multi-Indicator-Trend-Momentum-Enhanced-Trading-Strategy
Author
ianzeng123
Strategy Description
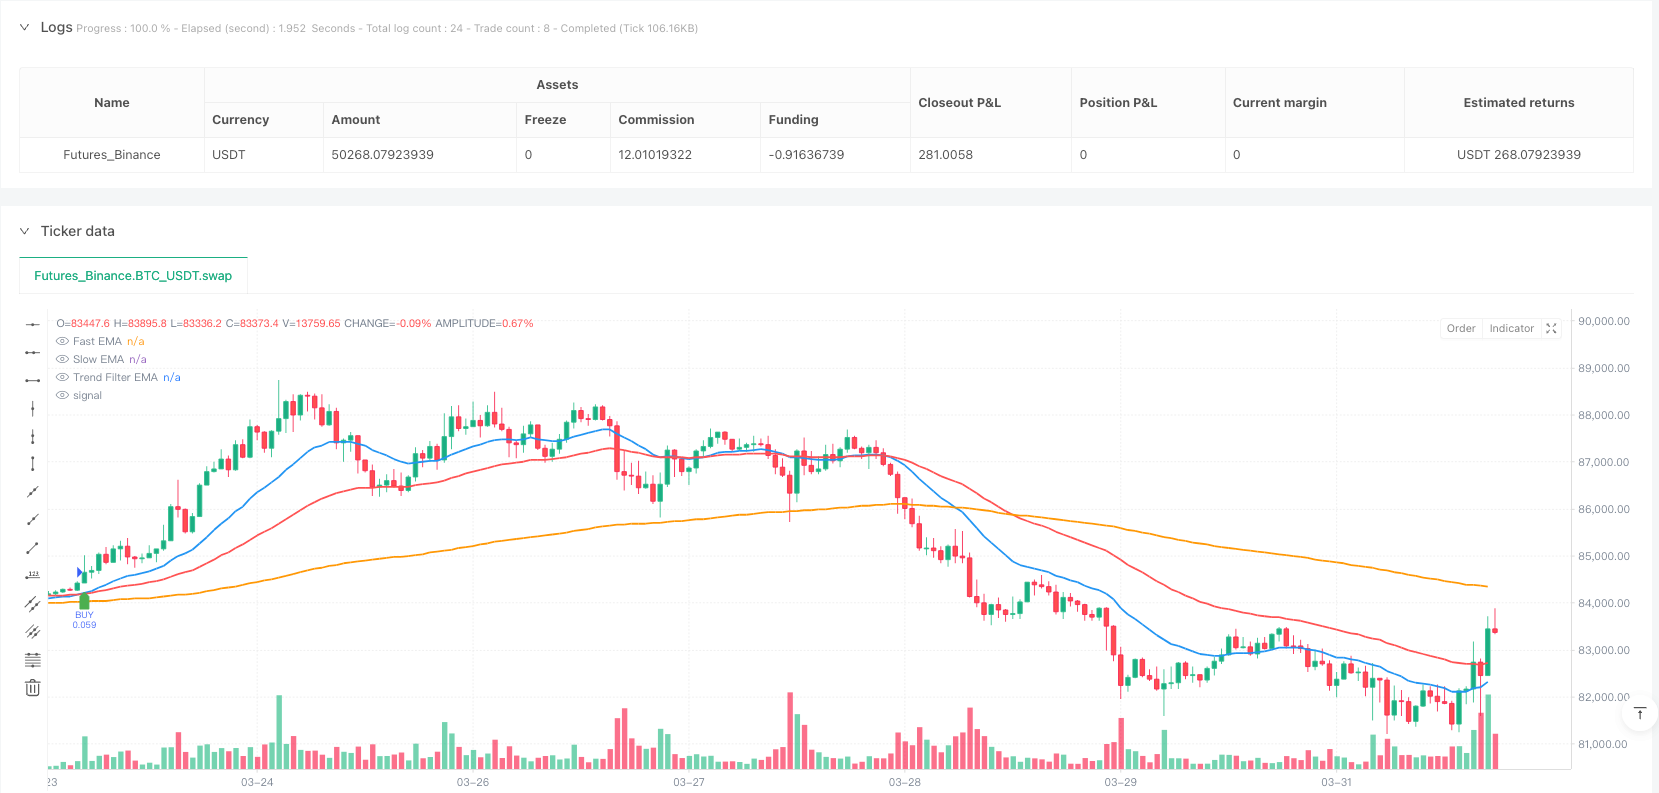
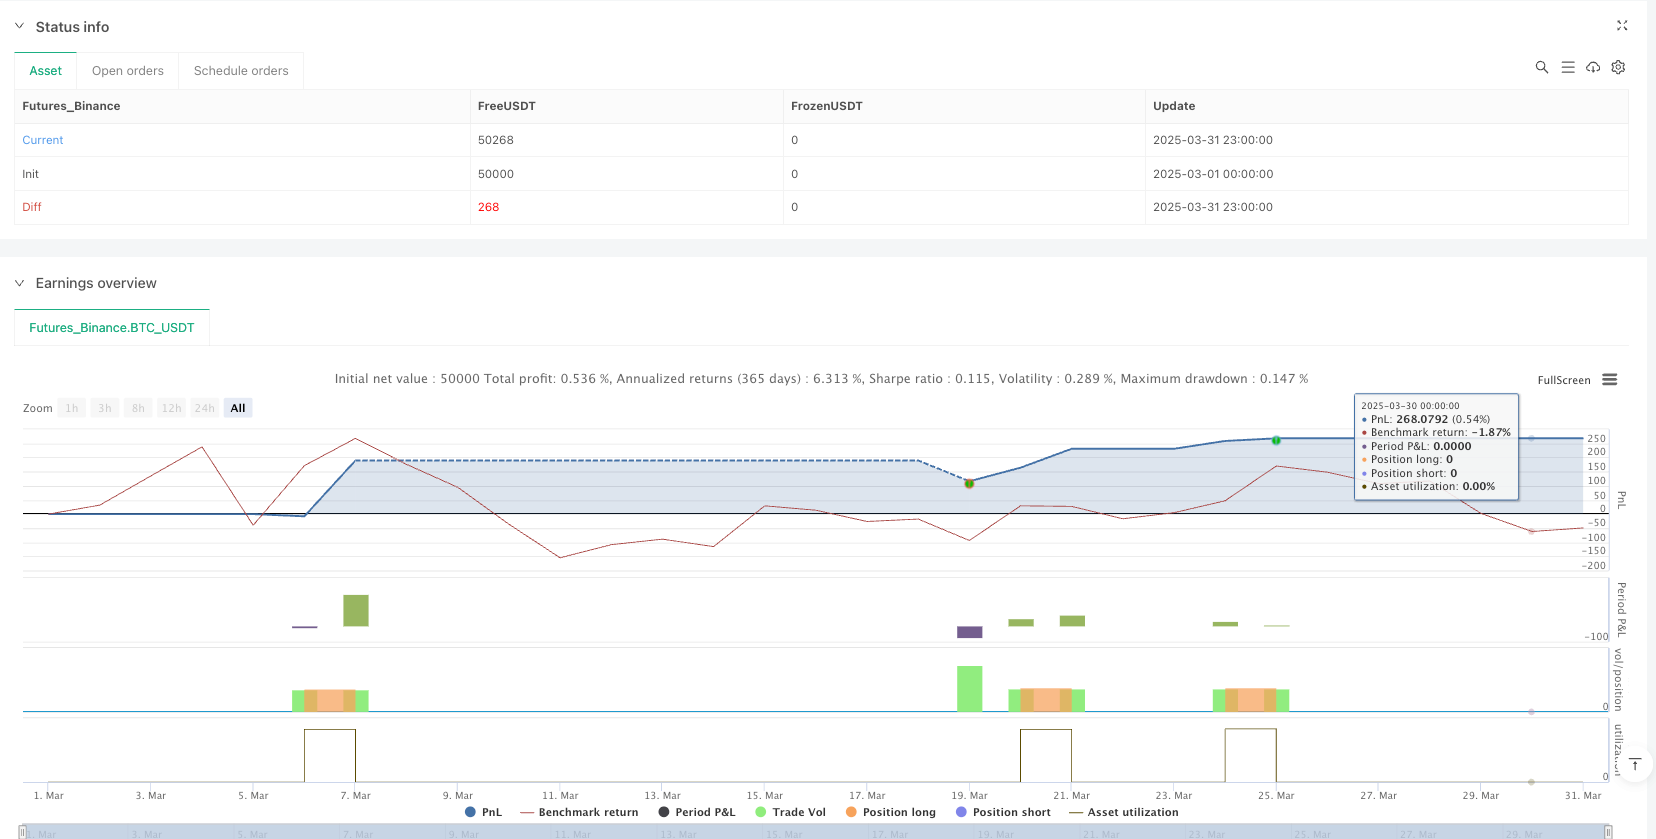
[trans]
策略概述
动态多指标趋势动量优化交易策略是一种结合了技术分析中多种指标的交易系统,旨在捕捉市场趋势并通过动量确认来增强交易信号的可靠性。该策略主要基于指数移动平均线(EMA)交叉来确定入场点,同时使用相对强弱指标(RSI)和移动平均线趋同散度指标(MACD)作为动量确认工具,再配合基于真实波动幅度(ATR)的动态止损以及可调整的风险回报比例,形成一个完整的交易系统。
策略原理
该策略的核心逻辑围绕着多层次的技术指标确认展开:
-
趋势识别:策略使用三条不同周期的指数移动平均线(EMA)——快速EMA(20周期)、慢速EMA(50周期)和趋势过滤EMA(200周期)。快线与慢线的交叉提供主要入场信号,而200周期EMA则确定总体市场趋势方向。
-
动量确认:为避免错误信号,策略结合RSI和MACD指标进行二次确认。在上升趋势中,只有当RSI值大于55且MACD线位于信号线上方时才考虑买入;在下降趋势中,当RSI值小于45且MACD线位于信号线下方时考虑卖出。
-
风险管理:策略采用基于ATR的动态止损机制,通过当前ATR值乘以用户定义的乘数(默认1.5)来设置止损点位,确保止损位置能够适应当前市场波动性。
-
风险回报比:系统允许用户设置理想的风险回报比(默认为1:2),基于止损距离自动计算获利目标。
策略在交易执行上采用明确的条件逻辑:当快速EMA上穿慢速EMA、RSI大于55、MACD线上穿信号线且价格位于200周期EMA上方时,触发买入信号;相反的条件组合则触发卖出信号。同时,每次入场都会设置基于ATR的止损和相应的获利目标。
策略优势
-
多重确认机制:结合趋势和动量指标,策略要求多个技术条件同时满足才会执行交易,大大减少了假信号,提高了交易准确率。
-
适应市场波动性:通过使用ATR作为止损基础,策略能够根据市场当前波动情况动态调整止损距离,在波动较大时提供更宽松的止损空间,在波动较小时收紧止损保护利润。
-
灵活的风险控制:用户可以根据自己的风险偏好调整ATR乘数和风险回报比,实现个性化的风险管理策略,适合不同的交易风格。
-
趋势过滤:使用200周期EMA作为总体趋势指标,确保策略只在趋势明确的方向上开仓,避免在盘整市场中频繁交易。
-
可视化交易结果:策略内置了回测结果显示功能,可以实时查看交易次数、盈亏次数及总体盈利情况,便于策略评估和优化。
策略风险
-
滞后风险:所有基于移动平均线的策略都存在一定的滞后性,可能导致入场点不够理想,尤其是在快速转向的市场中。解决方法是考虑调整EMA参数或增加价格行为分析来优化入场时机。
-
假突破风险:尽管使用了多重确认机制,但市场仍可能出现假突破情况,导致止损触发。建议考虑增加成交量确认或使用波动率过滤器来减少这类风险。
-
参数敏感性:策略性能对参数设置较为敏感,特别是EMA周期和ATR乘数的选择。建议在不同市场环境下进行广泛回测,找到最稳定的参数组合。
-
趋势反转风险:在强烈的趋势反转情况下,策略可能无法快速适应,导致较大回撤。可以考虑增加趋势强度指标或波动率突变检测来提前识别可能的反转信号。
-
过度交易风险:在横盘市场中,EMA交叉可能频繁出现,即使有RSI和MACD过滤,仍可能导致过度交易。建议增加交易频率限制或横盘市场识别功能来避免此类情况。
策略优化方向
-
增加成交量确认:当前策略仅基于价格衍生指标进行决策,缺乏成交量维度的确认。建议增加成交量指标如OBV(On-Balance Volume)或成交量加权移动平均线(VWMA)来增强信号可靠性,因为健康的趋势通常伴随着相应的成交量支持。
-
优化趋势识别机制:可以考虑添加自适应移动平均线或引入趋势强度指标如ADX(平均方向指数),以便更准确地识别趋势强度和方向,避免在弱趋势或横盘市场中频繁交易。
-
引入市场状态分类:开发市场状态识别算法,将市场分为趋势、盘整和高波动等不同状态,针对不同状态使用差异化的参数设置或交易策略,提高策略的适应性。
-
止盈策略优化:当前策略使用固定的风险回报比来设置止盈点,可以考虑引入尾随止盈(Trailing Stop)或基于支撑/阻力位的动态止盈,以在强趋势中捕获更多利润。
-
优化入场时机:考虑在EMA交叉信号触发后,增加价格回调确认或等待小时级别确认,以获得更优的入场价格,减少即时反转的风险。
-
增加时间框架确认:实现多时间框架分析功能,要求更大时间框架的趋势方向与交易方向一致,增加交易的成功概率。
总结
动态多指标趋势动量优化交易策略通过整合趋势跟踪、动量确认和动态风险管理,形成了一个相对完整的交易系统。策略使用EMA交叉作为主要入场信号,RSI和MACD作为动量确认,同时利用ATR基础的止损和可调整的风险回报比来管理每笔交易的风险。
该策略在趋势明确的市场中表现较好,但在横盘或高波动市场环境中可能面临挑战。通过增加成交量确认、优化趋势识别、引入市场状态分类、完善止盈策略以及实现多时间框架分析等方向的优化,可以进一步提升策略的适应性和稳定性。
最终,这种融合了多种技术指标和风险管理技术的策略,为交易者提供了一个可靠的框架,不仅可以捕捉市场趋势,还能有效控制每笔交易的风险,适合中长期的趋势跟踪交易。 ||
Strategy Overview
The Dynamic Multi-Indicator Trend-Momentum Enhanced Trading Strategy is a trading system that combines multiple technical analysis indicators to capture market trends and enhance signal reliability through momentum confirmation. This strategy primarily uses Exponential Moving Average (EMA) crossovers to determine entry points, while employing the Relative Strength Index (RSI) and Moving Average Convergence Divergence (MACD) as momentum confirmation tools. It also incorporates Average True Range (ATR)-based dynamic stop-losses and an adjustable risk-reward ratio to form a comprehensive trading system.
Strategy Principles
The core logic of this strategy revolves around multi-layered technical indicator confirmation:
-
Trend Identification: The strategy employs three different period EMAs—a fast EMA (20-period), a slow EMA (50-period), and a trend filter EMA (200-period). The crossover of the fast and slow lines provides the primary entry signal, while the 200-period EMA determines the overall market trend direction.
-
Momentum Confirmation: To avoid false signals, the strategy incorporates RSI and MACD indicators for secondary confirmation. In an uptrend, buy signals are only considered when the RSI is above 55 and the MACD line is above the signal line; in a downtrend, sell signals are considered when the RSI is below 45 and the MACD line is below the signal line.
-
Risk Management: The strategy adopts an ATR-based dynamic stop-loss mechanism, setting the stop-loss point by multiplying the current ATR value by a user-defined multiplier (default 1.5), ensuring that the stop-loss position adapts to current market volatility.
-
Risk-Reward Ratio: The system allows users to set their desired risk-reward ratio (default 1:2), automatically calculating profit targets based on the stop-loss distance.
The strategy executes trades based on clear conditional logic: a buy signal is triggered when the fast EMA crosses above the slow EMA, the RSI is above 55, the MACD line crosses above the signal line, and the price is above the 200-period EMA. The opposite combination of conditions triggers a sell signal. Each entry is accompanied by an ATR-based stop-loss and corresponding profit target.
Strategy Advantages
-
Multiple Confirmation Mechanisms: By combining trend and momentum indicators, the strategy requires multiple technical conditions to be met simultaneously before executing a trade, greatly reducing false signals and improving trading accuracy.
-
Adapting to Market Volatility: By using ATR as the basis for stop-losses, the strategy can dynamically adjust stop-loss distances based on current market volatility, providing more room for stop-losses in highly volatile markets and tightening protection in less volatile ones.
-
Flexible Risk Control: Users can adjust the ATR multiplier and risk-reward ratio according to their risk preferences, implementing personalized risk management strategies suitable for different trading styles.
-
Trend Filtering: Using the 200-period EMA as an overall trend indicator ensures that the strategy only opens positions in clearly defined trend directions, avoiding frequent trading in range-bound markets.
-
Visualization of Trading Results: The strategy includes built-in backtest result display functionality, allowing real-time viewing of trade counts, win/loss records, and overall profitability, facilitating strategy evaluation and optimization.
Strategy Risks
-
Lag Risk: All strategies based on moving averages have a certain amount of lag, which may lead to less than ideal entry points, especially in rapidly reversing markets. The solution is to consider adjusting EMA parameters or adding price action analysis to optimize entry timing.
-
False Breakout Risk: Despite using multiple confirmation mechanisms, the market may still experience false breakouts, triggering stop-losses. Consider adding volume confirmation or using volatility filters to reduce this type of risk.
-
Parameter Sensitivity: Strategy performance is sensitive to parameter settings, especially the choice of EMA periods and ATR multiplier. It's advisable to conduct extensive backtesting in different market environments to find the most stable parameter combinations.
-
Trend Reversal Risk: In strong trend reversal situations, the strategy may not adapt quickly enough, leading to significant drawdowns. Consider adding trend strength indicators or volatility change detection to identify potential reversal signals in advance.
-
Overtrading Risk: In range-bound markets, EMA crossovers may occur frequently, potentially leading to overtrading even with RSI and MACD filtering. Consider adding trading frequency limitations or range-bound market identification functions to avoid such situations.
Strategy Optimization Directions
-
Add Volume Confirmation: The current strategy makes decisions based solely on price-derived indicators, lacking confirmation from the volume dimension. Consider adding volume indicators such as On-Balance Volume (OBV) or Volume-Weighted Moving Average (VWMA) to enhance signal reliability, as healthy trends are typically supported by corresponding volume.
-
Optimize Trend Identification Mechanism: Consider adding adaptive moving averages or introducing trend strength indicators such as Average Directional Index (ADX) to more accurately identify trend strength and direction, avoiding frequent trading in weak trend or range-bound markets.
-
Introduce Market State Classification: Develop a market state recognition algorithm to classify the market into different states such as trending, ranging, and high volatility, and use differentiated parameter settings or trading strategies for different states to improve the strategy's adaptability.
-
Optimize Take Profit Strategy: The current strategy uses a fixed risk-reward ratio to set take profit points. Consider introducing trailing stops or dynamic take profit based on support/resistance levels to capture more profit in strong trends.
-
Optimize Entry Timing: Consider adding price pullback confirmation or waiting for hourly-level confirmation after EMA crossover signals to obtain better entry prices and reduce the risk of immediate reversal.
-
Add Timeframe Confirmation: Implement multi-timeframe analysis, requiring the trend direction of larger timeframes to be consistent with the trading direction, increasing the probability of successful trades.
Summary
The Dynamic Multi-Indicator Trend-Momentum Enhanced Trading Strategy forms a relatively complete trading system by integrating trend following, momentum confirmation, and dynamic risk management. The strategy uses EMA crossovers as the primary entry signal, RSI and MACD as momentum confirmation, and ATR-based stop-losses with an adjustable risk-reward ratio to manage the risk of each trade.
This strategy performs well in clearly trending markets but may face challenges in range-bound or highly volatile market environments. By adding volume confirmation, optimizing trend identification, introducing market state classification, improving take profit strategies, and implementing multi-timeframe analysis, the strategy's adaptability and stability can be further enhanced.
Ultimately, this strategy, which combines multiple technical indicators and risk management techniques, provides traders with a reliable framework that not only captures market trends but also effectively controls the risk of each trade, making it suitable for medium to long-term trend following trading.[/trans]
Source (PineScript)
/*backtest
start: 2025-03-01 00:00:00
end: 2025-03-31 23:59:59
period: 1h
basePeriod: 1h
exchanges: [{"eid":"Futures_Binance","currency":"BTC_USDT"}]
*/

//@version=5
strategy("High-Win Trend & Momentum Strategy", overlay=true, default_qty_type=strategy.percent_of_equity, default_qty_value=10)

// === INPUT PARAMETERS ===
ema_fast_length = input(20, title="Fast EMA Length")
ema_slow_length = input(50, title="Slow EMA Length")
ema_trend_filter = input(200, title="Trend Filter EMA")
atr_length = input(14, title="ATR Length for Stop-Loss")
risk_reward_ratio = input(2, title="Risk-Reward Ratio (1:X)")
atr_multiplier = input(1.5, title="ATR Multiplier for Stop-Loss")

// === CALCULATE INDICATORS ===
ema_fast = ta.ema(close, ema_fast_length)
ema_slow = ta.ema(close, ema_slow_length)
ema_200 = ta.ema(close, ema_trend_filter)
rsi = ta.rsi(close, 14)
macd_line = ta.ema(close, 12) - ta.ema(close, 26)
signal_line = ta.ema(macd_line, 9)
atr = ta.atr(atr_length)

// === TREND & MOMENTUM CONDITIONS ===
is_uptrend = close > ema_200
is_downtrend = close < ema_200

// === ENTRY CONDITIONS ===
buy_condition = ta.crossover(ema_fast, ema_slow) and rsi > 55 and macd_line > signal_line and is_uptrend
sell_condition = ta.crossunder(ema_fast, ema_slow) and rsi < 45 and macd_line < signal_line and is_downtrend

// === ATR-BASED STOP-LOSS & TAKE-PROFIT ===
stop_loss = close - (atr * atr_multiplier)
take_profit = close + ((close - stop_loss) * risk_reward_ratio)

// === EXECUTE TRADES ===
if buy_condition
    strategy.entry("BUY", strategy.long)
    strategy.exit("TP/SL", from_entry="BUY", stop=stop_loss, limit=take_profit)

// === PLOT INDICATORS ===
plot(ema_fast, title="Fast EMA", color=color.blue, linewidth=2)
plot(ema_slow, title="Slow EMA", color=color.red, linewidth=2)
plot(ema_200, title="Trend Filter EMA", color=color.orange, linewidth=2)

// === PLOT BUY/SELL SIGNALS ===
plotshape(series=buy_condition, location=location.belowbar, color=color.green, style=shape.labelup, size=size.small, title="BUY")
plotshape(series=sell_condition, location=location.abovebar, color=color.red, style=shape.labeldown, size=size.small, title="SELL")
Detail
https://www.fmz.com/strategy/489041
Last Modified
2025-04-01 14:41:16