
8.2 KiB
Name
动态多指标优化趋势追踪策略-Dynamic-Multi-Indicator-Optimized-Trend-Following-Strategy
Author
ianzeng123
Strategy Description
[trans]
概述
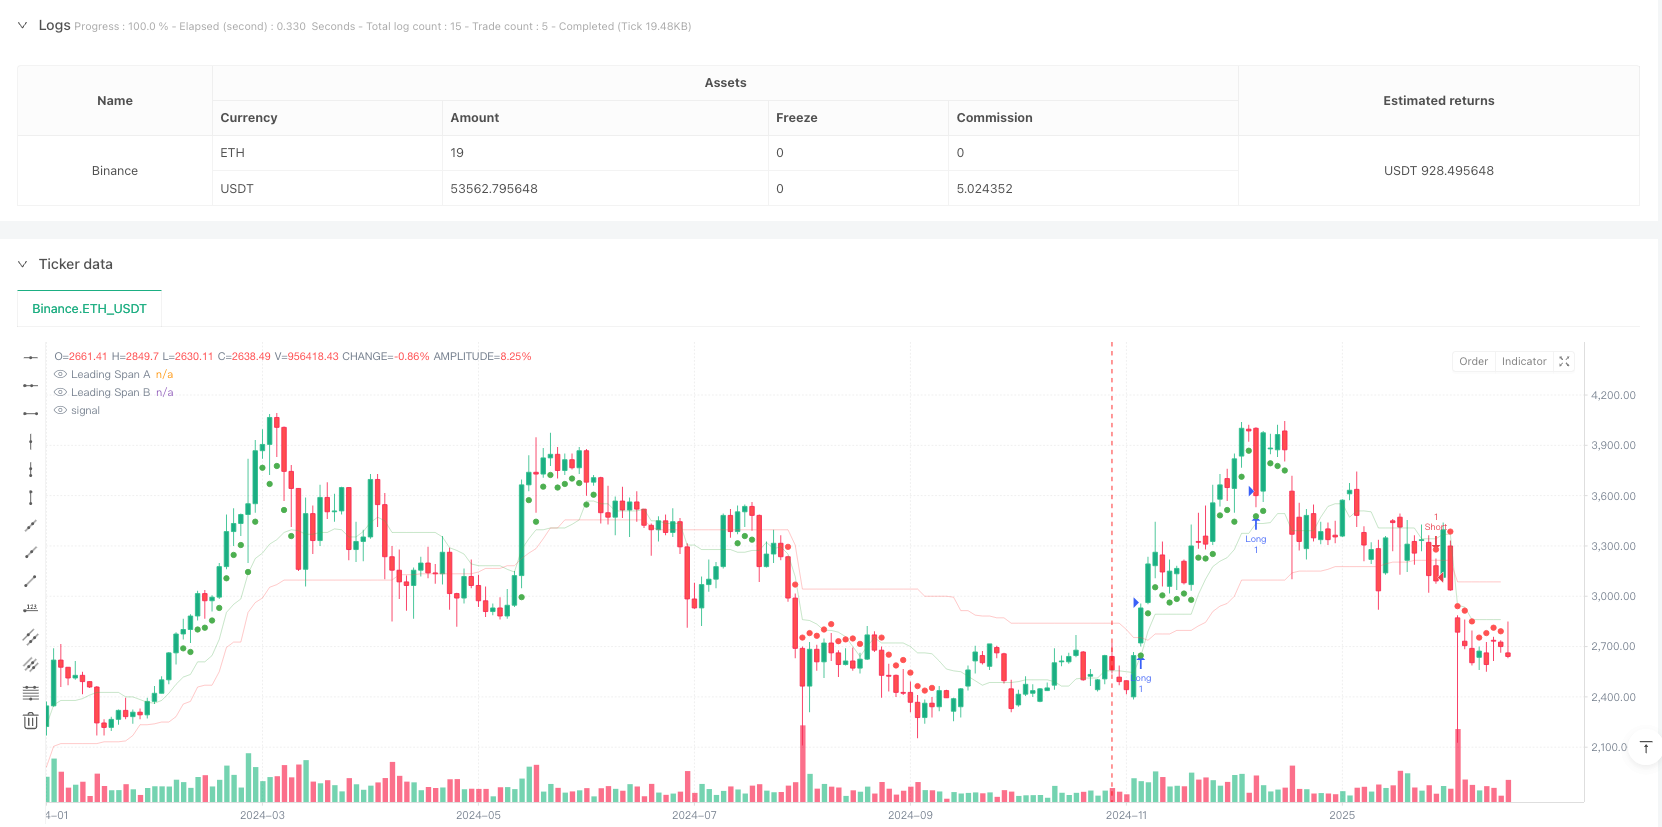
该策略是一个多指标融合的趋势追踪交易系统,结合了市场趋势、动量和波动率三个维度的分析。核心逻辑是通过一云指标(Ichimoku Cloud)判断市场趋势,MACD直方图确认动量,布林带宽度(Bollinger Band Width)过滤市场波动状态,同时引入周线级别趋势确认机制,最后通过基于ATR的动态止损来管理风险。
策略原理
策略采用多层信号过滤机制:首先通过一云指标的领先跨度A和B判断价格是否处于云层之上或之下,确定市场大趋势;其次使用MACD直方图判断动量强度,要求多头时直方图大于-0.05,空头时小于0;第三引入周线时间周期的50周期均线来确认更大级别趋势方向;第四使用布林带宽度指标过滤低波动率行情,只在宽度大于0.02时开仓。止损设置上,根据市场波动状态自适应:在低波动时使用前期高低点,高波动时使用ATR倍数。
策略优势
- 多维度信号过滤:通过趋势、动量和波动率三个维度的指标组合,有效降低虚假信号。
- 多时间周期分析:引入周线趋势确认,提高交易方向的准确性。
- 动态风险管理:基于ATR和布林带宽度的自适应止损机制,既保护盈利又给予趋势发展空间。
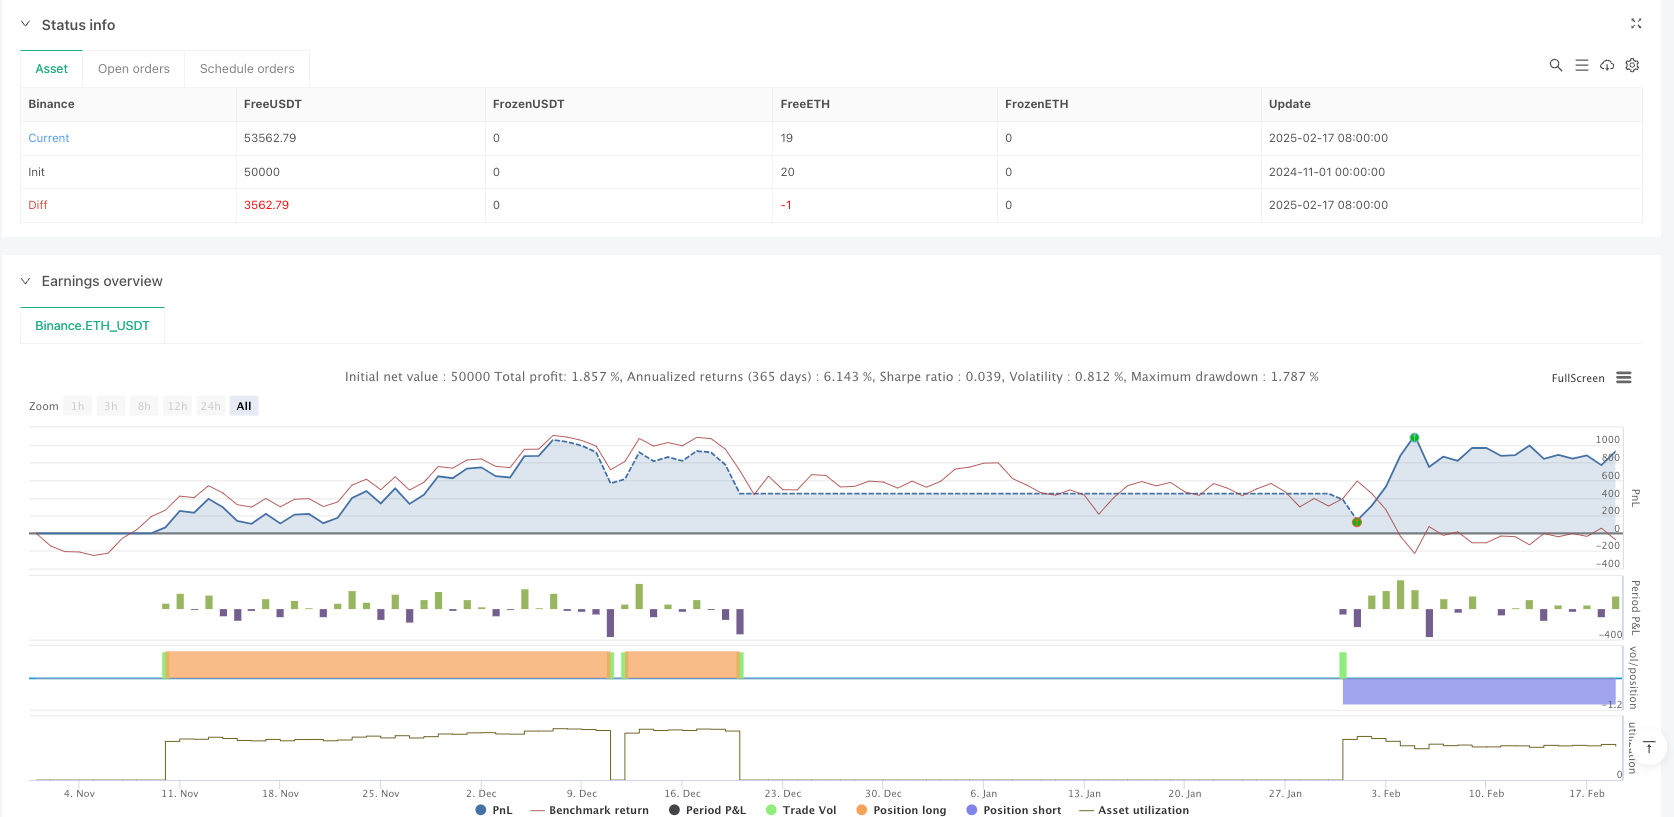
- 回测效果优秀:净利润10.80%,盈亏比2.593,胜率50.70%,最大回撤仅1.47%。
策略风险
- 趋势依赖性:策略在震荡市场可能产生频繁虚假信号。
- 参数敏感性:多个指标参数需要针对不同市场条件进行优化。
- 滞后性风险:多重信号过滤可能导致入场时机偏后,错失部分行情。
- 回测局限性:历史业绩不代表未来表现,实盘还需考虑滑点和手续费。
策略优化方向
- 信号系统优化:可引入RSI等其他动量指标,增强信号可靠性。
- 仓位管理优化:可基于波动率动态调整仓位大小。
- 止盈机制优化:可增加移动止损或基于技术指标的止盈条件。
- 市场适应性优化:针对不同市场状态动态调整参数。
总结
该策略通过多维度指标融合和多时间周期分析构建了一个完整的趋势追踪系统,并配备了动态风险管理机制。虽然回测表现优秀,但仍需注意市场环境变化带来的风险,建议在实盘中谨慎验证并持续优化。 ||
Overview
This strategy is a multi-indicator trend following trading system that combines analysis across three dimensions: market trend, momentum, and volatility. The core logic uses the Ichimoku Cloud to determine market trends, MACD histogram for momentum confirmation, Bollinger Band Width for market volatility filtering, while incorporating weekly timeframe trend confirmation, and managing risk through ATR-based dynamic stop-loss.
Strategy Principles
The strategy employs a multi-layer signal filtering mechanism: First, it determines the market trend by checking if price is above or below the Ichimoku Cloud's Leading Spans A and B; Second, it uses the MACD histogram to judge momentum strength, requiring the histogram to be greater than -0.05 for longs and less than 0 for shorts; Third, it incorporates a 50-period moving average on the weekly timeframe to confirm higher timeframe trend direction; Fourth, it uses Bollinger Band Width to filter low volatility conditions, only entering trades when the width exceeds 0.02. Stop-loss settings adapt to market volatility: using recent highs/lows in low volatility and ATR multipliers in high volatility conditions.
Strategy Advantages
- Multi-dimensional signal filtering: Effectively reduces false signals through combination of trend, momentum, and volatility indicators.
- Multi-timeframe analysis: Incorporates weekly trend confirmation to improve directional accuracy.
- Dynamic risk management: Adaptive stop-loss mechanism based on ATR and Bollinger Band Width that both protects profits and gives trends room to develop.
- Excellent backtesting results: Net profit 10.80%, profit factor 2.593, win rate 50.70%, maximum drawdown only 1.47%.
Strategy Risks
- Trend dependency: Strategy may generate frequent false signals in ranging markets.
- Parameter sensitivity: Multiple indicator parameters need optimization for different market conditions.
- Lag risk: Multiple signal filters may lead to delayed entries, missing part of the move.
- Backtesting limitations: Historical performance doesn't guarantee future results, live trading needs to consider slippage and fees.
Strategy Optimization Directions
- Signal system optimization: Can introduce other momentum indicators like RSI to enhance signal reliability.
- Position management optimization: Can dynamically adjust position size based on volatility.
- Take-profit optimization: Can add trailing stops or technical indicator-based profit targets.
- Market adaptability optimization: Dynamically adjust parameters for different market conditions.
Summary
The strategy builds a complete trend following system through multi-dimensional indicator fusion and multi-timeframe analysis, equipped with dynamic risk management mechanisms. While backtesting performance is excellent, attention must be paid to risks from changing market environments, and it's recommended to carefully validate and continuously optimize in live trading.[/trans]
Source (PineScript)
/*backtest
start: 2024-11-01 00:00:00
end: 2025-02-19 08:00:00
period: 2d
basePeriod: 2d
exchanges: [{"eid":"Binance","currency":"ETH_USDT"}]
*/

// This Pine Script™ code is subject to the terms of the Mozilla Public License 2.0 at https://mozilla.org/MPL/2.0/
// © FIWB
//@version=6
strategy("Momentum Edge Strategy - 1D BTC Optimized", overlay=true)

// --- Input Parameters ---
atrLength     = input.int(14, title="ATR Length")
atrMultiplier = input.float(1.5, title="ATR Multiplier")
bbWidthThreshold = input.float(0.02, title="Bollinger Band Width Threshold")

// --- Ichimoku Cloud ---
conversionLine = (ta.highest(high, 9) + ta.lowest(low, 9)) / 2
baseLine = (ta.highest(high, 26) + ta.lowest(low, 26)) / 2
leadingSpanA = (conversionLine + baseLine) / 2
leadingSpanB = (ta.highest(high, 52) + ta.lowest(low, 52)) / 2
priceAboveCloud = close > leadingSpanA and close > leadingSpanB
priceBelowCloud = close < leadingSpanA and close < leadingSpanB

// --- MACD Histogram ---
[_, _, macdHistogram] = ta.macd(close, 12, 26, 9)

// --- Multi-Timeframe Trend Confirmation ---
higherTFTrend = request.security(syminfo.tickerid, "W", close > ta.sma(close, 50))

// --- Bollinger Band Width ---
bbBasis = ta.sma(close, 20)
bbUpper = bbBasis + 2 * ta.stdev(close, 20)
bbLower = bbBasis - 2 * ta.stdev(close, 20)
bbWidth = (bbUpper - bbLower) / bbBasis

// --- ATR-based Stop Loss ---
atrValue     = ta.atr(atrLength)
highestHigh = ta.highest(high, atrLength)
lowestLow = ta.lowest(low, atrLength)
longStopLoss = bbWidth < bbWidthThreshold ? lowestLow : close - atrValue * atrMultiplier
shortStopLoss= bbWidth < bbWidthThreshold ? highestHigh : close + atrValue * atrMultiplier

// --- Entry Conditions ---
longCondition = priceAboveCloud and macdHistogram > -0.05 and higherTFTrend and bbWidth > bbWidthThreshold
shortCondition = priceBelowCloud and macdHistogram < 0 and not higherTFTrend and bbWidth > bbWidthThreshold

// --- Strategy Execution ---
if longCondition
    strategy.entry("Long", strategy.long)
    strategy.exit("Exit Long", from_entry="Long", stop=longStopLoss)

if shortCondition
    strategy.entry("Short", strategy.short)
    strategy.exit("Exit Short", from_entry="Short", stop=shortStopLoss)

// --- Plotting ---
plot(leadingSpanA, color=color.new(color.green, 80), title="Leading Span A")
plot(leadingSpanB, color=color.new(color.red, 80), title="Leading Span B")
plotshape(series=longCondition ? close : na, title="Long Signal", location=location.belowbar, color=color.green)
plotshape(series=shortCondition ? close : na, title="Short Signal", location=location.abovebar, color=color.red)
Detail
https://www.fmz.com/strategy/483044
Last Modified
2025-02-21 10:46:28