
8.1 KiB
Name
动态多周期趋势预测结合移动均线过滤策略-Dynamic-Multi-Period-Trend-Prediction-with-Moving-Average-Filter-Strategy
Author
ianzeng123
Strategy Description
[trans]
概述
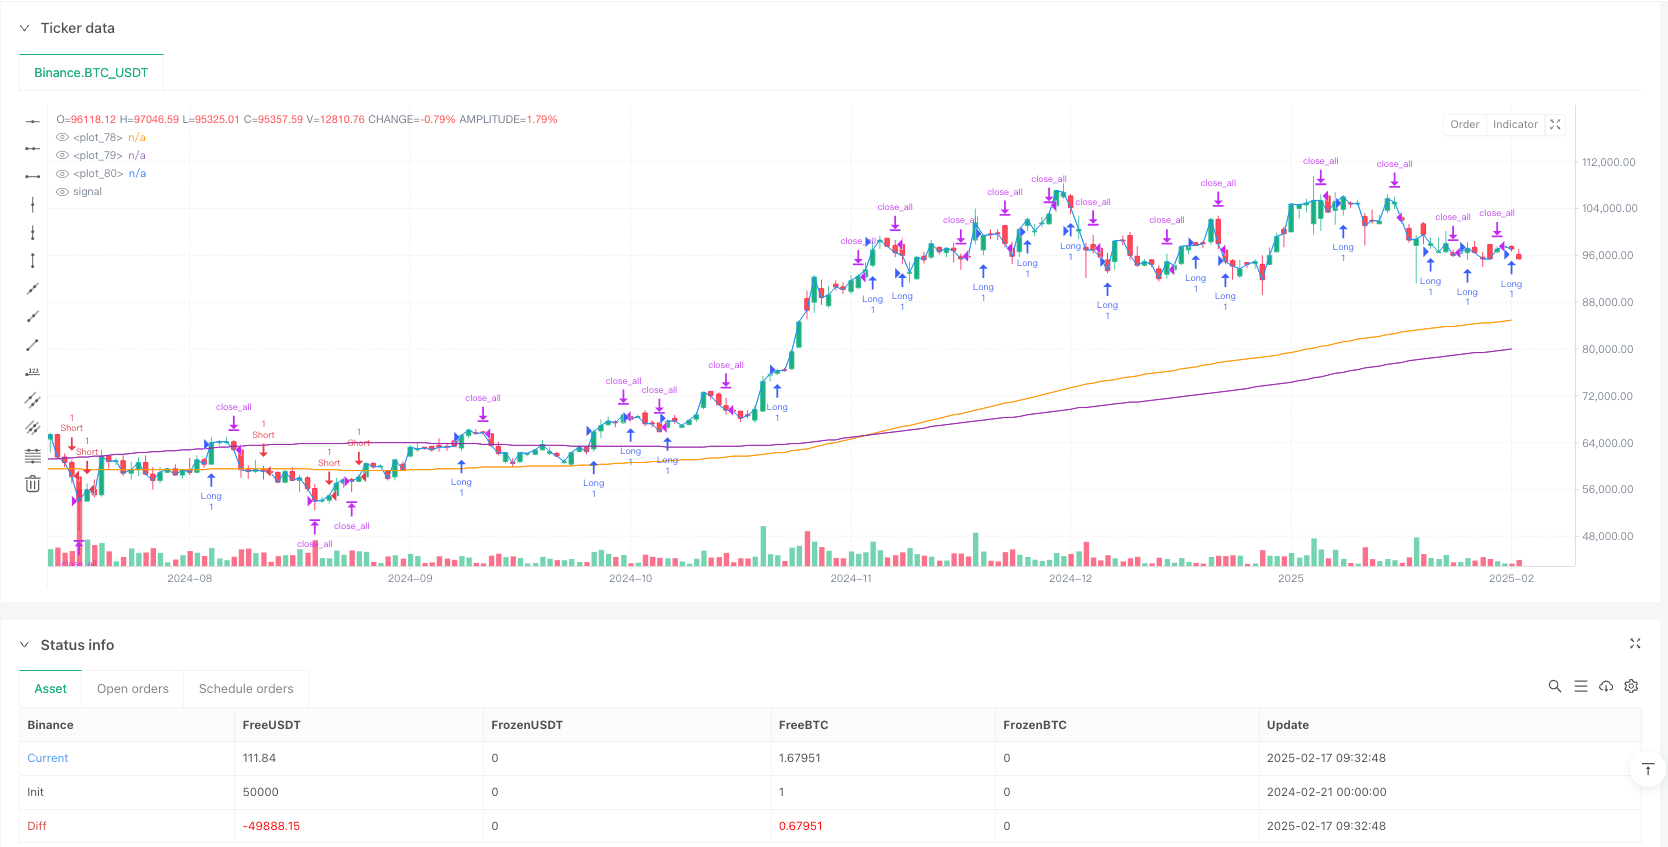
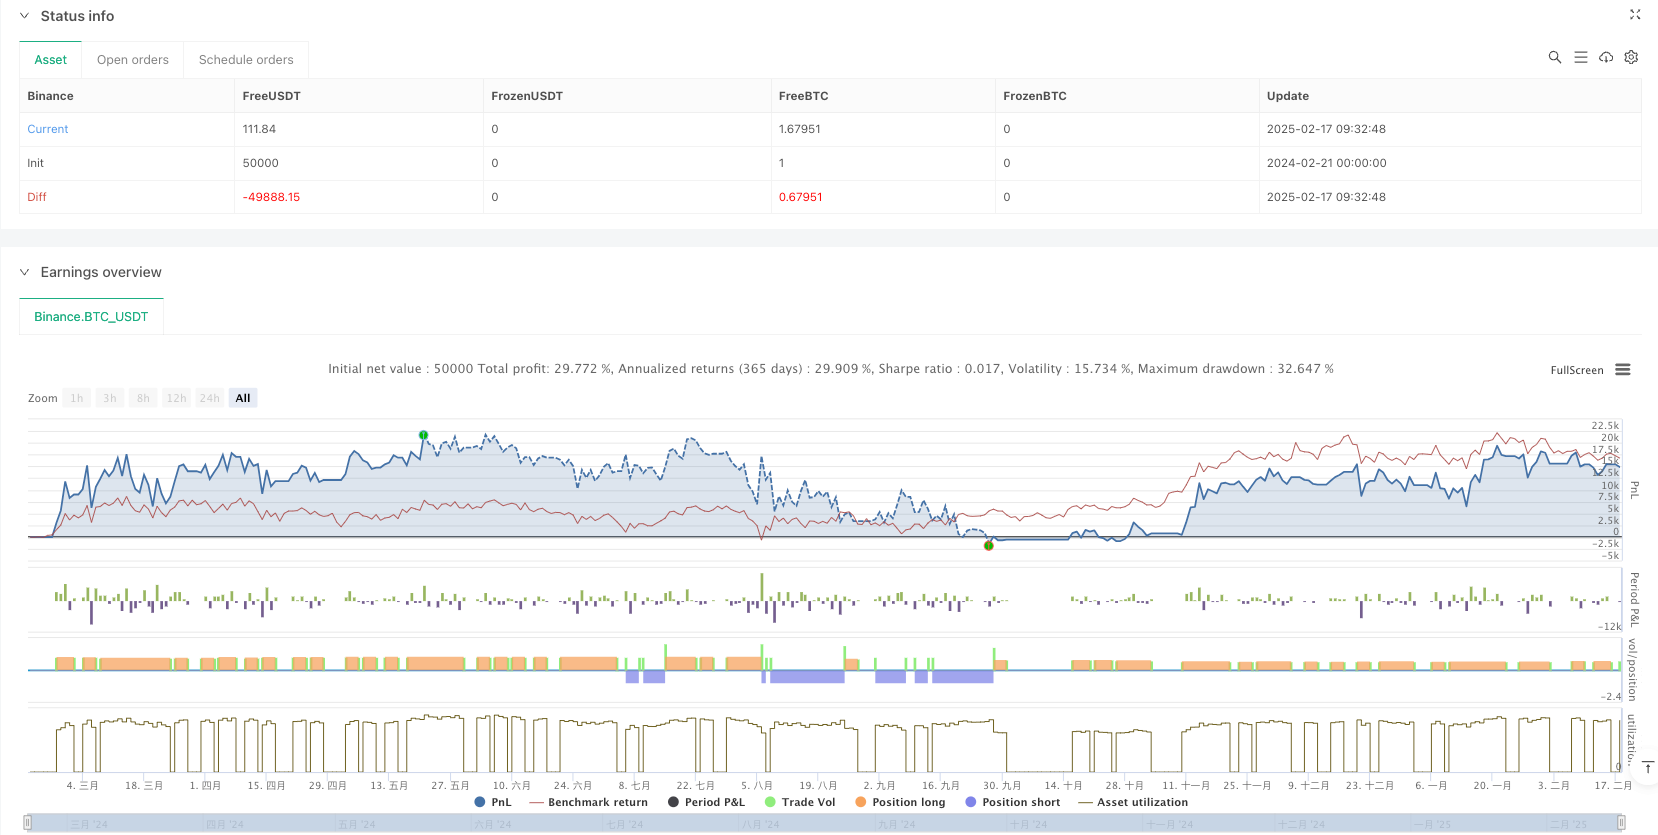
该策略是一个结合了传统技术分析和现代人工智能方法的趋势跟踪系统。它主要利用指数移动平均线(EMA)和简单移动平均线(SMA)作为趋势过滤器,同时引入预测模型来优化入场时机。策略专门针对日线级别进行了优化,旨在捕捉中长期市场趋势。
策略原理
策略的核心逻辑包含三个主要组成部分:
- 趋势判断系统 - 使用200周期的EMA和SMA作为主要趋势过滤器,通过价格与均线的位置关系判断当前趋势方向
- 预测模块 - 采用可扩展的预测组件,目前使用模拟预测,后续可替换为机器学习模型
- 仓位管理 - 设定固定的4根K线持仓周期,用于控制持仓时间和风险
交易信号的产生需要同时满足趋势方向和预测信号的一致性,即:
- 多头信号:价格位于EMA和SMA之上,且预测值为正
- 空头信号:价格位于EMA和SMA之下,且预测值为负
策略优势
- 结构清晰 - 策略逻辑简单直观,易于理解和维护
- 风险可控 - 通过固定持仓周期和双重均线过滤有效控制风险
- 可扩展性强 - 预测模块设计灵活,可以根据需求接入不同的预测模型
- 适应性好 - 参数可调整,能够适应不同市场环境
- 操作频率适中 - 日线级别的操作降低了交易成本和心理压力
策略风险
- 趋势反转风险 - 在趋势转折点可能出现连续亏损
- 参数敏感性 - 均线周期和持仓周期的选择对策略表现影响较大
- 模型依赖性 - 预测模块的准确性直接影响策略效果
- 滑点影响 - 日线级别的操作可能面临较大滑点
- 市场环境依赖 - 在震荡市场中表现可能不佳
策略优化方向
- 预测模型升级 - 引入机器学习模型替代现有的随机预测
- 动态持仓周期 - 根据市场波动率动态调整持仓时间
- 止损优化 - 增加动态止损机制提高风险控制能力
- 仓位管理 - 引入基于波动率的仓位管理系统
- 多维度过滤 - 增加成交量、波动率等辅助指标
总结
该策略通过结合传统技术分析和现代预测方法,构建了一个稳健的趋势跟踪系统。其主要优势在于逻辑清晰、风险可控和较强的可扩展性。通过策略优化,特别是在预测模型和风险控制方面的改进,有望进一步提升策略的稳定性和盈利能力。策略适合追求中长期稳定收益的投资者使用。 ||
Overview
This strategy is a trend following system that combines traditional technical analysis with modern artificial intelligence methods. It primarily uses Exponential Moving Average (EMA) and Simple Moving Average (SMA) as trend filters, while incorporating a prediction model to optimize entry timing. The strategy is specifically optimized for daily timeframes, aiming to capture medium to long-term market trends.
Strategy Principles
The core logic consists of three main components:
- Trend Determination System - Uses 200-period EMA and SMA as primary trend filters, determining current trend direction through price-to-moving average relationships
- Prediction Module - Employs an expandable prediction component, currently using simulated predictions, with the capability to be replaced by machine learning models
- Position Management - Sets a fixed 4-bar holding period to control position duration and risk
Trade signals require consistency between trend direction and prediction signals:
- Long signals: Price above both EMA and SMA, with positive prediction value
- Short signals: Price below both EMA and SMA, with negative prediction value
Strategy Advantages
- Clear Structure - Simple and intuitive strategy logic, easy to understand and maintain
- Controlled Risk - Effective risk control through fixed holding periods and dual moving average filters
- High Scalability - Flexible prediction module design, capable of integrating different prediction models
- Good Adaptability - Adjustable parameters to adapt to different market environments
- Moderate Trading Frequency - Daily timeframe operations reduce trading costs and psychological pressure
Strategy Risks
- Trend Reversal Risk - Potential consecutive losses at trend turning points
- Parameter Sensitivity - Moving average and holding period selections significantly impact strategy performance
- Model Dependency - Prediction module accuracy directly affects strategy effectiveness
- Slippage Impact - Daily timeframe operations may face significant slippage
- Market Environment Dependency - May underperform in ranging markets
Strategy Optimization Directions
- Prediction Model Upgrade - Introduce machine learning models to replace existing random predictions
- Dynamic Holding Period - Adjust holding time based on market volatility
- Stop-Loss Optimization - Add dynamic stop-loss mechanisms to improve risk control
- Position Management - Introduce volatility-based position management system
- Multi-dimensional Filtering - Add volume, volatility, and other auxiliary indicators
Summary
This strategy builds a robust trend following system by combining traditional technical analysis with modern prediction methods. Its main advantages lie in clear logic, controlled risk, and strong scalability. Through strategy optimization, particularly in prediction models and risk control improvements, it has the potential to further enhance stability and profitability. The strategy is suitable for investors seeking medium to long-term stable returns.[/trans]
Source (PineScript)
/*backtest
start: 2024-02-21 00:00:00
end: 2025-02-18 08:00:00
period: 1d
basePeriod: 1d
exchanges: [{"eid":"Binance","currency":"BTC_USDT"}]
*/

//@version=5
strategy("My Strategy", overlay=true)

// Parameters (adjust as needed)
neighborsCount = 8
maxBarsBack = 2000
featureCount = 5
useDynamicExits = true
useEmaFilter = true
emaPeriod = 200
useSmaFilter = true
smaPeriod = 200

// Moving Average Calculations
ema = ta.ema(close, emaPeriod)
sma = ta.sma(close, smaPeriod)

// Trend Conditions
isEmaUptrend = close > ema
isEmaDowntrend = close < ema
isSmaUptrend = close > sma
isSmaDowntrend = close < sma

// Model Prediction (Replace with your real model)
// Here a simulation is used, replace it with real predictions
prediction = math.random() * 2 - 1 // Random value between -1 and 1

// Entry Signals
isNewBuySignal = prediction > 0 and isEmaUptrend and isSmaUptrend
isNewSellSignal = prediction < 0 and isEmaDowntrend and isSmaDowntrend

// Exit Signals
var int barsHeld = 0
var bool in_position = false
var int entry_bar = 0

if isNewBuySignal and not in_position
    in_position := true
    entry_bar := bar_index
    barsHeld := 1
else if isNewSellSignal and not in_position
    in_position := true
    entry_bar := bar_index
    barsHeld := 1
else if in_position
    barsHeld := barsHeld + 1
    if barsHeld == 4
        in_position := false

endLongTradeStrict = barsHeld == 4 and isNewBuySignal[1]
endShortTradeStrict = barsHeld == 4 and isNewSellSignal[1]

// Backtest Logic
var float totalProfit = 0
var float entryPrice = na
var int tradeDirection = 0

if isNewBuySignal and tradeDirection <= 0
    entryPrice := close
    tradeDirection := 1
    strategy.entry("Long", strategy.long)

if isNewSellSignal and tradeDirection >= 0
    entryPrice := close
    tradeDirection := -1
    strategy.entry("Short", strategy.short)

if (endLongTradeStrict and tradeDirection == 1) or (endShortTradeStrict and tradeDirection == -1)
    exitPrice = close
    profit = (exitPrice - entryPrice) / entryPrice
    if tradeDirection == -1
        profit := (entryPrice - exitPrice) / entryPrice

    totalProfit := totalProfit + profit
    tradeDirection := 0
    strategy.close_all()

plot(close, color=color.blue)
plot(ema, color=color.orange)
plot(sma, color=color.purple)
Detail
https://www.fmz.com/strategy/482835
Last Modified
2025-02-27 17:38:36