
15 KiB
Name
动态价格摆荡器趋势策略Dynamic-Price-Swing-Oscillator-Strategy
Author
ChaoZhang
Strategy Description
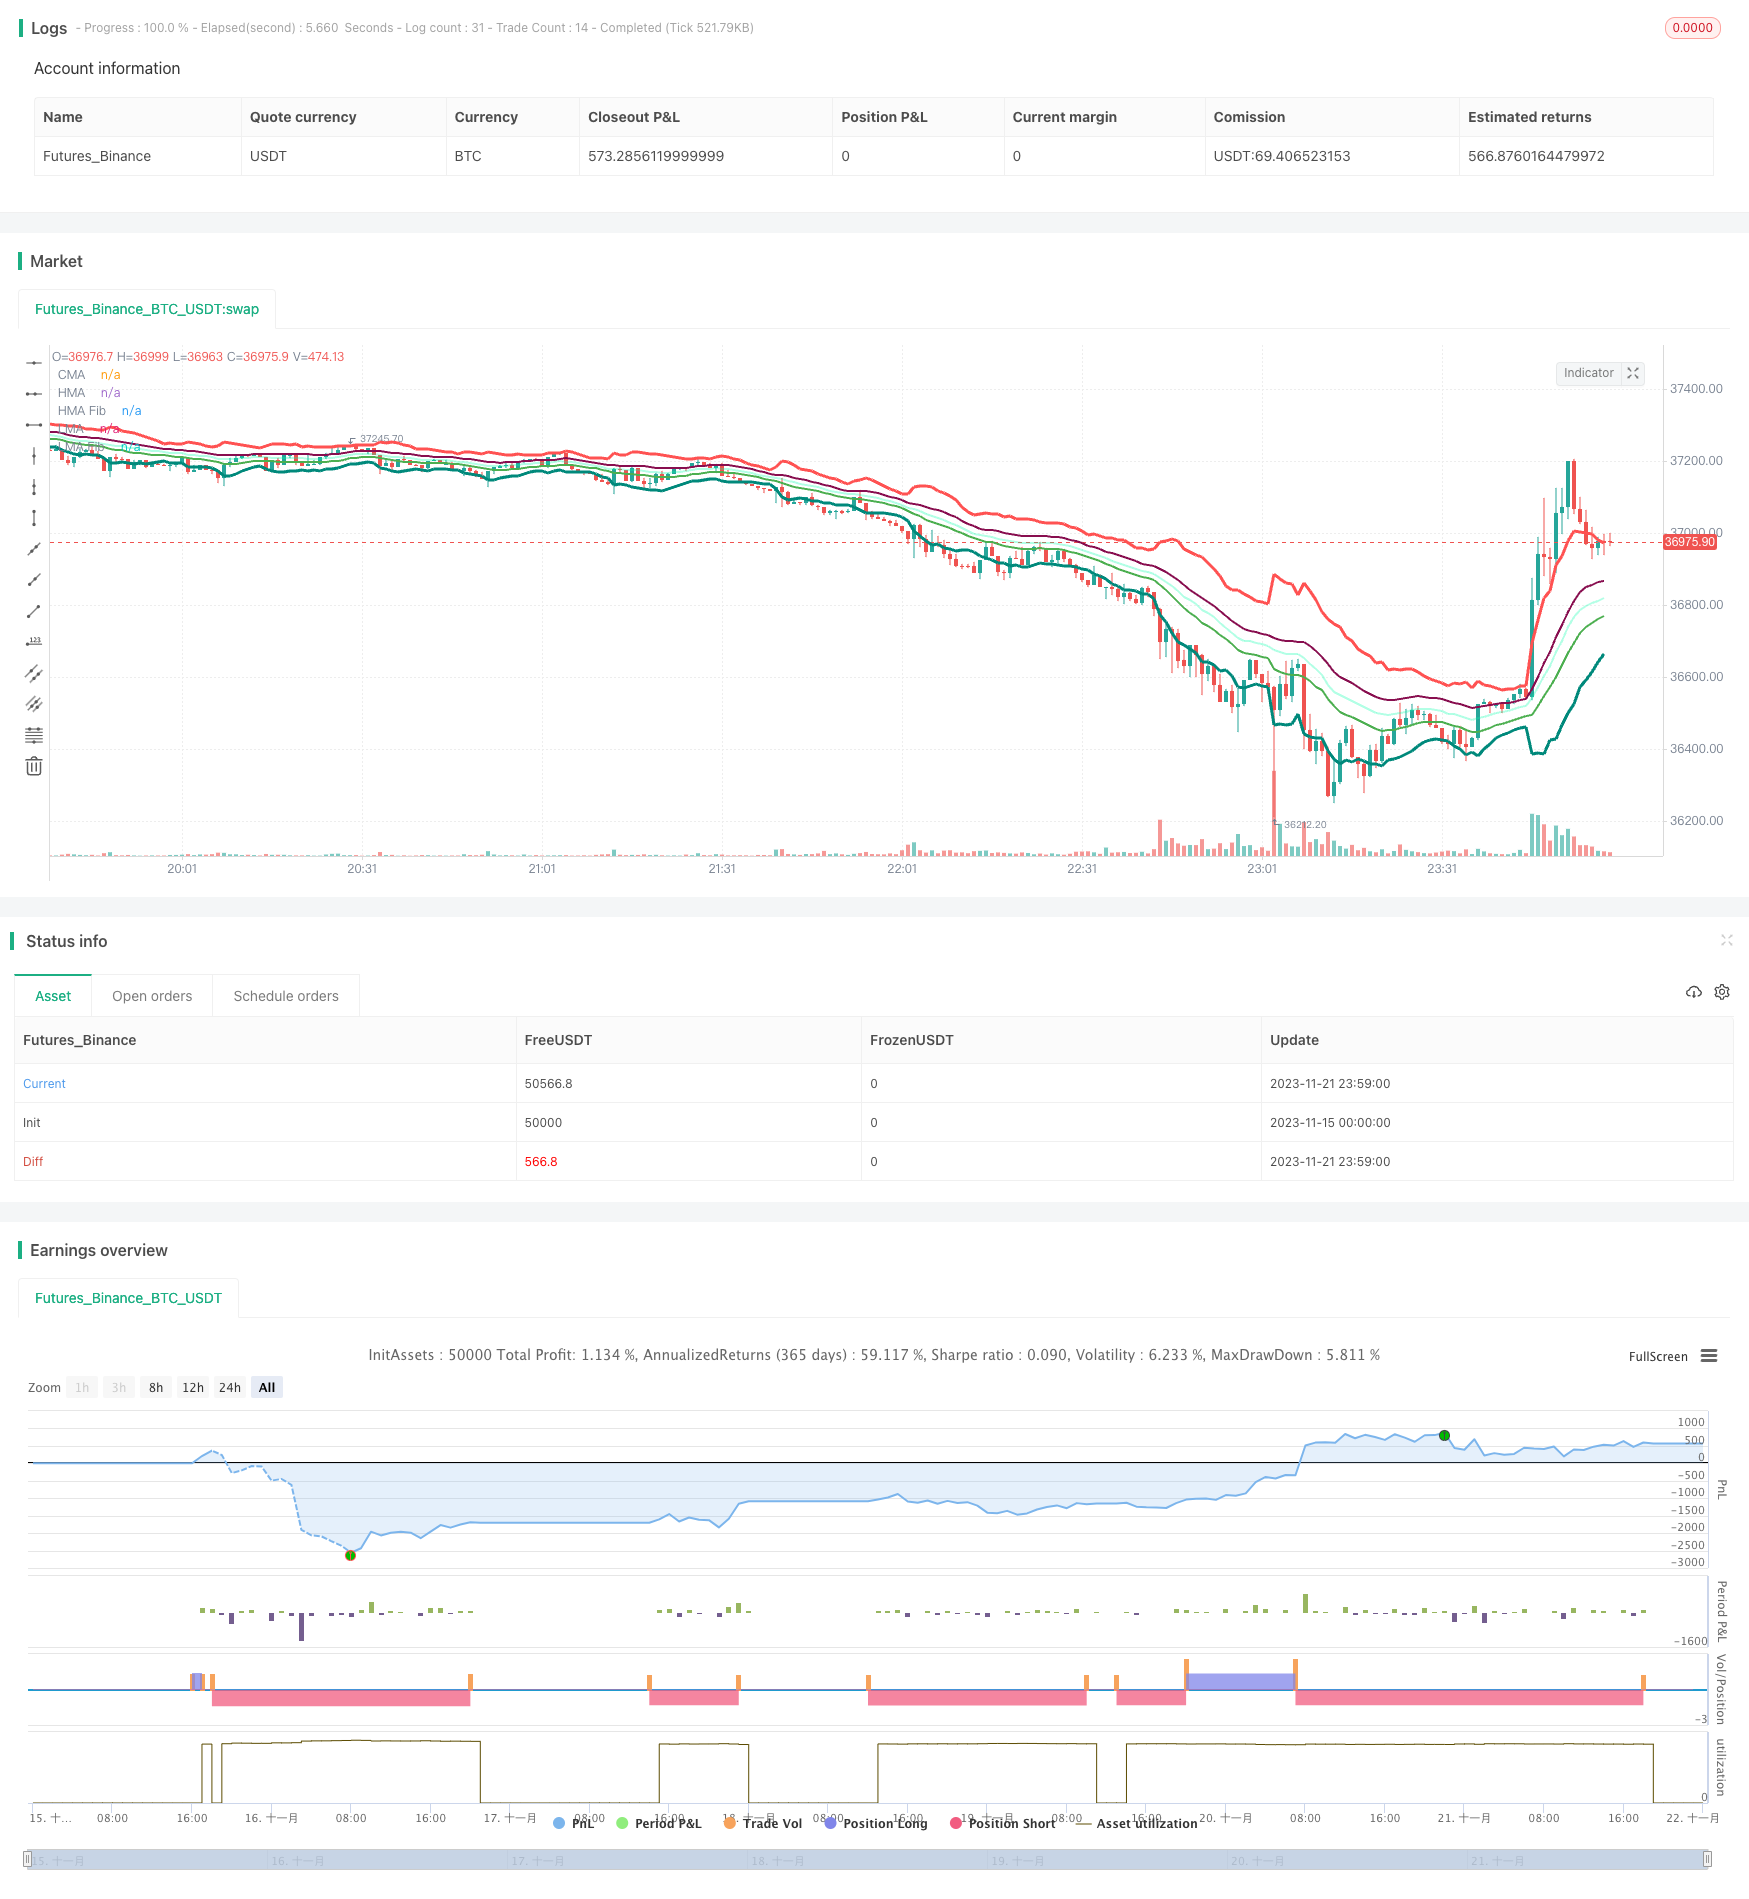 [trans]
概述
动态价格摆荡器(Dynamic Price Swing)是一个用于识别价格趋势的策略。它结合了移动平均线、价格通道和费波那契回撤来实现动态的入场和出场。该策略的优点在于能够识别价格趋势的变化,实现灵活的操作。
策略原理
该策略主要基于以下几点原理构建:
-
使用快速EMA和慢速EMA来判断价格趋势方向,以防止逆势交易
-
使用价格上下限通道来判断突破信号,当价格突破上限通道时做空,突破下限通道时做多
-
使用移动平均线交叉做判断信号,金叉做多,死叉做空
-
使用费波那契回撤线做判断信号,价格突破费波那契上限线时做空,突破费波那契下限线时做多
根据这些指标判断后进入场内,并设置止损、止盈退出机制。
优势分析
该策略结合了多种指标判断,能够识别价格趋势的变化,这是它的最大优势。主要优势如下:
- 使用快慢EMA判断大趋势,防止逆势交易,可以减少损失
- 价格通道判断可以获取价格突破的机会,获利潜力较大
- 移动平均线交叉判断简单实用,容易实现
- 费波那契回撤又增加了一种判断方式,使策略更加立体化
风险分析
该策略也存在一些风险需要注意:
- 快速EMA和慢速EMA参数设置不当可能导致判断错误
- 突破价格上下限通道的时间点选择不当可能引发亏损单
- 移动平均线交叉的选择也需要谨慎
- 费波那契回撤带宽度设置不当也会影响判断效果
这些风险都可以通过参数优化来降低。
优化方向
该策略还有一些可以优化的方向:
- 对EMA周期、通道宽度、移动平均线周期等参数进行测试和优化
- 增加其他技术指标判断,如RSI、布林带等判断规则
- 结合交易量能量指标如OBV来判断突破的可靠性
- 利用机器学习等技术自动寻找最优参数
总结
动态价格摆荡器是一个非常灵活多变的策略。它能够动态适应价格变化,通过多种指标判断突破并交易。虽然也存在一些风险,但可以通过不断优化来降低风险,提高策略的稳定性和盈利能力。该策略值得深入研究。
||
Overview
The Dynamic Price Swing Oscillator is a strategy for identifying price trends. It combines moving averages, price channels and Fibonacci retracements to implement dynamic entry and exit. The advantage of this strategy is that it can identify changes in price trends for flexible operation.
Principles
The strategy is mainly built on the following principles:
-
Use fast EMA and slow EMA to determine the direction of the price trend to prevent trading against the trend
-
Use price upper and lower channel limits to determine breakout signals, go short when the price breaks through the upper limit channel, and go long when it breaks through the lower limit channel
-
Use moving average crossovers as judgment signals, go long on golden crosses, and go short on death crosses
-
Use Fibonacci retracement lines as judgment signals, go short when the price breaks through the Fibonacci upper limit line, and go long when it breaks through the lower limit line
After determining based on these indicators to enter the market, stop loss and take profit exit mechanisms are set.
Advantage Analysis
The biggest advantage of this strategy is that it combines multiple indicators to identify changes in price trends. The main advantages are:
-
Using fast and slow EMAs to determine the major trend prevents trading against the trend and can reduce losses
-
Price channel judgments can capture price breakout opportunities with greater profit potential
-
Moving average crossover judgments are simple and practical, easy to implement
-
Fibonacci retracements add another way of judging to make the strategy more three-dimensional
Risk Analysis
Some risks of this strategy need to be noted:
-
Improper parameter settings for fast and slow EMAs can lead to misjudgments
-
Improper timing of breaking through the upper and lower limits of the price channel may lead to loss orders
-
The choice of moving average crosses also needs to be prudent
-
Improper width settings of the Fibonacci retracement bands will also affect the judgment effect
These risks can be reduced through parameter optimization.
Optimization Directions
There are some directions that can be optimized for this strategy:
-
Test and optimize parameters such as EMA cycle, channel width, and moving average period
-
Add judgment rules for other technical indicators such as RSI and Bollinger Bands
-
Combine trading volume energy indicators such as OBV to determine the reliability of breakouts
-
Use machine learning and other technologies to automatically find the optimal parameters
Conclusion
The Dynamic Price Swing Oscillator is a highly flexible and adaptable strategy. It can dynamically adapt to price changes and trade after determining breakouts through multiple indicator judgments. Although there are some risks, they can be reduced by continuous optimization to improve the stability and profitability of the strategy. The strategy is worth in-depth research.
[/trans]
Strategy Arguments
| Argument | Default | Description |
|---|---|---|
| v_input_1 | timestamp(22 June 2021 00:00 -0500) | Start Time |
| v_input_2 | timestamp(31 December 2021 00:00 -0600) | End Time |
| v_input_3 | true | Long/Short for Mixed Market, Long for Bull, Short for Bear |
| v_input_4 | 0 | Trade Types: Long/Short |
| v_input_5 | 10 | Stop Loss % |
| v_input_6 | 20 | Target Profit % |
| v_input_7 | 2 | Stop Trading After This Many Losing Days |
| v_input_8 | 10 | Maximum % of Equity Lost to Halt Trading |
| v_input_9 | true | Number of bars to look back on to calculate price swings. |
| v_input_10 | 5 | Max Lookback Period |
| v_input_11_high | 0 | High Source: high |
| v_input_12_low | 0 | Low Source: low |
| v_input_13 | true | Trend uses Fast and Slow EMA to prevent going the wrong direction |
| v_input_14 | 14 | RSI Length |
| v_input_15 | 12 | EMA Fast Length |
| v_input_16 | 26 | EMA Slow Length |
| v_input_17 | true | Use Average Price Channel Only |
| v_input_18 | false | Use Price Moving Average Only |
| v_input_19 | false | Use Price Fibonacci Average Only |
Source (PineScript)
/*backtest
start: 2023-11-15 00:00:00
end: 2023-11-22 00:00:00
period: 1m
basePeriod: 1m
exchanges: [{"eid":"Futures_Binance","currency":"BTC_USDT"}]
*/

// This source code is subject to the terms of the Mozilla Public License 2.0 at https://mozilla.org/MPL/2.0/
//@version=4

// ██████╗██████╗ ███████╗ █████╗ ████████╗███████╗██████╗     ██████╗ ██╗   ██╗
//██╔════╝██╔══██╗██╔════╝██╔══██╗╚══██╔══╝██╔════╝██╔══██╗    ██╔══██╗╚██╗ ██╔╝
//██║     ██████╔╝█████╗  ███████║   ██║   █████╗  ██║  ██║    ██████╔╝ ╚████╔╝
//██║     ██╔══██╗██╔══╝  ██╔══██║   ██║   ██╔══╝  ██║  ██║    ██╔══██╗  ╚██╔╝
//╚██████╗██║  ██║███████╗██║  ██║   ██║   ███████╗██████╔╝    ██████╔╝   ██║
// ╚═════╝╚═╝  ╚═╝╚══════╝╚═╝  ╚═╝   ╚═╝   ╚══════╝╚═════╝     ╚═════╝    ╚═╝

//███████╗ ██████╗ ██╗     ██╗   ██╗████████╗██╗ ██████╗ ███╗   ██╗███████╗ ██╗ █████╗ ███████╗ █████╗
//██╔════╝██╔═══██╗██║     ██║   ██║╚══██╔══╝██║██╔═══██╗████╗  ██║██╔════╝███║██╔══██╗╚════██║██╔══██╗
//███████╗██║   ██║██║     ██║   ██║   ██║   ██║██║   ██║██╔██╗ ██║███████╗╚██║╚██████║    ██╔╝╚█████╔╝
//╚════██║██║   ██║██║     ██║   ██║   ██║   ██║██║   ██║██║╚██╗██║╚════██║ ██║ ╚═══██║   ██╔╝ ██╔══██╗
//███████║╚██████╔╝███████╗╚██████╔╝   ██║   ██║╚██████╔╝██║ ╚████║███████║ ██║ █████╔╝   ██║  ╚█████╔╝
//╚══════╝ ╚═════╝ ╚══════╝ ╚═════╝    ╚═╝   ╚═╝ ╚═════╝ ╚═╝  ╚═══╝╚══════╝ ╚═╝ ╚════╝    ╚═╝   ╚════╝


strategy(shorttitle='DPS',title='Dynamic Price Swing', overlay=true, scale=scale.left, initial_capital = 1000, process_orders_on_close=true, default_qty_type = strategy.percent_of_equity, default_qty_value = 100, commission_type=strategy.commission.percent, commission_value=0.18, calc_on_every_tick=true)


// -----------------  Strategy Inputs -------------------------------------------------------------
//Backtest dates with auto finish date of today
start = input(defval = timestamp("22 June 2021 00:00 -0500"), title = "Start Time")
finish = input(defval = timestamp("31 December 2021 00:00 -0600"), title = "End Time")
window()  => true       // create function "within window of time"

// Strategy Selection - Long, Short, or Both
stratinfo = input(true, "Long/Short for Mixed Market, Long for Bull, Short for Bear")
strat = input(title="Trade Types", defval="Long/Short", options=["Long Only", "Long/Short", "Short Only"])
strat_val = strat == "Long Only" ? 1 : strat == "Long/Short" ? 0 : -1

// Risk Management Inputs
sl= input(10.0, "Stop Loss %", minval = 0, maxval = 100, step = 0.01)
stoploss = sl/100
tp = input(20.0, "Target Profit %", minval = 0, maxval = 100, step = 0.01)
TargetProfit = tp/100
ld = input(2, "Stop Trading After This Many Losing Days", type=input.integer, minval=0, maxval=100, step=1)
// strategy.risk.max_cons_loss_days(count=ld)
ml = input(10, "Maximum % of Equity Lost to Halt Trading", type=input.integer, minval=1, maxval=100, step=1)
// strategy.risk.max_drawdown(value=ml, type=strategy.percent_of_equity)

// Price Movement Inputs
PriceInfo = input(true, "Number of bars to look back on to calculate price swings.")
lkbk = input(5,"Max Lookback Period")
high_source = input(high,"High Source")
low_source= input(low,"Low Source")

// Trend Inputs
TrendInfo = input(true, "Trend uses Fast and Slow EMA to prevent going the wrong direction")
length = input(14, "RSI Length", minval=1)
fastLength = input(12, minval=1, title="EMA Fast Length")
slowLength = input(26, minval=1, title="EMA Slow Length")

// Trigger Selection
usePrice = input(true, "Use Average Price Channel Only")
useMA = input(false, "Use Price Moving Average Only")
useFib = input(false, "Use Price Fibonacci Average Only")


// Trend Direction Calculation
rsi_ema = ema(rsi(close, length), length)
emaA = ema(rsi_ema, fastLength)
emaFast = 2 * emaA - ema(emaA, fastLength)
emaB = ema(rsi_ema, slowLength)
emaSlow = 2 * emaB - ema(emaB, slowLength)


bullishRule =emaFast > emaSlow and rsi_ema >=rsi_ema[1]
bearishRule =emaFast < emaSlow and rsi_ema <= rsi_ema[1]


// Price Channel

lasthigh = highest(high_source, lkbk)
lastlow = lowest(low_source, lkbk)


// Fibonacci and Moving Average
MA1 = sma(close,5),HA1 = sma(high,5),LA1 = sma(low,5),
MA2 = sma(close,8),HA2 = sma(high,8),LA2 = sma(low,8),
MA3 = sma(close,13),HA3 = sma(high,13),LA3 = sma(low,13),
MA4 = sma(close,21),HA4 = sma(high,21),LA4 = sma(low,21),
MA5 = sma(close,34),HA5 = sma(high,34),LA5 = sma(low,34),
MA6 = sma(close,55),HA6 = sma(high,55),LA6 = sma(low,55),
MA7 = sma(close,89),HA7 = sma(high,89),LA7 = sma(low,89),

CMA = (MA1+MA2+MA3+MA4+MA5+MA6+MA7)/7,
HMA = (HA1+HA2+HA3+HA4+HA5+HA6+HA7)/7,
HMA2 = CMA + (atr(lkbk)*1.618)

LMA = (LA1+LA2+LA3+LA4+LA5+LA6+LA7)/7,
LMA2 = CMA - (atr(lkbk)*1.618)


plot(CMA, title="CMA", color=color.new(#00ffaa, 70), linewidth=2)
plot(HMA, title="HMA", color=color.maroon, linewidth=2)
plot(HMA2, title="HMA Fib", color=color.red, linewidth=3)
plot(LMA, title="LMA", color=color.green, linewidth=2)
plot(LMA2, title="LMA Fib", color=color.teal, linewidth=3)


// -------------------------------- Entry and Exit Logic ------------------------------------

// Entry Logic

Channel_Sell = close >= lasthigh[1] and bearishRule and window()
Channel_Buy =  close <= lastlow[1] and bullishRule and window()

MA_Sell = high>HMA and window()
MA_Buy = low<LMA and window()

Fib_Sell = high>HMA2 and window()
Fib_Buy = low<LMA2 and window()

qty = strategy.equity/close


// Strategy Entry and Exit with built in Risk Management
if(strategy.opentrades==0 and strat_val>-1)
    GoLong = usePrice ? Channel_Buy : useMA ? MA_Buy : useFib ? Fib_Buy : false
    if (GoLong)
        strategy.entry("LONG", strategy.long, qty)

if(strategy.opentrades==0 and strat_val<1)
    GoShort = usePrice ? Channel_Sell : useMA ? MA_Sell : useFib ? Fib_Sell : false
    if (GoShort)
        strategy.entry("SHORT", strategy.short, qty)


longStopPrice  = strategy.position_avg_price * (1 - stoploss)
longTakePrice  = strategy.position_avg_price * (1 + TargetProfit)
shortStopPrice = strategy.position_avg_price * (1 + stoploss)
shortTakePrice = strategy.position_avg_price * (1 - TargetProfit)

if (strategy.position_size > 0)
    strategy.exit(id="Exit Long", from_entry = "LONG", stop = longStopPrice, limit = longTakePrice)

if (strategy.position_size < 0)
    strategy.exit(id="Exit Short", from_entry = "SHORT", stop = shortStopPrice, limit = shortTakePrice)

CloseShort= usePrice ? Channel_Buy : useMA ? MA_Buy : useFib ? Fib_Buy : false
CloseLong = usePrice ? Channel_Sell : useMA ? MA_Sell : useFib ? Fib_Sell : false

if(CloseLong and strategy.position_size > 0)
    strategy.close("LONG")


if(CloseShort and strategy.position_size < 0)
    strategy.close("SHORT")
Detail
https://www.fmz.com/strategy/432968
Last Modified
2023-11-23 10:45:02