
9.4 KiB
Name
动态价格区间突破交易策略基于支撑阻力位的量化系统-Dynamic-Price-Zone-Breakout-Trading-Strategy-Based-on-Support-and-Resistance-Quantitative-System
Author
ChaoZhang
Strategy Description
[trans]
概述
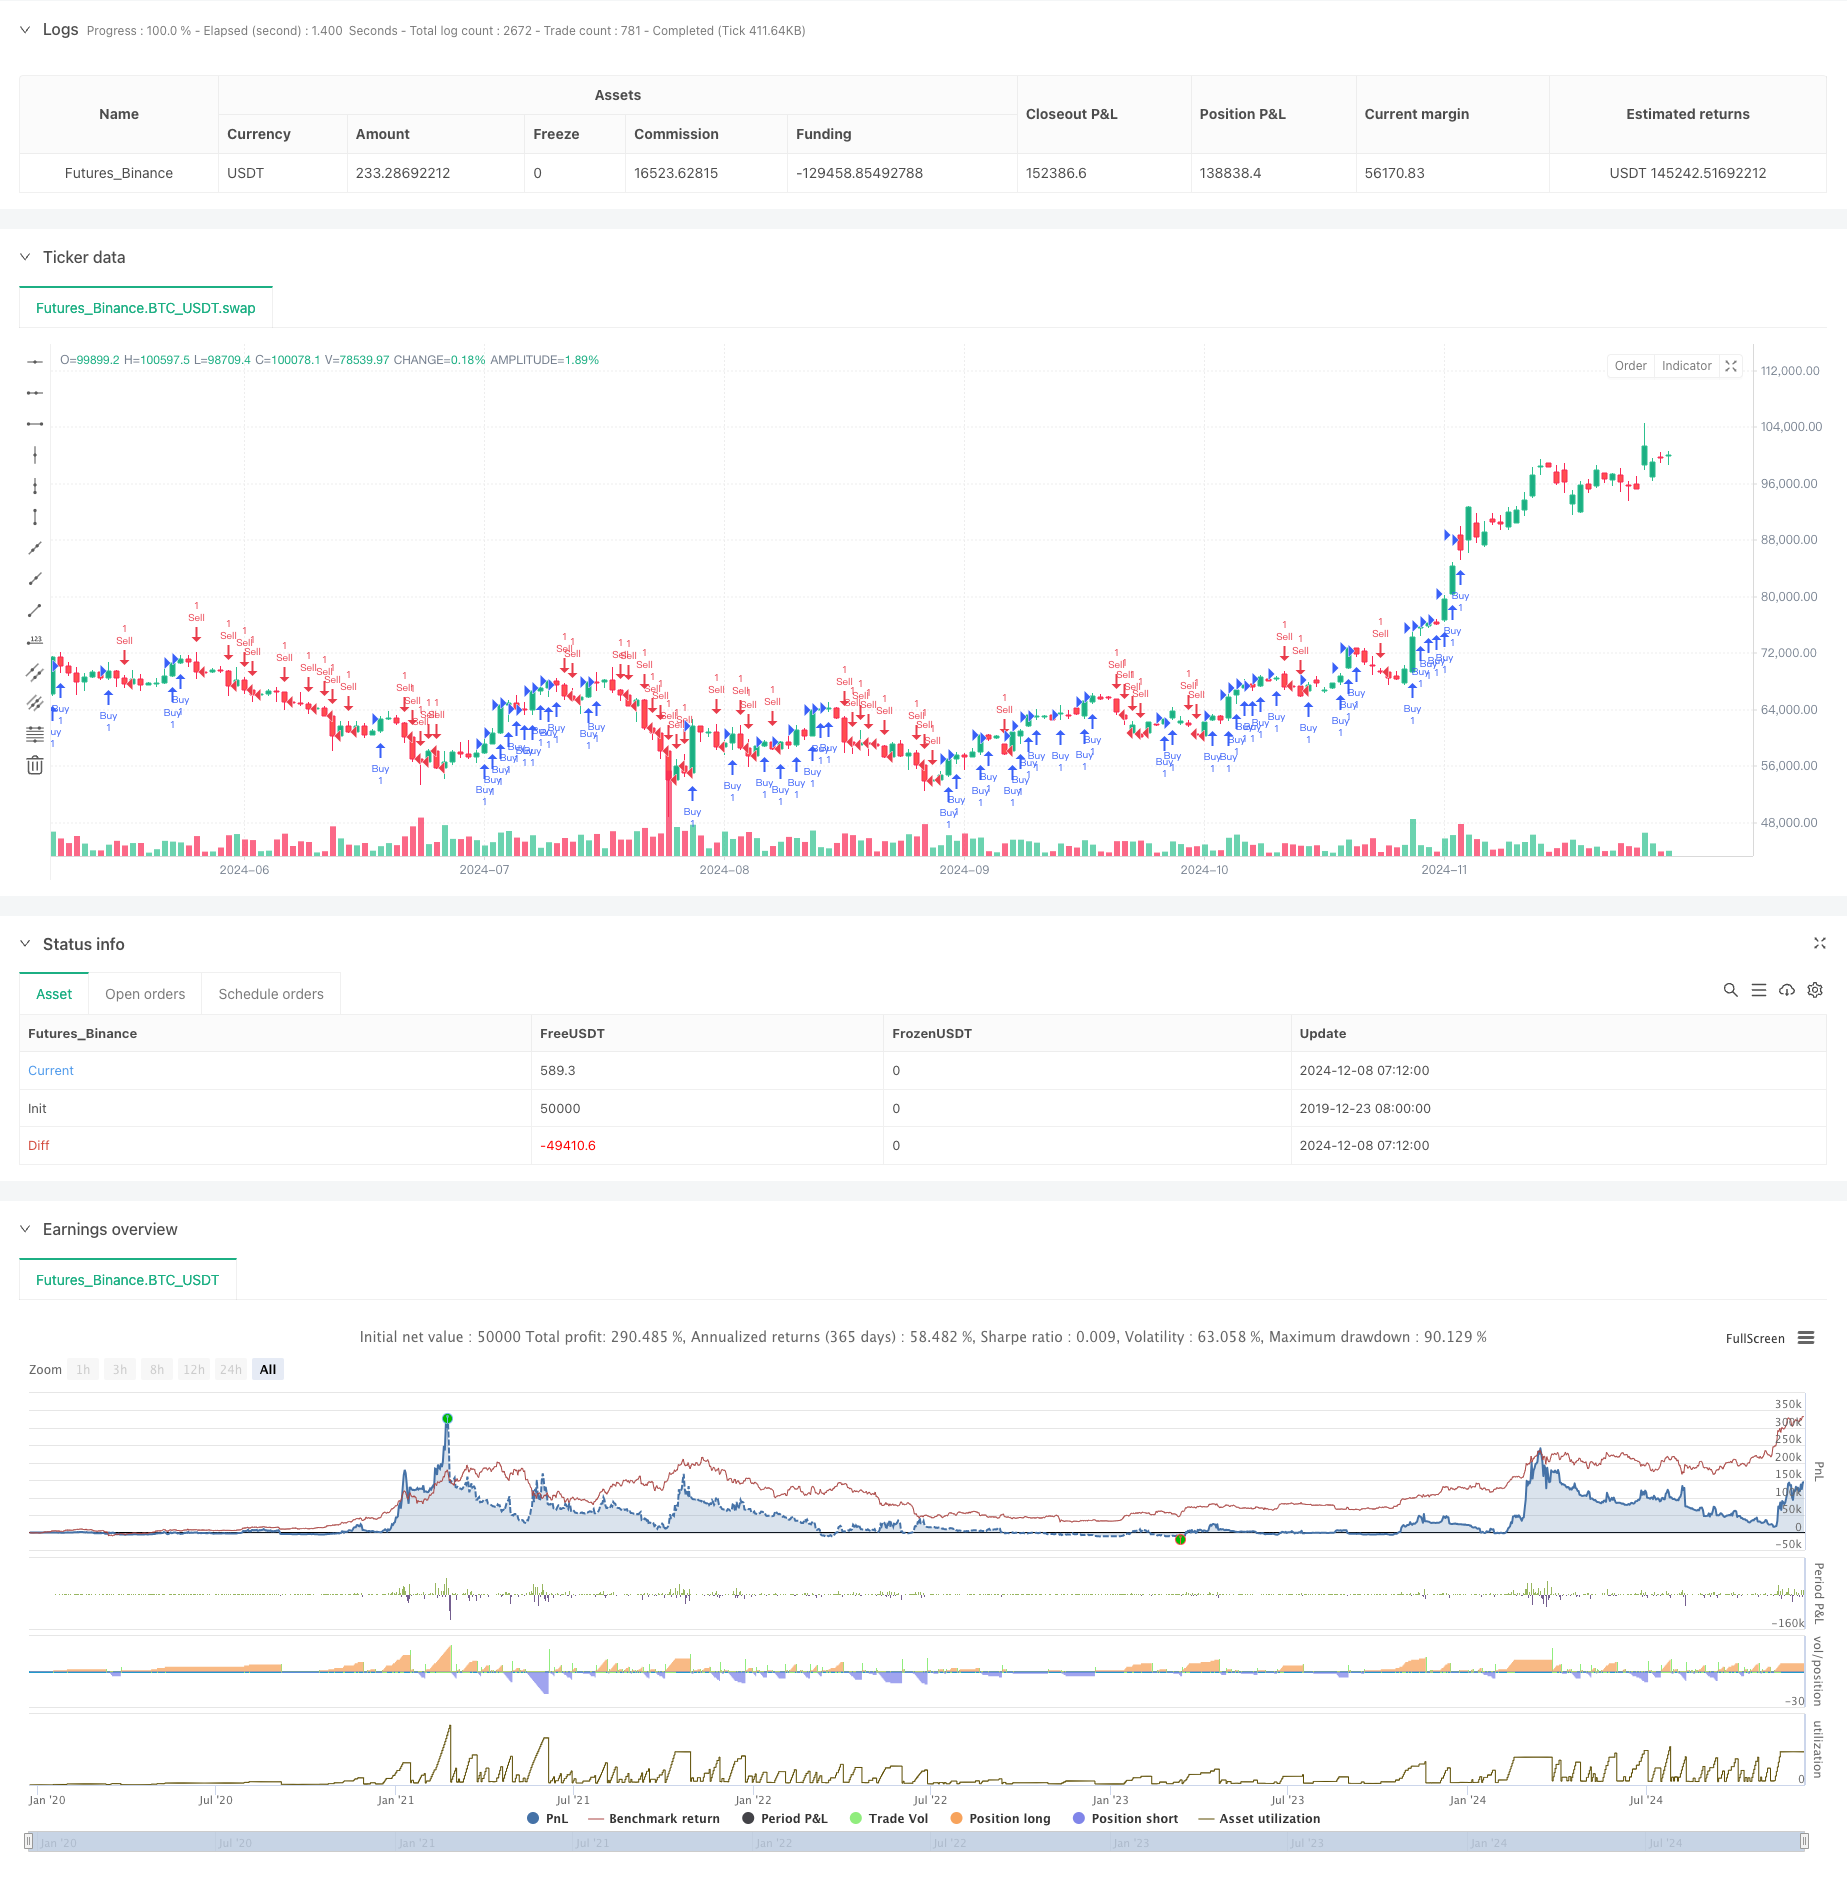
该策略是一个基于价格区间突破的量化交易系统。它通过动态设定价格区间的上下限,在价格突破这些关键水平时进行交易。策略的核心思想是在市场突破既定价格区间时捕捉趋势性机会,同时通过动态调整价格区间来适应市场变化。该策略采用灵活的仓位管理方式,允许在同一方向追加交易,以最大化把握大趋势带来的收益。
策略原理
策略的运作基于以下核心机制:首先,根据不同交易品种的特性设定相应的步长(step_size),这个步长基于品种价格的1.5%左右制定。系统会在当前价格的上下方各设置一个价格区间,当价格突破上限时,触发做多信号;突破下限时,触发做空信号。在每次突破后,价格区间会随之调整,以适应新的市场环境。策略支持同向加仓,最多可以建立200个同向仓位,这让策略能够在强势趋势中持续获利。订单的处理采用了多重保障机制,包括在K线结束时处理订单、在交易成交后重新计算以及在每个价格变动时进行计算。
策略优势
- 动态适应性强:价格区间会随着市场变化而自动调整,使策略能够适应不同市场环境。
- 趋势跟踪能力突出:通过允许同向加仓,策略能够充分把握强势趋势。
- 风险控制完善:设置了清晰的止损条件,在价格跌破区间时自动平仓。
- 适用性广泛:通过对不同交易品种设置相应的步长参数,策略可以适用于多种市场。
- 计算效率高:采用了变量持久化和高效的计算方式,确保策略运行流畅。
策略风险
- 震荡市场风险:在区间震荡市场中可能频繁触发假突破,导致连续止损。
- 资金管理风险:同向加仓可能导致仓位过于集中,需要合理控制单个方向的风险敞口。
- 滑点风险:在剧烈波动时,可能面临较大滑点,影响策略表现。
- 参数敏感性:步长设置的合理性直接影响策略效果,需要充分测试。
策略优化方向
- 引入波动率指标:可以根据市场波动率动态调整步长,提高策略适应性。
- 增加筛选机制:添加趋势确认指标,减少假突破带来的损失。
- 完善仓位管理:设计更细致的仓位控制机制,平衡收益和风险。
- 优化订单执行:可以添加智能订单路由,减少滑点影响。
- 增加时间维度:考虑市场时间特征,在不同时段调整策略参数。
总结
这是一个设计合理、逻辑清晰的趋势跟踪策略。通过动态价格区间的设定和调整,结合灵活的仓位管理,策略能够有效捕捉市场趋势性机会。虽然存在一些需要优化的空间,但整体而言,该策略提供了一个稳健的量化交易框架。通过持续优化和改进,策略的表现可以进一步提升。策略的设计充分考虑了实际交易中的各种情况,包括订单处理、计算效率等关键因素,展现了较强的实用性。
||
Overview
This strategy is a quantitative trading system based on price range breakouts. It operates by dynamically setting upper and lower price limits and executing trades when prices break through these key levels. The core concept is to capture trending opportunities when the market breaks out of established price ranges while adapting to market changes through dynamic adjustment of price zones. The strategy employs flexible position management, allowing additional trades in the same direction to maximize profits from major trends.
Strategy Principles
The strategy operates based on the following core mechanisms: First, it sets appropriate step sizes for different trading instruments, typically around 1.5% of the instrument's price. The system establishes price zones above and below the current price, triggering long signals when prices break above the upper limit and short signals when breaking below the lower limit. After each breakout, the price zones adjust to adapt to the new market environment. The strategy supports adding positions in the same direction, allowing up to 200 positions, enabling profit maximization during strong trends. Order processing includes multiple safeguards, including processing at bar close, recalculating after trade execution, and computing at every price tick.
Strategy Advantages
- Strong Dynamic Adaptation: Price zones automatically adjust with market changes, allowing the strategy to adapt to different market conditions.
- Excellent Trend Following Capability: Through allowing additional positions in the same direction, the strategy can fully capitalize on strong trends.
- Comprehensive Risk Control: Clear stop-loss conditions are set, automatically closing positions when prices break below the zone.
- Wide Applicability: The strategy can be applied to various markets through appropriate step size parameters for different trading instruments.
- High Computational Efficiency: Employs variable persistence and efficient calculation methods to ensure smooth strategy operation.
Strategy Risks
- Choppy Market Risk: Frequent false breakouts in range-bound markets may lead to consecutive stops.
- Position Management Risk: Adding positions in the same direction may lead to over-concentration, requiring proper control of directional risk exposure.
- Slippage Risk: Significant slippage during volatile periods may affect strategy performance.
- Parameter Sensitivity: The effectiveness of the strategy directly depends on appropriate step size settings, requiring thorough testing.
Strategy Optimization Directions
- Incorporate Volatility Indicators: Dynamically adjust step sizes based on market volatility to improve strategy adaptability.
- Add Filtering Mechanisms: Include trend confirmation indicators to reduce losses from false breakouts.
- Enhance Position Management: Design more detailed position control mechanisms to balance returns and risks.
- Optimize Order Execution: Add smart order routing to reduce slippage impact.
- Include Time Dimension: Consider market time characteristics to adjust strategy parameters during different periods.
Summary
This is a well-designed trend following strategy with clear logic. Through dynamic price zone settings and adjustments, combined with flexible position management, the strategy can effectively capture market trending opportunities. While there is room for optimization, overall, the strategy provides a robust quantitative trading framework. Through continuous optimization and improvement, strategy performance can be further enhanced. The strategy design thoroughly considers various aspects of practical trading, including order processing and computational efficiency, demonstrating strong practicality.[/trans]
Source (PineScript)
/*backtest
start: 2019-12-23 08:00:00
end: 2024-12-09 08:00:00
period: 1d
basePeriod: 1d
exchanges: [{"eid":"Futures_Binance","currency":"BTC_USDT"}]
*/

// @version=5
// 每个图表上画对应间隔的横线,自己手画吧
// 同方向追加20单,订单成交后重新计算,每个tick重新计算,变量保存1000个周期,k线结束后再处理一次订单,按照代码顺序来绘制plot
strategy("Price Level Breakout Strategy", overlay=true, pyramiding=200, calc_on_order_fills=true, calc_on_every_tick=true, max_bars_back=1000, process_orders_on_close=true, explicit_plot_zorder=true)
// var创建持久性变量,:=是更新变量,不重新声明
// 这个是全局变量
// a = array.new<string>(200)
// array.push(a, "a")
// plot(close, color = array.get(a, close > open ? 1 : 0))
string ticker = syminfo.ticker
var float step_size = 1000
// label.new(x=bar_index, y=close, text="当前品种代码: " + ticker)
// 根据定值画1.5的平行线
if ticker == "000300"
    step_size := 4000 * 0.015
if ticker == "XAUUSD"
    step_size := 3000 * 0.016
if ticker == "BTCUSD"
    step_size := 60000 * 0.015
if ticker == "SILVER"
    step_size := 50 * 0.015
if ticker == "UKOIL"
    step_size := 150 * 0.015
if ticker == "GBPUSD"
    step_size := 1.6 * 0.015
if ticker == "EURUSD"
    step_size := 1.1 * 0.015
    // 从0开始画200条间隔线
if ticker == "USDJPY"
    step_size := 100 * 0.015
var float start_value = close
var float up_number = close + step_size
var float low_number = close - step_size
// hline(3.14, title='Pi', color=color.blue, linestyle=hline.style_dotted, linewidth=2)
// plot(1)
// 当价格突破上限,产生买入信号
if close > up_number
    // 生成买入信号
    strategy.entry(id = "Buy", direction = strategy.long)
    // 更新新的价格区间
    start_value := start_value + step_size
    up_number := start_value + step_size
    low_number := start_value - step_size
    strategy.close(id = "Sell")
// 当价格跌破下限,产生卖出信号
if close < low_number
    // 生成卖出信号
    strategy.entry("Sell", strategy.short)
    // 更新新的价格区间
    start_value := start_value - step_size
    up_number := start_value + step_size
    low_number := start_value - step_size
    strategy.close(id = "Buy")
Detail
https://www.fmz.com/strategy/474674
Last Modified
2024-12-11 15:03:50