
8.7 KiB
Name
动态上升ADX趋势跟踪策略Dynamic-Rising-ADX-Trend-Following-Strategy
Author
ChaoZhang
Strategy Description
 [trans]
概述
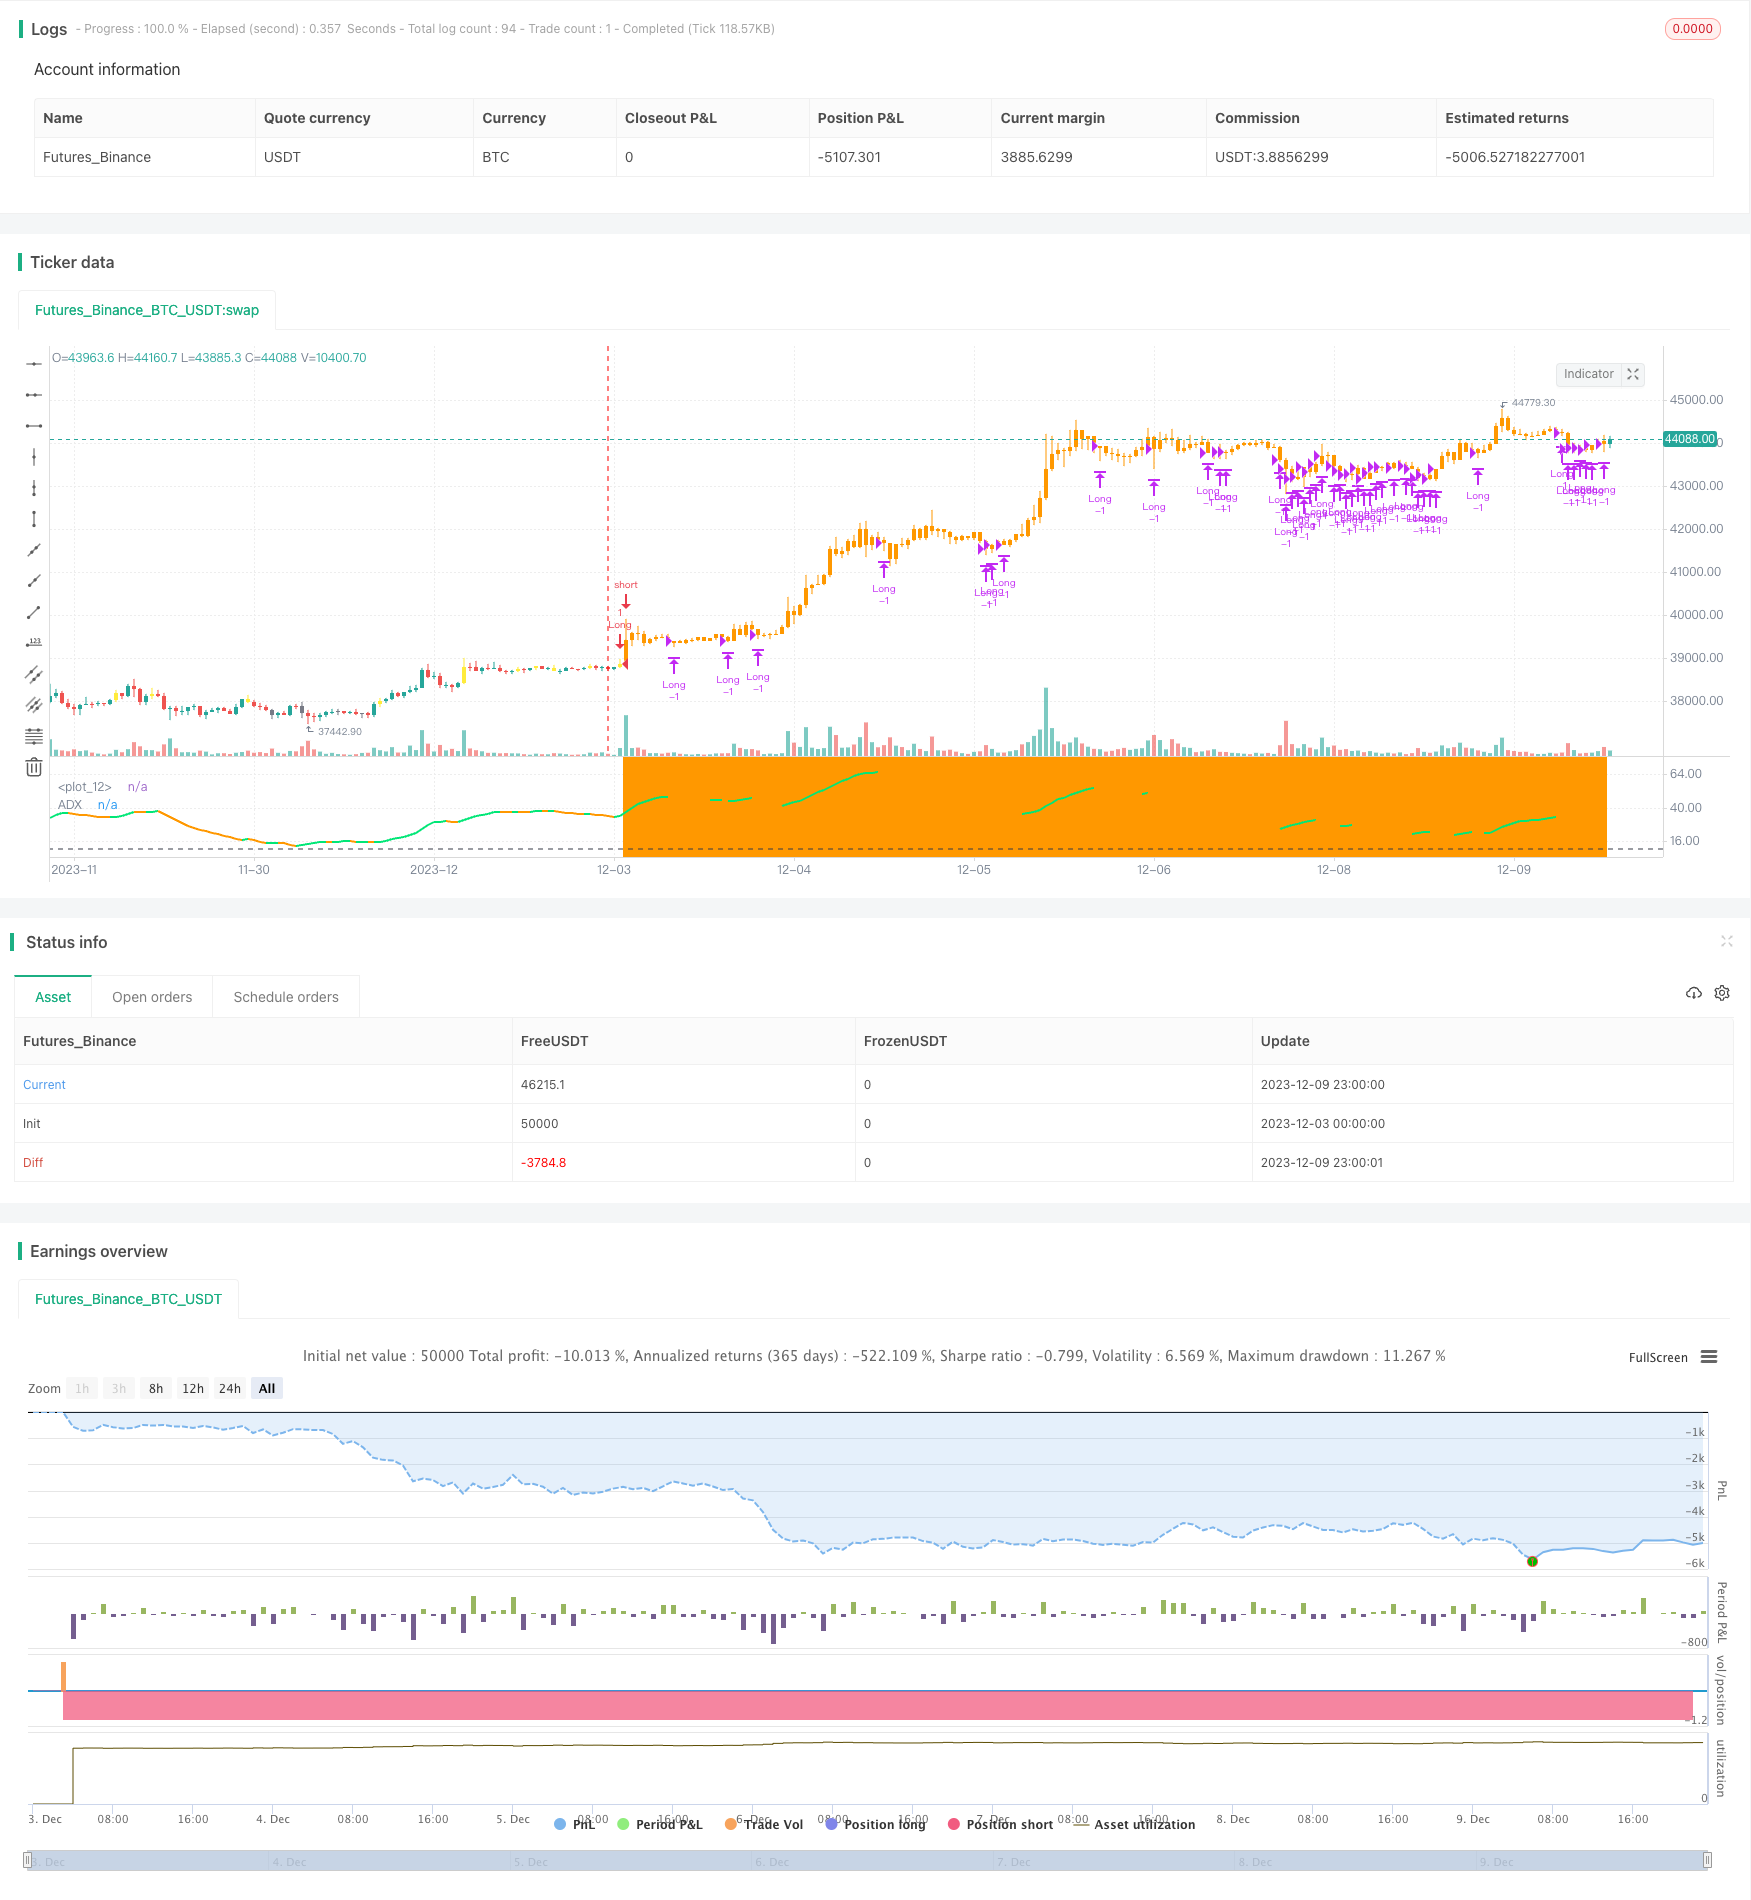
该策略通过跟踪ADX指标的动态变化,捕捉市场趋势的初期变化,实现趋势的及时跟踪。当ADX从低位快速上升时,说明趋势在形成,这是入场的大好时机。结合移动平均线的辅助,可以有效过滤错诊。
策略原理
该策略主要基于ADX指标的动态变化来判断趋势的发展。ADX指标在低位时,代表趋势变化不大;当ADX从低位快速上升时,说明趋势正在形成。策略通过监测ADX的快速上升,来捕捉趋势的发展。
具体来说,策略的入场判断包括以下几个条件:
- ADX上穿设定的阈值(如10)
- ADX向上快速上升
- 价格上穿简单移动平均线或指数移动平均线
当上述条件同时满足时,代表趋势正在形成,做多;当下穿移动平均线时,平仓。使用两个移动平均线,可以更准确判断趋势的发展。
停损条件也类似,当ADX向下快速下降时,做空;价格下穿移动平均线时,平仓。
优势分析
该策略最大的优势在于及时捕捉趋势的发展。传统仅看ADX数值的方法,往往要等ADX上升到20或25才能确认趋势,这已经错过了最佳的入场时机。该策略通过跟踪ADX的快速上升段,能极大地把握趋势的发展。
另外,策略还引入移动平均线进行辅助,可以有效过滤部分错诊情况,提高策略的稳定性。
风险及优化分析
该策略最大的风险在于ADX指标本身的滞后性。尽管通过跟踪快速上升段可以缩短滞后,但仍然存在一定滞后。这会导致部分快速反转的市场无法捕捉。
此外,ADX指标对趋势判断也并非百分之百准确,难免也会出现一定的错诊。引入移动平均线虽可过滤部分噪声,但仍需进一步优化。
该策略的优化空间还很大,关键在于进一步提升ADX指标的捕捉精准度。可以考虑引入机器学习等方法,训练模型判断ADX变化后的概率分布。另外也可以尝试不同参数组合、其他辅助指标等方法进行测试优化。
总结
该动态上升ADX趋势跟踪策略,通过捕捉ADX快速上升的市场变化点,实现对趋势的及时跟踪。最大优势是时间上极其敏捷,可有效把握趋势早期。同时也存在一定概率的误判风险,后续仍需持续优化测试。
||
Overview
This strategy tracks the dynamic changes of the ADX indicator to capture the early shifts in market trends for timely trend following. When ADX rises quickly from low levels, it signals a trend is forming which presents a great opportunity to enter. With the assistance of moving averages, it can filter out false signals effectively.
Strategy Logic
The core of this strategy lies in judging trend development based on the dynamic changes of the ADX indicator. Low ADX signifies small fluctuations in trends. When ADX rises swiftly from low levels, it signals a trend is forming. The strategy captures trend emergence by monitoring the sharp increase of ADX.
Specifically, the entry signal consists of the following factors:
- ADX crosses above a threshold (e.g. 10)
- ADX rises swiftly upwards
- Price crosses above Simple or Exponential Moving Average
When all conditions above are met, it signals an uptrend is forming to go long. When price falls below moving averages, close positions. Two moving averages are used to judge trends more precisely.
The stop loss logic is similar. Go short when ADX drops swiftly, and close positions when price rises above moving averages.
Advantage Analysis
The biggest edge here is the timely capturing of emerging trends. The conventional way of looking at absolute ADX values often requires confirmation above 20 or 25 to call a trend, thus missing the optimal entry timing. This strategy grasps the trend's early development by tracking the swift rise of ADX.
Moreover, the moving averages help filter out false signals effectively, enhancing the stability of the strategy.
Risk and Optimization Analysis
The biggest risk comes from the lagging nature of the ADX itself. Despite catching the swift rise to reduce the lag, there is still some delay. This causes missing out on some rapidly reversing markets.
Also, ADX does not perfectly judge trends and inevitably misdiagnoses them from time to time. The moving averages filter out some noise but need further optimization.
There is still large room for optimizing this strategy, mainly enhancing ADX's accuracy in capturing trends. Methods like machine learning can be explored, training models to forecast probability distribution based on ADX changes. Other aspects like parameter tuning, additional indicators etc. can also be tested.
Conclusion
This dynamic rising ADX trend following strategy captures trend shifts swiftly by identifying sharp ADX rises, thus following trends in a timely manner. The biggest advantage is its agility in time, effectively seizing early trend developments. Meanwhile, certain risks of misjudgment remain that call for continuous optimization and testing.
[/trans]
Strategy Arguments
| Argument | Default | Description |
|---|---|---|
| v_input_1 | 14 | ADX Length |
| v_input_2 | 10 | threshold |
| v_input_3 | 2 | 1=SMA, 2=EMA, 3=WMA, 4=HullMA |
| v_input_4 | 20 | Moving average 1 |
| v_input_5 | 2 | 1=SMA, 2=EMA, 3=WMA, 4=HullMA |
| v_input_6 | 20 | Moving average 2 |
| v_input_7 | true | Long side |
| v_input_8 | true | Short side |
Source (PineScript)
/*backtest
start: 2023-12-03 00:00:00
end: 2023-12-10 00:00:00
period: 1h
basePeriod: 15m
exchanges: [{"eid":"Futures_Binance","currency":"BTC_USDT"}]
*/

// This source code is subject to the terms of the Mozilla Public License 2.0 at https://mozilla.org/MPL/2.0/
// © dhilipthegreat

//@version=4
//Rising ADX strategy

strategy(title="Rising ADX strategy", overlay=false)

adxlen = input(14, title="ADX Length", minval=1)
threshold = input(10, title="threshold", minval=5)

hline(threshold, color=color.black, linestyle=hline.style_dashed)

atype = input(2,minval=1,maxval=7,title="1=SMA, 2=EMA, 3=WMA, 4=HullMA")
malen=input(20, title="Moving average 1 ",minval=1, maxval=50)
avg = atype == 1 ? sma(close,malen) : atype == 2 ? ema(close,malen) : atype == 3 ? wma(close,malen) : atype == 4 ? hma(close,malen) : na

atype2 = input(2,minval=1,maxval=7,title="1=SMA, 2=EMA, 3=WMA, 4=HullMA")
malen2=input(20, title="Moving average 2",minval=1, maxval=200)
avg2 = atype2 == 1 ? sma(close,malen2) : atype2 == 2 ? ema(close,malen2) : atype2 == 3 ? wma(close,malen2) : atype2 == 4 ? hma(close,malen2) : na

//ADX&DI
dilen = 14
dirmov(len,_high,_low,_tr) =>
	up = change(_high)
	down = -change(_low)
	plusDM = na(up) ? na : (up > down and up > 0 ? up : 0)
    minusDM = na(down) ? na : (down > up and down > 0 ? down : 0)
	truerange = rma(_tr, len)

	plus = fixnan(100 * rma(plusDM, len) / truerange)
	minus = fixnan(100 * rma(minusDM, len) / truerange)

	[plus, minus]

adx(dilen, adxlen,_high,_low,_tr) =>
	[plus, minus] = dirmov(dilen,_high,_low,_tr)
	sum = plus + minus
	adx = 100 * rma(abs(plus - minus) / (sum == 0 ? 1 : sum), adxlen)

[plus, minus] = dirmov(dilen,high,low,tr)
sig = adx(dilen, adxlen,high,low,tr)
prev_sig = adx(dilen, adxlen,high[1],low[1],tr)
plot(sig ? sig : na, color = rising(sig, 1) ? color.lime : falling(sig, 1) ? color.orange : color.purple, title="ADX",linewidth=2)

//////
longCondition=  sig > threshold  and rising(sig, 1) and falling(prev_sig, 1) and close > avg and close > avg2
barcolor(longCondition ? color.yellow: na)
Long_side = input(true, "Long side")
if Long_side
    strategy.entry(id="Long", long=true,  when= longCondition  and strategy.position_size<1)
    exitCondition=  (rising(prev_sig, 1) and falling(sig, 1)) or close < avg and close < avg2
    strategy.close(id="Long",comment="L exit",    qty=strategy.position_size ,   when= exitCondition)   //close all

shortCondition=  sig > threshold  and rising(sig, 1) and falling(prev_sig, 1) and close < avg and close < avg2
barcolor(shortCondition ? color.gray: na)
Short_side = input(true, "Short side")
if Short_side
    strategy.entry(id="Short", long=false,  when= shortCondition  and strategy.position_size<1)
    sell_exitCondition=  (rising(prev_sig, 1) and falling(sig, 1)) or close > avg and close > avg2
    strategy.close(id="Short",comment="S exit",    qty=strategy.position_size ,   when= sell_exitCondition)   //close all

barcolor(strategy.position_size>1 ? color.lime: na)
bgcolor(strategy.position_size>1 ? color.lime: na)

barcolor(strategy.position_size<0 ? color.orange: na)
bgcolor(strategy.position_size<0 ? color.orange: na)
Detail
https://www.fmz.com/strategy/435020
Last Modified
2023-12-11 17:18:32