
9.4 KiB
Name
动向指数平均线交叉ADX交易策略ADX-Crossover-Trend-Trading-Strategy
Author
ChaoZhang
Strategy Description
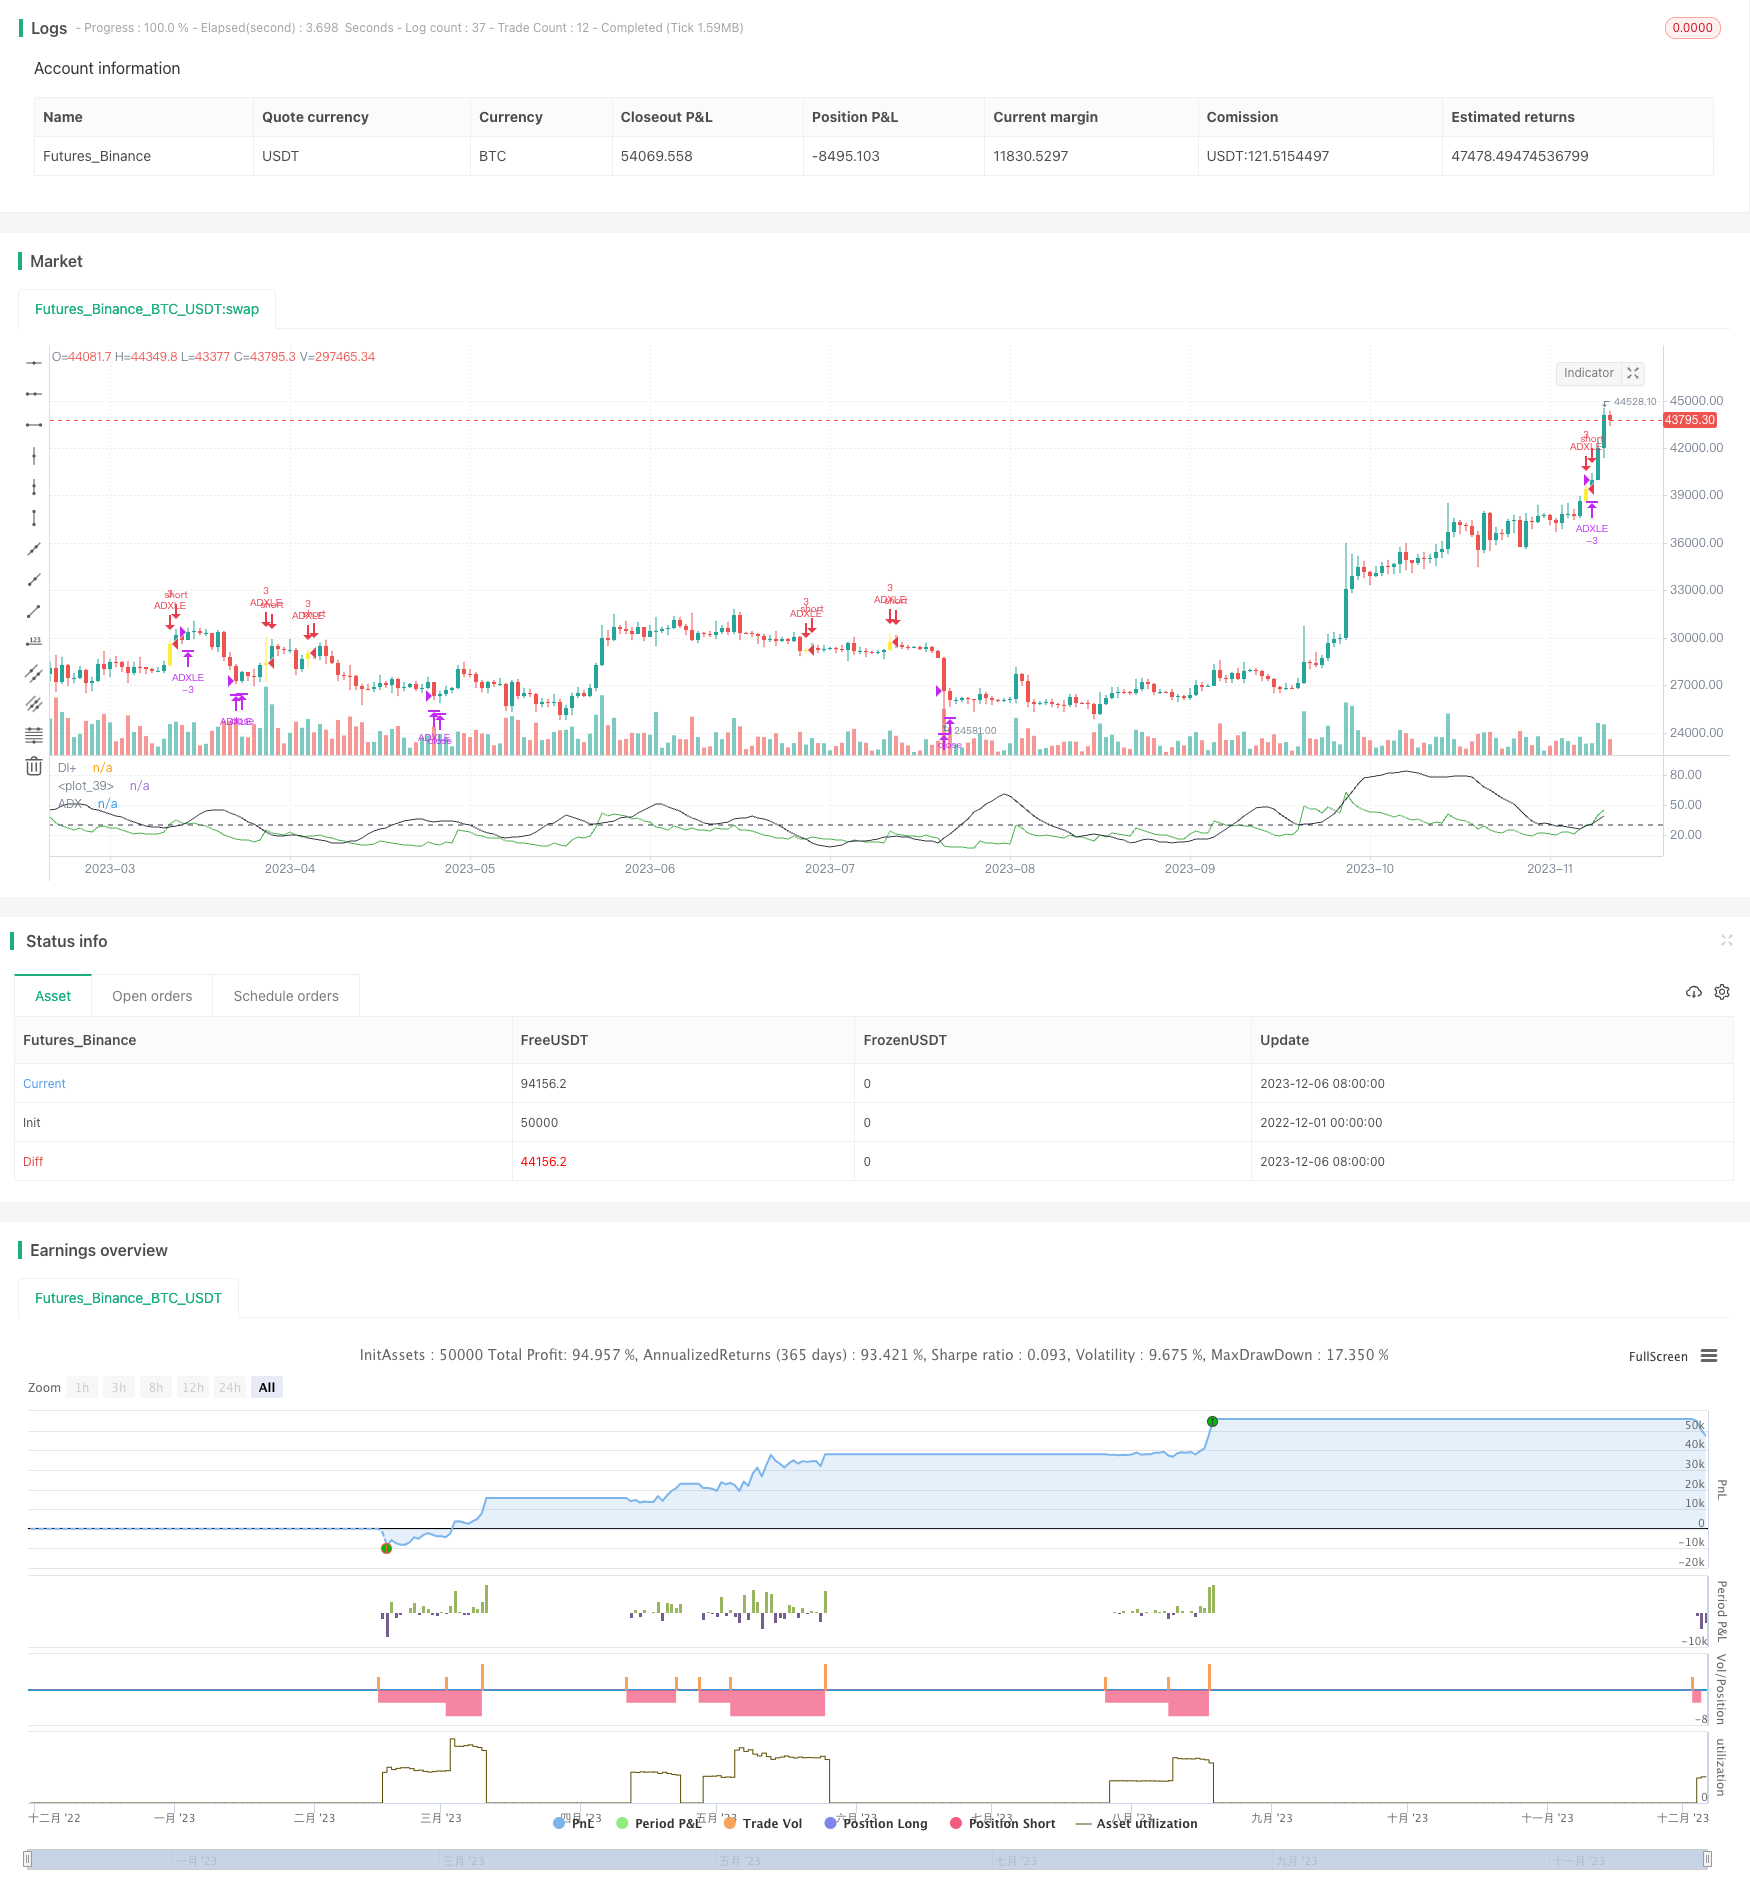 [trans]
概述
该策略结合使用动向指数平均线(ADX)指标和向上指向运动指数(DI+)为判断市场方向和趋势提供依据,同时运用快速和慢速移动平均线来确定交易方向和持有时间,属于趋势跟踪型交易策略。该策略可以有效捕捉中短线的反转点,在低波动率和趋势明显的市场中表现较佳。
原理
该策略核心逻辑为,当+DI线从下方向上突破ADX时产生买入信号,而当+DI线从上方向下跌破ADX时产生卖出信号。因此,该策略依赖于DI和ADX指标之间的交叉来判断市场趋势和反转点。同时,快慢均线的关系被用来判断整体市场趋势,只有当快速EMA高于慢速EMA时才会考虑产生交易信号。
具体来说,当满足以下条件时,会发出买入信号: 1、快速EMA高于慢速EMA 2、+DI线从下方向上突破ADX线 3、ADX值低于30的阈值水平
当满足以下条件时,会发出卖出信号: 1、ADX值高于30的阈值水平 2、+DI线从上方向下跌破ADX线
该策略还加入了止损逻辑,当价格低于止损价位时会退出所有头寸。
优势
该策略结合DI、ADX和均线指标,可有效判断市场趋势转折点。具有以下优势:
- 利用DI和ADX指标判断趋势反转信号,精准定位入场和出场点位
- 快慢EMA过滤系统提供大趋势判断,避免错误交易
- 采用ADX值判断趋势强弱,只在趋势较弱时交易,规避假突破风险
- 加入止损机制控制下行风险
- 入场条件严格,避免追高买入和agiri卖出的风险
- 出场条件清晰,及时止损和止盈
风险
该策略也存在一些风险需要注意:
- ADX指标存在滞后性,可能错过价格反转的最佳时点
- 当市场震荡较大时,ADX和DI指标会产生更多错误信号
- 快慢均线设置不当可能导致错失交易机会或错误过滤信号
- 止损价位设定过于宽松,无法有效控制风险
针对这些风险,可以通过优化ADX和均线参数,调整止损水平,结合其他指标确认信号等方法进行改进。
优化方向
该策略还有进一步优化的空间:
- 可以测试不同长度周期的ADX,寻找最佳参数组合
- 可以添加其他指标,如RSI、布林带等来确认交易信号
- 可以基于机器学习算法自动寻优参数组合和交易规则
- 可以通过动态调整止损水平来对冲尾盘风险
- 可以建立多因子评分模型,使入场和出场规则更加稳健
总结
该ADX交叉趋势策略整体来说较为稳定,在波动前期能够有效捕捉反转空间,但需要注意控制风险。通过进一步优化参数设定、严格入场与止损规则等方式,可以获得较好的风险调整后收益。该策略适用于长线持有中短线交易账户。
||
Overview
This strategy combines Directional Movement Index (ADX), Plus Directional Indicator (DI+) and fast and slow moving averages to determine market direction and holding period. It belongs to trend-following trading strategies. The strategy can effectively capture reversal points on medium and short terms and performs well in low volatility and obvious trending markets.
Principles
The core logic of this strategy is to generate buy signals when the +DI line crosses above the ADX line from the bottom up, and generate sell signals when the +DI line crosses below the ADX line from the top down. Therefore, this strategy relies on the crossover between DI and ADX to determine market trends and reversal points. At the same time, the relationship between fast and slow moving averages is used to determine the overall market trend. Trading signals will only be considered when the fast EMA is above the slow EMA.
Specifically, a buy signal will be triggered when the following conditions are met:
- Fast EMA is above slow EMA
- +DI line crosses ADX line upward
- ADX value is below 30 threshold
A sell signal will be triggered when the following conditions are met:
- ADX value exceeds 30 threshold
- +DI line crosses ADX line downward
The strategy also incorporates stop loss logic to exit all positions when the price falls below the stop loss level.
Advantages
The strategy combines DI, ADX and moving average indicators to effectively determine turns in market trends. The main advantages are:
- Utilize DI and ADX crossovers to accurately determine entry and exit points
- Fast and slow EMA filter system to determine overall market trend, avoiding bad trades
- Use ADX values to determine trend strength, only trading when trend is weak, avoiding false breakouts
- Incorporate stop loss mechanism to control downside risk
- Strict entry conditions avoid buying tops and selling bottoms
- Clear exit rules allow for timely stop losses and profit taking
Risks
There are some risks to note with this strategy:
- ADX indicator has lagging effect, could miss best timing for price reversals
- More false signals may occur when market volatility is high
- Improper fast and slow EMA settings could lead to missing trades or filtering valid signals
- Stop loss level set too wide fails to effectively control risk
These risks can be addressed through optimizing ADX and moving average parameters, adjusting stop loss level, adding filters for confirmation etc.
Enhancement Opportunities
There is room for further enhancements:
- Test ADX of different length periods to find optimal combinations
- Add other indicators like RSI, Bollinger Bands for signal confirmation
- Utilize machine learning algorithms to automatically optimize parameters and rules
- Dynamically adjust stop loss levels to mitigate late stage risks
- Build multifactor scoring model to make entry and exit criteria more robust
Conclusion
In general this ADX crossover trend strategy is quite stable, able to effectively capture reversals early on, but risk control is critical. Further optimizing parameters, strictly following entry rules and stop loss can lead to good risk-adjusted returns. The strategy suits long-term accounts holding medium to short term positions.
[/trans]
Strategy Arguments
| Argument | Default | Description |
|---|---|---|
| v_input_1 | 11 | ADX Length |
| v_input_2 | 30 | threshold |
| v_input_3 | 13 | Fast EMA |
| v_input_4 | 55 | Slow EMA |
| v_input_5 | 8 | Stop Loss |
Source (PineScript)
/*backtest
start: 2022-12-01 00:00:00
end: 2023-12-07 00:00:00
period: 1d
basePeriod: 1h
exchanges: [{"eid":"Futures_Binance","currency":"BTC_USDT"}]
*/

// This source code is subject to the terms of the Mozilla Public License 2.0 at https://mozilla.org/MPL/2.0/
// © mohanee

//@version=4
//ADX strategy
SmoothedTrueRange=0.00
SmoothedDirectionalMovementPlus=0.00
SmoothedDirectionalMovementMinus=0.00


strategy(title="ADX strategy", overlay=false,pyramiding=3, default_qty_type=strategy.fixed, default_qty_value=3,    initial_capital=10000, currency=currency.USD)

len = input(11, title="ADX Length", minval=1)
threshold = input(30, title="threshold", minval=5)

fastEma=input(13, title="Fast EMA",minval=1, maxval=50)
slowEma=input(55, title="Slow EMA",minval=10, maxval=200)
stopLoss =input(8, title="Stop Loss",minval=1)   //


TrueRange = max(max(high-low, abs(high-nz(close[1]))), abs(low-nz(close[1])))
DirectionalMovementPlus = high-nz(high[1]) > nz(low[1])-low ? max(high-nz(high[1]), 0): 0
DirectionalMovementMinus = nz(low[1])-low > high-nz(high[1]) ? max(nz(low[1])-low, 0): 0


SmoothedTrueRange:= nz(SmoothedTrueRange[1]) - (nz(SmoothedTrueRange[1])/len) + TrueRange

SmoothedDirectionalMovementPlus := nz(SmoothedDirectionalMovementPlus[1]) - (nz(SmoothedDirectionalMovementPlus[1])/len) + DirectionalMovementPlus
SmoothedDirectionalMovementMinus:= nz(SmoothedDirectionalMovementMinus[1]) - (nz(SmoothedDirectionalMovementMinus[1])/len) + DirectionalMovementMinus

DIPlus = SmoothedDirectionalMovementPlus / SmoothedTrueRange * 100
DIMinus = SmoothedDirectionalMovementMinus / SmoothedTrueRange * 100
DX = abs(DIPlus-DIMinus) / (DIPlus+DIMinus)*100
ADX = sma(DX, len)

plot(DIPlus, color=color.green, title="DI+")
//plot(DIMinus, color=color.red, title="DI-")
plot(ADX, color=color.black, title="ADX")
hline(threshold, color=color.black, linestyle=hline.style_dashed)

fastEmaVal=ema(close,fastEma)
slowEmaVal=ema(close,slowEma)


//long condition
longCondition=  ADX < threshold  and crossover(DIPlus,ADX)  and fastEmaVal > slowEmaVal


barcolor(longCondition ? color.yellow: na)

strategy.entry(id="ADXLE", long=true,  when= longCondition  and strategy.position_size<1)

barcolor(strategy.position_size>1 ? color.blue: na)
bgcolor(strategy.position_size>1 ? color.blue: na)


//Add
strategy.entry(id="ADXLE", comment="Add", long=true,  when= strategy.position_size>1 and close<strategy.position_avg_price and crossover(DIPlus,ADX) )


//calculate stop Loss
stopLossVal =  strategy.position_avg_price -  (strategy.position_avg_price*stopLoss*0.01)

strategy.close(id="ADXLE",comment="SL Exit",    when=close<stopLossVal)   //close all on stop loss


//exit condition
exitCondition=  ADX > threshold  and crossunder(DIPlus,ADX) // and fastEmaVal > slowEmaVal
strategy.close(id="ADXLE",comment="TPExitAll",    qty=strategy.position_size ,   when= exitCondition)   //close all
Detail
https://www.fmz.com/strategy/434707
Last Modified
2023-12-08 15:49:12