
14 KiB
Name
低频傅里叶变换趋势跟踪移动平均线策略Low-Frequency-Fourier-Transform-Trend-Following-Moving-Average-Strategy
Author
ChaoZhang
Strategy Description
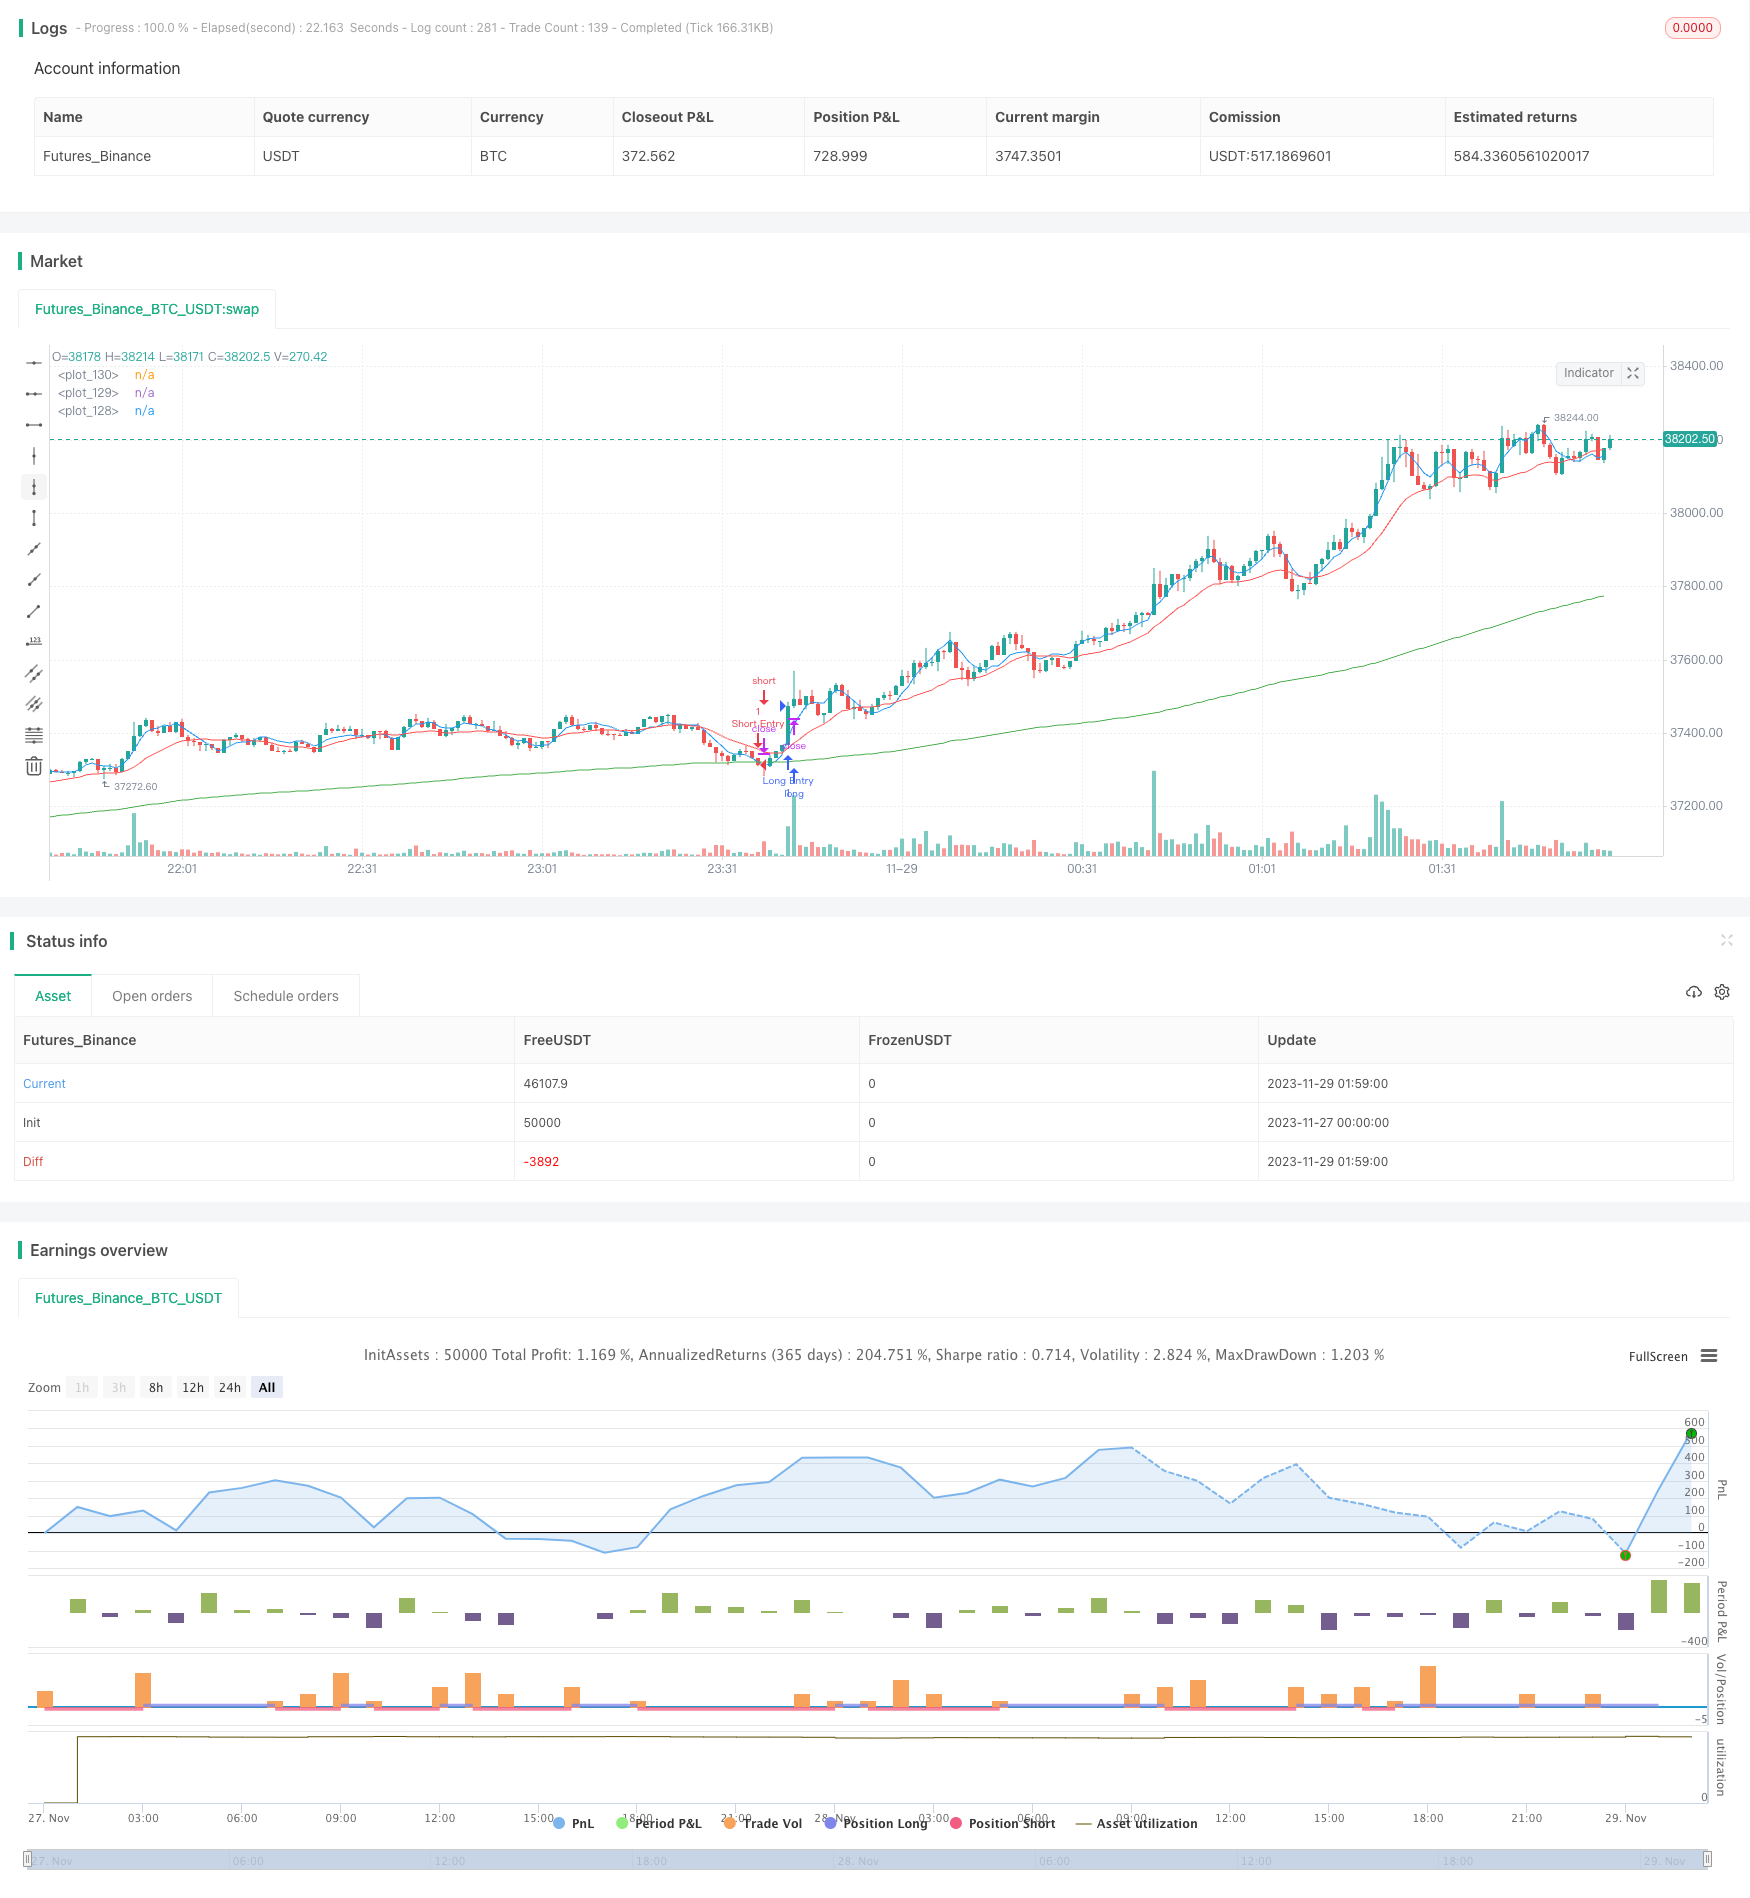 [trans]
概述
该策略是一种趋势跟踪策略,它利用低频傅立叶变换提取价格序列中的低频趋势成分,结合快中慢三条移动平均线实现趋势识别和交易信号生成。当快速MA上穿中速MA且价格高于慢速MA时做多,当快速MA下穿中速MA且价格低于慢速MA时做空。该策略适合追踪中长线趋势。
策略原理
-
使用低频傅里叶变换提取价格序列的低频趋势成分。低频傅里叶变换可以有效过滤高频噪音,使得提取到的趋势信号更加平稳。
-
快中慢三条移动平均线进行趋势判断。其中慢速MA为200周期,中速MA为20周期,快速MA为5周期。慢速MA过滤噪声,中速MA捕捉趋势转折,快速MA发出交易信号。
-
当快速MA上穿中速MA且价格高于慢速MA时,判断行情进入上升趋势,做多;当快速MA下穿中速MA且价格低于慢速MA时,判断行情进入下降趋势,做空。
-
该策略是一个趋势跟踪策略,当判断进入趋势后,会尽可能长时间持有头寸,争取在趋势中获利。
优势分析
-
使用低频傅里叶变换有效过滤了高频噪声,使得识别的趋势信号更加可靠平稳。
-
采用快中慢MA有效判断了市场趋势的转折,避免了虚假信号。慢MA参数设置较大,有效过滤了噪声。
-
该策略追踪中长线趋势有明显优势。当判断行情进入趋势后,会持续加仓跟踪趋势,从而获得超额收益。
-
该策略参数优化空间大,用户可以根据不同品种和周期进行参数调整,适应性强。
风险分析
-
作为趋势跟踪策略,该策略无法有效判断和反应突发事件引发的趋势反转,可能导致亏损加剧。
-
在震荡行情中,该策略会产生较多获利交易和损失交易。但最终仍有可能盈利,需要有一定的心理承受能力。
-
传统趋势跟踪策略容易形成“钝化”,从趋势中提前离场是该策略需要解决的问题。
-
可以设置止损来控制单笔损失。也可以在回测中加入突发事件的测试,评估策略的抗风险能力。
优化方向
-
尝试不同的移动平均线算法,适应更多品种和周期。
-
增加止损、连续亏损退出等止损策略,控制风险。
-
增加趋势强度指标,避免在震荡和弱趋势中出现过多交易。
-
增加机器学习模型判断趋势转折,使策略对突发事件有一定的适应能力。
总结
该低频傅里叶变换趋势跟踪移动平均线策略,具有过滤噪声、识别趋势、追踪趋势的优势,适合中长线持有。作为趋势跟踪策略,它主要面临着趋势反转和持续震荡的风险。这些风险都有一定的应对策略。总的来说,该策略参数空间大,优化潜力高,适合有一定策略开发和风险控制能力的投资人实盘验证。
||
Overview
This strategy is a trend following strategy that uses low frequency Fourier transform to extract the low frequency trend components from the price series and combines three moving averages (fast, medium and slow) to identify trends and generate trading signals. It goes long when the fast MA crosses above the medium MA and the price is above the slow MA, and goes short when the fast MA crosses below the medium MA and the price is below the slow MA. This strategy is suitable for tracking medium- and long-term trends.
Strategy Logic
-
Use low frequency Fourier transform to extract the low frequency trend components from the price series. The low frequency Fourier transform can effectively filter out high frequency noise, making the extracted trend signals smoother.
-
Use three moving averages (fast, medium and slow) to judge trends. The slow MA has a period of 200, the medium MA has a period of 20, and the fast MA has a period of 5. The slow MA filters out noise, the medium MA captures trend reversals, and the fast MA generates trading signals.
-
When the fast MA crosses above the medium MA and the price is above the slow MA, the market is judged to be entering an upward trend, go long. When the fast MA crosses below the medium MA and the price is below the slow MA, the market is judged to be entering a downward trend, go short.
-
This is a trend following strategy. Once a trend is identified, it will try to hold the position as long as possible to profit from the trend.
Advantage Analysis
-
The use of low frequency Fourier transform effectively filters out high frequency noise, making the identified trend signals more reliable and stable.
-
The adoption of fast, medium and slow MAs effectively judges the reversal of market trends and avoids false signals. The large parameter setting of the slow MA effectively filters out noise.
-
This strategy has significant advantages in tracking medium- and long-term trends. Once a trend is identified, it will continue to add positions to track the trend, thus obtaining excess returns.
-
This strategy has large parameter optimization space. Users can adjust parameters according to different varieties and cycles to improve adaptability.
Risk Analysis
-
As a trend following strategy, this strategy cannot effectively determine and react to trend reversals caused by sudden events, which may lead to increased losses.
-
In oscillating markets, this strategy will generate more profitable and losing trades. But it can still be profitable eventually, requiring some psychological endurance.
-
Traditional trend following strategies tend to "dull", exiting trends prematurely is a problem that this strategy needs to solve.
-
Stop loss can be set to control single loss. Sudden event tests can also be included in backtesting to assess the risk resistance of the strategy.
Optimization Directions
-
Try different moving average algorithms to adapt more varieties and cycles.
-
Add stop loss, consecutive loss exit and other stop loss strategies to control risks.
-
Add trend strength indicators to avoid too many transactions in oscillating and weak trend markets.
-
Add machine learning models to judge trend reversals, making the strategy somewhat adaptive to sudden events.
Summary
This low frequency Fourier transform trend following moving average strategy has the advantages of filtering noise, identifying trends, and tracking trends. It is suitable for medium- and long-term holding. As a trend following strategy, it mainly faces the risks of trend reversal and sustained oscillation. There are coping strategies for these risks. In general, this strategy has large parameter space and high optimization potential. It is suitable for investors with certain strategy development and risk control capabilities to verify in live trading.
[/trans]
Strategy Arguments
| Argument | Default | Description |
|---|---|---|
| v_input_1_close | 0 | Source: close |
| v_input_2 | 200 | Slow MA period |
| v_input_3 | 20 | Mid MA period |
| v_input_4 | 5 | Fast MA period |
| v_input_5 | true | Use MA |
| v_input_6 | true | First sinusoid |
| v_input_7 | 2 | Second sinusoid |
| v_input_8 | 3 | Third sinusoid |
| v_input_9 | 0 | MA Type: EMA |
| v_input_10 | false | Use linear regression? |
| v_input_11 | 13 | Linear regression lenght |
| v_input_12 | false | Linear regression offset |
| v_input_13 | 0 | Lookback Period: 64 |
| v_input_14 | false | Take Profit Points |
| v_input_15 | false | Stop Loss Points |
| v_input_16 | false | Trailing Stop Loss Points |
| v_input_17 | false | Trailing Stop Loss Offset Points |
Source (PineScript)
/*backtest
start: 2023-11-27 00:00:00
end: 2023-11-29 02:00:00
period: 1m
basePeriod: 1m
exchanges: [{"eid":"Futures_Binance","currency":"BTC_USDT"}]
*/

// This source code is subject to the terms of the Mozilla Public License 2.0 at https://mozilla.org/MPL/2.0/
// © 03.freeman

//@version=4
strategy("FTSMA", overlay=true )
src=input(close,"Source")
slowMA=input(200,"Slow MA period")
mediumMA=input(20,"Mid MA period")
fastMA=input(5,"Fast MA period")
plotSMA=input(true,"Use MA")
sin1=input(1,"First sinusoid",minval=1)
sin2=input(2,"Second sinusoid",minval=1)
sin3=input(3,"Third sinusoid",minval=1)
smoothinput = input('EMA', title = "MA Type", options =['EMA', 'SMA', 'ALMA','FRAMA','RMA', 'SWMA', 'VWMA','WMA','LinearRegression'])
linearReg=input(false, "Use linear regression?")
linregLenght=input(13, "Linear regression lenght")
linregOffset=input(0, "Linear regression offset")

//------FRAMA ma---------
ma(src, len) =>
    float result = 0
    int len1 = len/2
    frama_SC=200
    frama_FC=1
    e = 2.7182818284590452353602874713527
    w = log(2/(frama_SC+1)) / log(e) // Natural logarithm (ln(2/(SC+1))) workaround
    H1 = highest(high,len1)
    L1 = lowest(low,len1)
    N1 = (H1-L1)/len1
    H2_ = highest(high,len1)
    H2 = H2_[len1]
    L2_ = lowest(low,len1)
    L2 = L2_[len1]
    N2 = (H2-L2)/len1
    H3 = highest(high,len)
    L3 = lowest(low,len)
    N3 = (H3-L3)/len
    dimen1 = (log(N1+N2)-log(N3))/log(2)
    dimen = iff(N1>0 and N2>0 and N3>0,dimen1,nz(dimen1[1]))
    alpha1 = exp(w*(dimen-1))
    oldalpha = alpha1>1?1:(alpha1<0.01?0.01:alpha1)
    oldN = (2-oldalpha)/oldalpha
    N = (((frama_SC-frama_FC)*(oldN-1))/(frama_SC-1))+frama_FC
    alpha_ = 2/(N+1)
    alpha = alpha_<2/(frama_SC+1)?2/(frama_SC+1):(alpha_>1?1:alpha_)
    frama = 0.0
    frama :=(1-alpha)*nz(frama[1]) + alpha*src
    result := frama
    result

// ----------MA calculation - ChartArt and modified by 03.freeman-------------
calc_ma(src,l) =>
    _ma = smoothinput=='SMA'?sma(src, l):smoothinput=='EMA'?ema(src, l):smoothinput=='WMA'?wma(src, l):smoothinput=='LinearRegression'?linreg(src, l,0):smoothinput=='VWMA'?vwma(src,l):smoothinput=='RMA'?rma(src, l):smoothinput=='ALMA'?alma(src,l,0.85,6):smoothinput=='SWMA'?swma(src):smoothinput=='FRAMA'?ma(sma(src,1),l):na

//----------------------------------------------


//pi = acos(-1)
// Approximation of Pi in _n terms --- thanks to e2e4mfck
f_pi(_n) =>
    _a = 1. / (4. * _n + 2)
    _b = 1. / (6. * _n + 3)
    _pi = 0.
    for _i = _n - 1 to 0
        _a := 1 / (4. * _i + 2) - _a / 4.
        _b := 1 / (6. * _i + 3) - _b / 9.
    _pi := (4. * _a) + (4. * _b) - _pi
pi=f_pi(20)

//---Thanks to xyse----https://www.tradingview.com/script/UTPOoabQ-Low-Frequency-Fourier-Transform/
//Declaration of user-defined variables
N = input(defval=64, title="Lookback Period", type=input.integer, minval=2, maxval=600, confirm=false, step=1, options=[2,4,8,16,32,64,128,256,512,1024,2048,4096])

//Real part of the Frequency Domain Representation
ReX(k) =>
    sum = 0.0
    for i=0 to N-1
        sum := sum + src[i]*cos(2*pi*k*i/N)
    return = sum

//Imaginary part of the Frequency Domain Representation
ImX(k) =>
    sum = 0.0
    for i=0 to N-1
        sum := sum + src[i]*sin(2*pi*k*i/N)
    return = -sum

//Get sinusoidal amplitude from frequency domain
ReX_(k) =>
    case = 0.0
    if(k!=0 and k!=N/2)
        case := 2*ReX(k)/N
    if(k==0)
        case := ReX(k)/N
    if(k==N/2)
        case := ReX(k)/N
    return = case

 //Get sinusoidal amplitude from frequency domain
ImX_(k) =>
    return = -2*ImX(k)/N

//Get full Fourier Transform
x(i, N) =>
    sum1 = 0.0
    sum2 = 0.0
    for k=0 to N/2
        sum1 := sum1 + ReX_(k)*cos(2*pi*k*i/N)
    for k=0 to N/2
        sum2 := sum2 + ImX_(k)*sin(2*pi*k*i/N)
    return = sum1+sum2

//Get single constituent sinusoid
sx(i, k) =>
    sum1 = ReX_(k)*cos(2*pi*k*i/N)
    sum2 = ImX_(k)*sin(2*pi*k*i/N)
    return = sum1+sum2
//Calculations for strategy
SLOWMA = plotSMA?calc_ma(close+sx(0,sin1),slowMA):close+sx(0,sin1)
MEDMA = plotSMA?calc_ma(close+sx(0,sin2),mediumMA):close+sx(0,sin2)
FASTMA = plotSMA?calc_ma(close+sx(0,sin3),fastMA):close+sx(0,sin3)

SLOWMA := linearReg?linreg(SLOWMA,linregLenght,linregOffset):SLOWMA
MEDMA := linearReg?linreg(MEDMA,linregLenght,linregOffset):MEDMA
FASTMA := linearReg?linreg(FASTMA,linregLenght,linregOffset):FASTMA

//Plot 3 Low-Freq Sinusoids
plot(SLOWMA, color=color.green)
plot(MEDMA, color=color.red)
plot(FASTMA, color=color.blue)

//  Strategy: (Thanks to JayRogers)
// === STRATEGY RELATED INPUTS ===
// the risk management inputs
inpTakeProfit   = input(defval = 0, title = "Take Profit Points", minval = 0)
inpStopLoss     = input(defval = 0, title = "Stop Loss Points", minval = 0)
inpTrailStop    = input(defval = 0, title = "Trailing Stop Loss Points", minval = 0)
inpTrailOffset  = input(defval = 0, title = "Trailing Stop Loss Offset Points", minval = 0)

// === RISK MANAGEMENT VALUE PREP ===
// if an input is less than 1, assuming not wanted so we assign 'na' value to disable it.
useTakeProfit   = inpTakeProfit  >= 1 ? inpTakeProfit  : na
useStopLoss     = inpStopLoss    >= 1 ? inpStopLoss    : na
useTrailStop    = inpTrailStop   >= 1 ? inpTrailStop   : na
useTrailOffset  = inpTrailOffset >= 1 ? inpTrailOffset : na

longCondition = FASTMA>MEDMA and close > SLOWMA             //crossover(FASTMA, MEDMA) and close > SLOWMA
if (longCondition)
    strategy.entry("Long Entry", strategy.long)

shortCondition = FASTMA<MEDMA and close < SLOWMA            //crossunder(FASTMA, MEDMA) and close < SLOWMA
if (shortCondition)
    strategy.entry("Short Entry", strategy.short)

// === STRATEGY RISK MANAGEMENT EXECUTION ===
// finally, make use of all the earlier values we got prepped
strategy.exit("Exit Buy", from_entry = "Long Entry", profit = useTakeProfit, loss = useStopLoss, trail_points = useTrailStop, trail_offset = useTrailOffset)
strategy.exit("Exit Sell", from_entry = "Short Entry", profit = useTakeProfit, loss = useStopLoss, trail_points = useTrailStop, trail_offset = useTrailOffset)
Detail
https://www.fmz.com/strategy/434326
Last Modified
2023-12-05 14:56:06