
10 KiB
Name
价格震荡突破策略Volatility-Breakthrough-Strategy
Author
ChaoZhang
Strategy Description
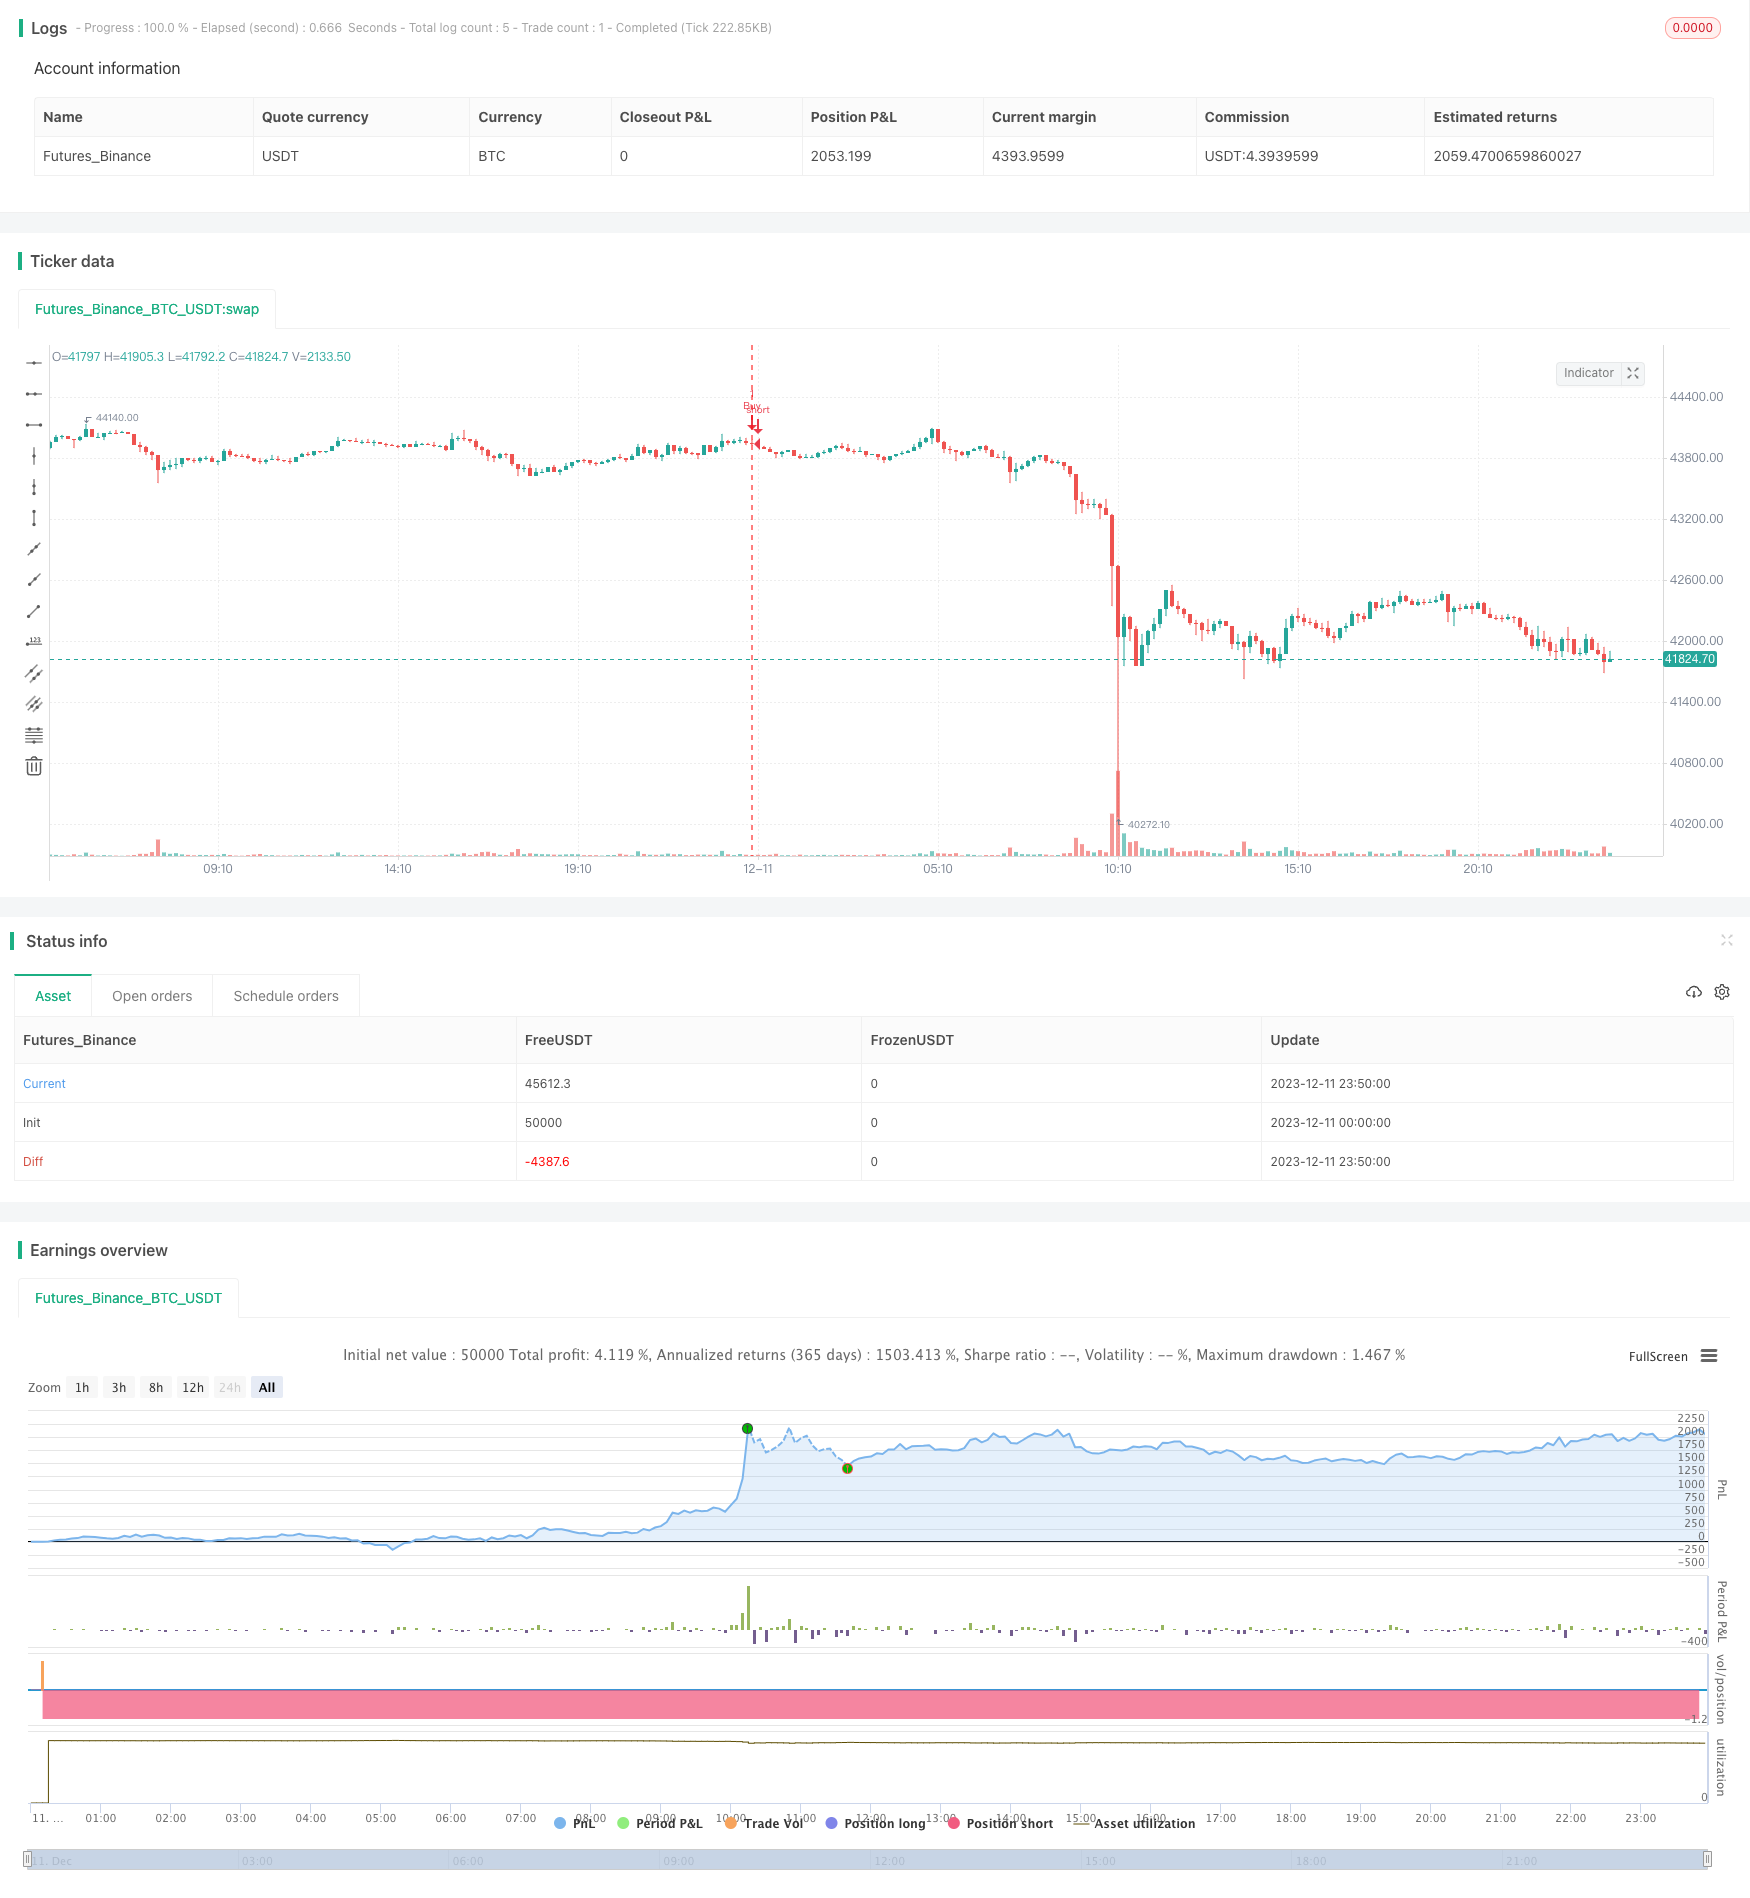 [trans]
概述
震荡突破策略是一个利用价格震荡形态,在价格突破关键支撑或阻力位时进行买卖操作的策略。该策略结合多种技术指标识别关键交易机会。
策略原理
该策略主要基于布林带中线、48日简单移动平均线(SMA)、MACD和ADX四个技术指标。具体逻辑是:
-
当收盘价上穿或下穿48日SMA时,考虑交易机会;
-
当收盘价突破布林带中线时,作为进场信号;
-
MACD要大于或小于0,作为确定趋势方向的辅助指标;
-
ADX要大于25,以过滤掉非趋势行情。
满足以上四个条件时,做多或做空。
策略优势
这是一个结合趋势和震荡指标的策略。其主要优势有:
-
48日SMA过滤掉过度频繁交易,锁定中长线趋势;
-
布林带中线突破把握关键支撑阻力突破点,具有很强的止损功能;
-
MACD判断大趋势方向,避免逆势交易;
-
ADX过滤非趋势市场,提高策略胜率。
综上,该策略在控制交易频率、把握关键点、判断趋势和过滤无效行情等多个方面做了优化,胜率较高。
策略风险
该策略主要存在以下风险:
-
震荡市场中,布林带中线频繁触发交易机会,可能过度交易;
-
ADX指标在判断趋势和无效行情时,也存在一定误差;
-
回撤风险较大,适合有一定风险承受能力的投资者。
策略优化
该策略可从以下几个方面进行进一步优化:
-
增加ATR指标,设定止损位,减小单笔止损;
-
优化布林带参数,降低中线触发频率;
-
增加交易量或趋势强度指标判断趋势强弱,避免弱势逆转。
总结
综上所述,该震荡突破策略整体较为成熟,有效把握震荡行情中的关键交易点。它结合趋势和震荡指标,把握风险与收益之间的平衡。通过进一步优化,可望获得更稳定的超额收益。
||
Overview
The Volatility Breakthrough Strategy is a strategy that makes buy and sell operations when prices break through key support or resistance levels in volatility patterns. This strategy combines multiple technical indicators to identify key trading opportunities.
Strategy Principle
This strategy is mainly based on Bollinger Middle Band, 48-day Simple Moving Average (SMA), MACD and ADX four technical indicators. The specific logic is:
-
Consider trading opportunities when closing price crosses above or below 48-day SMA;
-
When closing price breaks through Bollinger Middle Band, it serves as entry signal;
-
MACD greater than or less than 0, serves as an auxiliary indicator to determine trend direction;
-
ADX greater than 25 to filter out non-trending markets.
When the above four conditions are met, go long or go short.
Advantages of the Strategy
This is a strategy that combines trend and volatility indicators. Its main advantages are:
-
48-day SMA filters out excessively frequent trading and locks in medium-long term trends;
-
Bollinger Middle Band breakout grasps key support/resistance breakout points with strong stop loss function;
-
MACD judges the direction of major trends, avoiding trading against the trend;
-
ADX filters non-trending markets and improves win rate of the strategy.
In summary, this strategy has made optimizations in controlling trading frequency, grasping key points, determining trend direction and filtering invalid moves, thus having a relatively high win rate.
Risks of the Strategy
The main risks of this strategy are:
-
In volatile markets, Bollinger Middle Band may trigger too many trading opportunities, leading to over trading;
-
ADX indicator also has some errors in determining trends and invalid moves;
-
Relatively large drawdown risk, suitable for investors who can bear certain level of risk.
Optimization Directions
This strategy can be further optimized in the following aspects:
-
Add ATR indicator to set stop loss points and reduce per stop loss;
-
Optimize Bollinger parameters to reduce middle line triggering frequency;
-
Add trading volume or trend strength indicators to determine the strength of trends, avoiding weak reversal trades.
Summary
In summary, this Volatility Breakthrough Strategy is relatively mature as a whole, effectively capturing key trading points in volatile markets. It combines trend and volatility indicators, balancing between risk and return. With further optimization, it is expected to obtain more steady excess returns.
[/trans]
Strategy Arguments
| Argument | Default | Description |
|---|---|---|
| v_input_1_close | 0 | source: close |
| v_input_2 | 12 | fastLength |
| v_input_3 | 26 | slowlength |
| v_input_4 | 9 | MACDLength |
| v_input_5 | 20 | length |
| v_input_6 | 2 | mult |
| v_input_7 | 25 | ADX Threshold |
| v_input_8 | 14 | ADX Smoothing |
| v_input_9 | 14 | DI Length |
| v_input_10 | false | Take Profit Points |
| v_input_11 | false | Stop Loss Points |
| v_input_12 | false | Trailing Stop Loss Points |
| v_input_13 | false | Trailing Stop Loss Offset Points |
| v_input_14 | false | Custom Backtesting Dates |
| v_input_15 | 2020 | Backtest Start Year |
| v_input_16 | true | Backtest Start Month |
| v_input_17 | true | Backtest Start Day |
| v_input_18 | false | Backtest Start Hour |
| v_input_19 | 2020 | Backtest Stop Year |
| v_input_20 | 12 | Backtest Stop Month |
| v_input_21 | 31 | Backtest Stop Day |
| v_input_22 | 23 | Backtest Stop Hour |
Source (PineScript)
/*backtest
start: 2023-12-11 00:00:00
end: 2023-12-12 00:00:00
period: 10m
basePeriod: 1m
exchanges: [{"eid":"Futures_Binance","currency":"BTC_USDT"}]
*/

// This source code is subject to the terms of the Mozilla Public License 2.0 at https://mozilla.org/MPL/2.0/
// © 03.freeman
//Volatility Traders Minds Strategy (VTM Strategy)
//I found this startegy on internet, with a video explaingin how it works.
//Conditions for entry:
//1 - Candles must to be above or bellow the 48 MA (Yellow line)
//2 - Candles must to break the middle of bollinger bands
//3 - Macd must to be above or bellow zero level;
//4 - ADX must to be above 25 level
//@version=4
strategy("Volatility Traders Minds Strategy (VTM Strategy)", shorttitle="VTM",overlay=true)
source = input(close)
//MA
ma48 = sma(source,48)
//MACD
fastLength = input(12)
slowlength = input(26)
MACDLength = input(9)

MACD = ema(source, fastLength) - ema(source, slowlength)
aMACD = ema(MACD, MACDLength)
delta = MACD - aMACD

//BB

length = input(20, minval=1)
mult = input(2.0, minval=0.001, maxval=50)

basis = sma(source, length)
dev = mult * stdev(source, length)

upper = basis + dev
lower = basis - dev

//ADX
adxThreshold = input(title="ADX Threshold", type=input.integer, defval=25, minval=1)
adxlen = input(14, title="ADX Smoothing")
dilen = input(14, title="DI Length")
dirmov(len) =>
	up = change(high)
	down = -change(low)
	plusDM = na(up) ? na : (up > down and up > 0 ? up : 0)
    minusDM = na(down) ? na : (down > up and down > 0 ? down : 0)
	truerange = rma(tr, len)
	plus = fixnan(100 * rma(plusDM, len) / truerange)
	minus = fixnan(100 * rma(minusDM, len) / truerange)
	[plus, minus]

adx(dilen, adxlen) =>
	[plus, minus] = dirmov(dilen)
	sum = plus + minus
	adx = 100 * rma(abs(plus - minus) / (sum == 0 ? 1 : sum), adxlen)

sig = adx(dilen, adxlen)

//  Strategy: (Thanks to JayRogers)
// === STRATEGY RELATED INPUTS ===
//tradeInvert     = input(defval = false, title = "Invert Trade Direction?")
// the risk management inputs
inpTakeProfit   = input(defval = 0, title = "Take Profit Points", minval = 0)
inpStopLoss     = input(defval = 0, title = "Stop Loss Points", minval = 0)
inpTrailStop    = input(defval = 0, title = "Trailing Stop Loss Points", minval = 0)
inpTrailOffset  = input(defval = 0, title = "Trailing Stop Loss Offset Points", minval = 0)

// === RISK MANAGEMENT VALUE PREP ===
// if an input is less than 1, assuming not wanted so we assign 'na' value to disable it.
useTakeProfit   = inpTakeProfit  >= 1 ? inpTakeProfit  : na
useStopLoss     = inpStopLoss    >= 1 ? inpStopLoss    : na
useTrailStop    = inpTrailStop   >= 1 ? inpTrailStop   : na
useTrailOffset  = inpTrailOffset >= 1 ? inpTrailOffset : na

// === STRATEGY - LONG POSITION EXECUTION ===
enterLong() => close>ma48 and close>basis and delta>0 and sig>adxThreshold  // functions can be used to wrap up and work out complex conditions
//exitLong() => jaw>teeth or jaw>lips or teeth>lips
strategy.entry(id = "Buy", long = true, when = enterLong() )    // use function or simple condition to decide when to get in
//strategy.close(id = "Buy", when = exitLong() )                  // ...and when to get out

// === STRATEGY - SHORT POSITION EXECUTION ===
enterShort() => close<ma48 and close<basis and delta<0 and sig>adxThreshold
//exitShort() => jaw<teeth or jaw<lips or teeth<lips
strategy.entry(id = "Sell", long = false, when = enterShort())
//strategy.close(id = "Sell", when = exitShort() )

// === STRATEGY RISK MANAGEMENT EXECUTION ===
// finally, make use of all the earlier values we got prepped
strategy.exit("Exit Buy", from_entry = "Buy", profit = useTakeProfit, loss = useStopLoss, trail_points = useTrailStop, trail_offset = useTrailOffset)
strategy.exit("Exit Sell", from_entry = "Sell", profit = useTakeProfit, loss = useStopLoss, trail_points = useTrailStop, trail_offset = useTrailOffset)

// === Backtesting Dates === thanks to Trost

testPeriodSwitch = input(false, "Custom Backtesting Dates")
testStartYear = input(2020, "Backtest Start Year")
testStartMonth = input(1, "Backtest Start Month")
testStartDay = input(1, "Backtest Start Day")
testStartHour = input(0, "Backtest Start Hour")
testPeriodStart = timestamp(testStartYear,testStartMonth,testStartDay,testStartHour,0)
testStopYear = input(2020, "Backtest Stop Year")
testStopMonth = input(12, "Backtest Stop Month")
testStopDay = input(31, "Backtest Stop Day")
testStopHour = input(23, "Backtest Stop Hour")
testPeriodStop = timestamp(testStopYear,testStopMonth,testStopDay,testStopHour,0)
testPeriod() =>
    time >= testPeriodStart and time <= testPeriodStop ? true : false
isPeriod = testPeriodSwitch == true ? testPeriod() : true
// === /END

if not isPeriod
    strategy.cancel_all()
    strategy.close_all()
Detail
https://www.fmz.com/strategy/435232
Last Modified
2023-12-13 14:36:04