
10 KiB
Name
价格通道趋势跟踪策略trend-following-strategy-based-on-Donchian-Channels
Author
ChaoZhang
Strategy Description
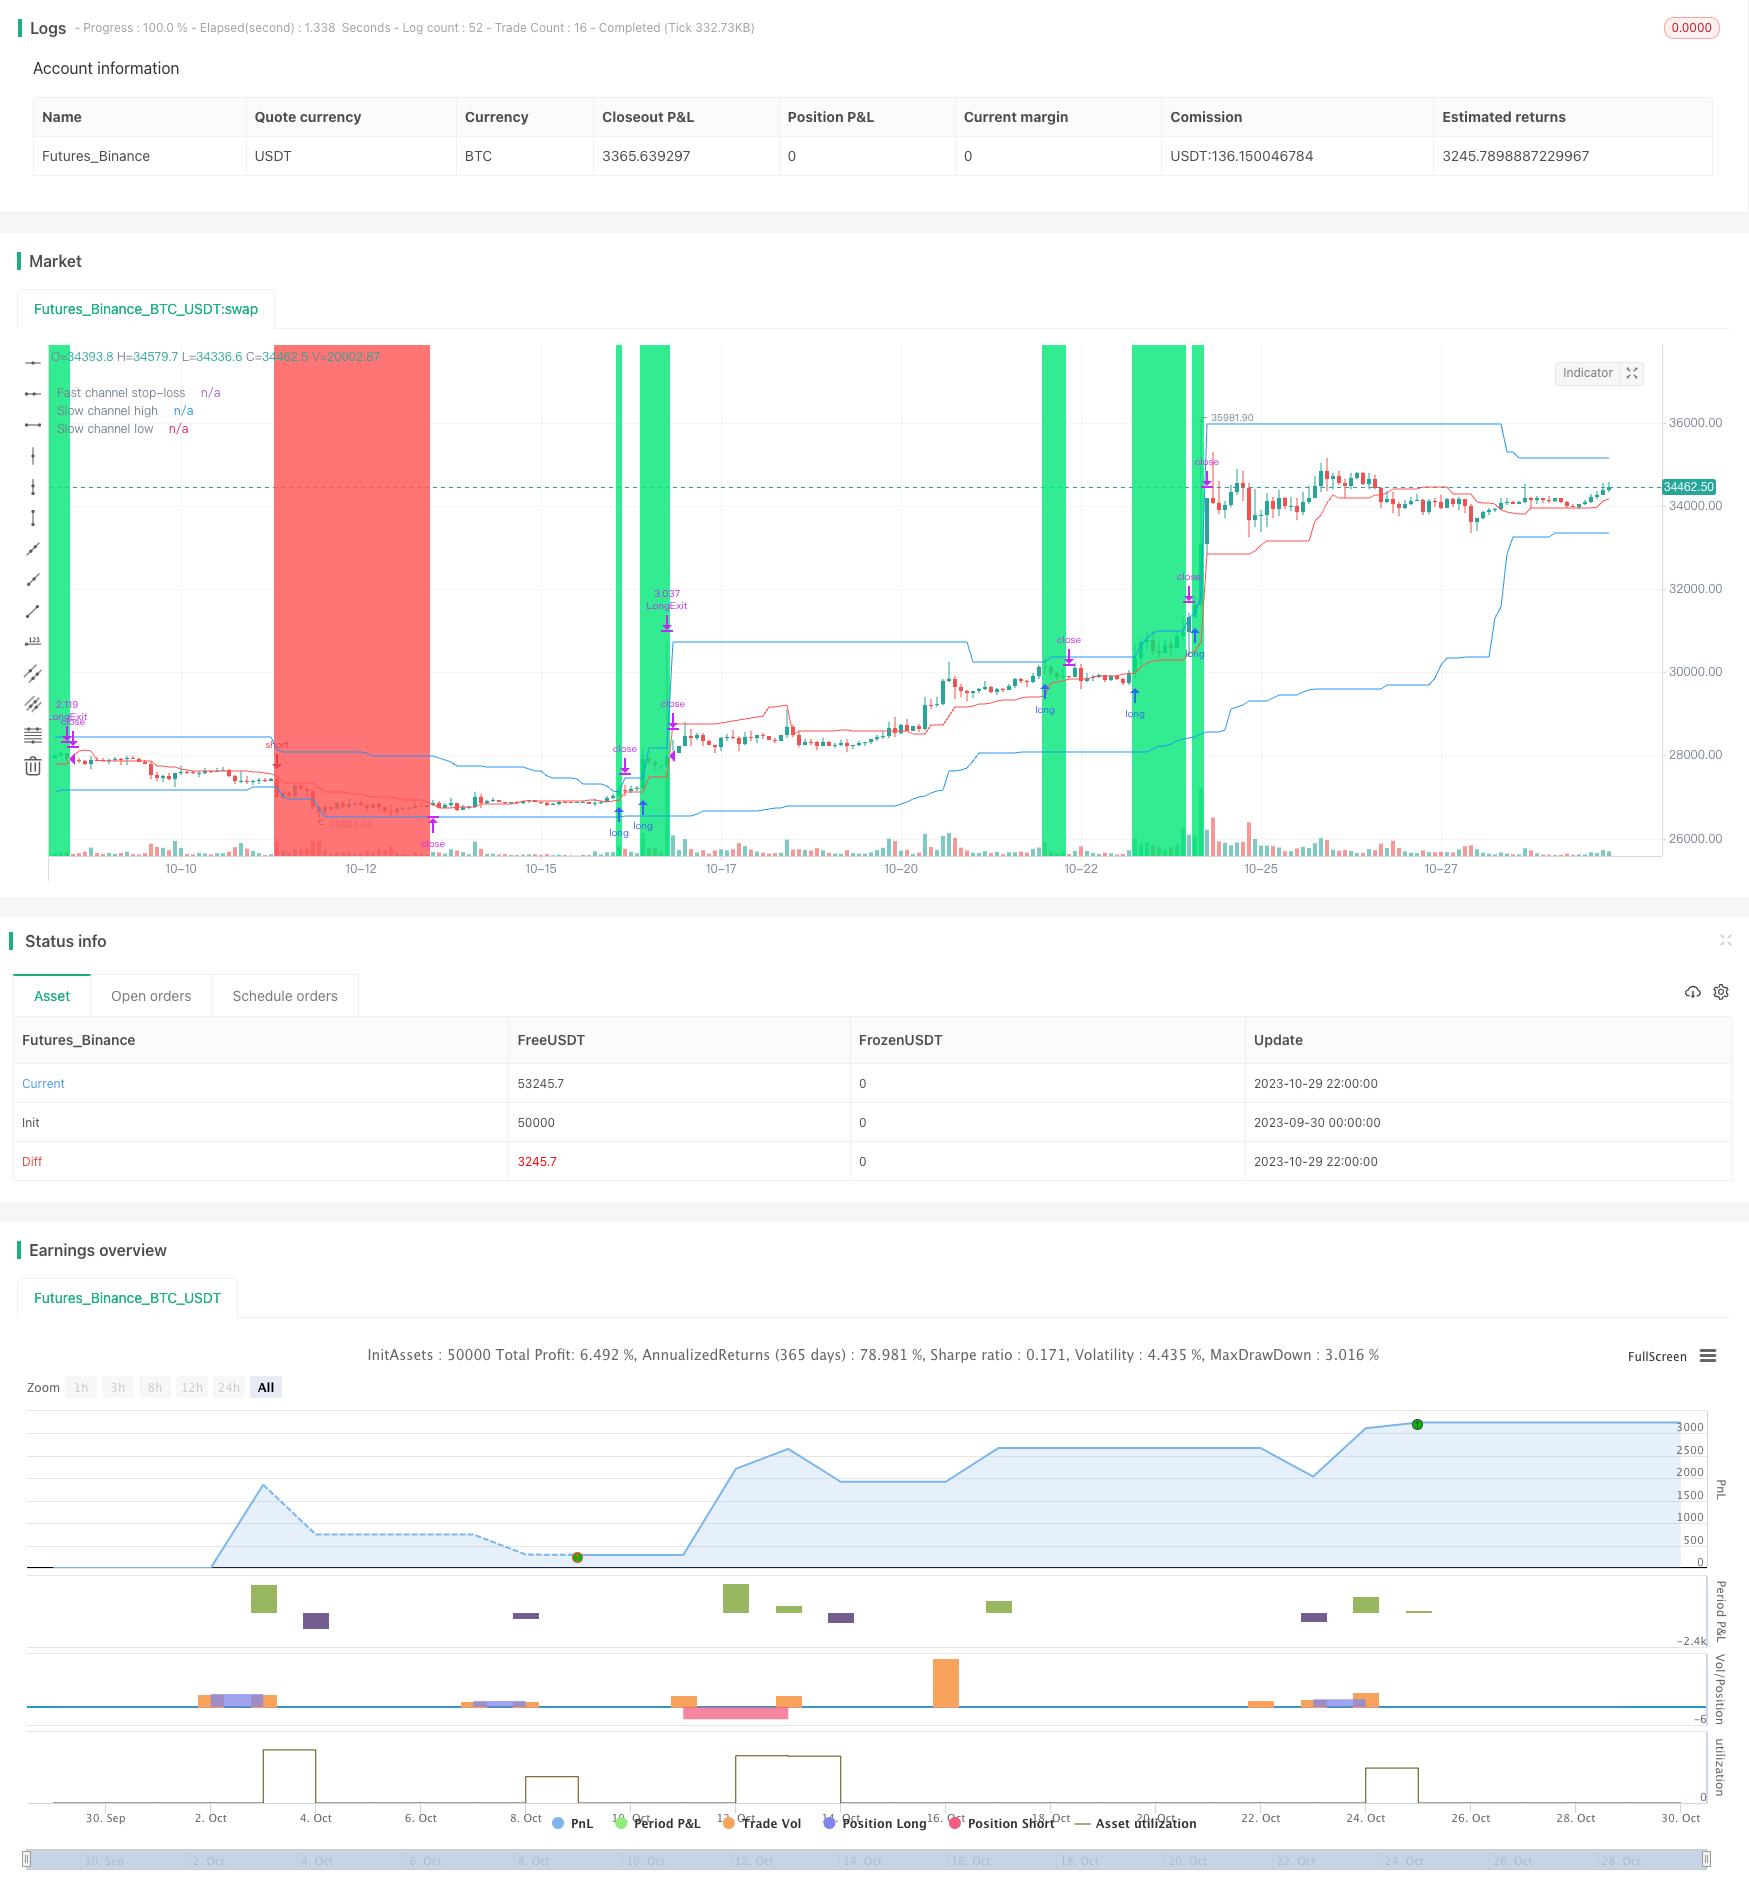
[trans]
谱龄策略
概述
谱龄策略是一种基于价格通道的趋势跟踪策略。它使用快速和慢速的唐奇安通道来识别趋势方向,并在回调时进行逢低买入和逢高卖出。该策略优点是可以自动跟踪趋势,在趋势变化时及时止损和反向开仓。但也存在回撤和止损点过于接近的风险。
策略原理
该策略首先定义快速通道周期为20根K线,慢速通道周期为50根K线。快速通道用于设置止损价格,慢速通道用于判断趋势方向和入场时机。
策略首先计算快速通道的最高价和最低价,并取中线作为止损线。同时计算慢速通道的最高价和最低价,通道上沿和下沿作为入场线。
当价格突破慢速通道上沿时,做多;当价格突破慢速通道下沿时,做空。入场后,止损点设在快速通道中线。
这样,慢速通道判断大趋势方向,快速通道跟踪小范围内突破判断止损点。当大趋势反转时,价格会首先突破快速通道止损线,实现止损。
策略优势
-
自动跟踪趋势,及时止损。使用双通道结构,可以自动跟踪趋势,在趋势反转时快速止损。
-
回调开仓,具有一定的趋势过滤效果。只在价格突破通道边界时开仓,可以滤除部分非趋势性假突破。
-
风险可控。止损距离较近,可以控制单笔损失。
策略风险
-
回撤较大。趋势跟踪策略回撤可以较大,需要有心理准备。
-
止损点过于接近。快速通道周期较短,止损距离较近,容易被套。可以适当放宽快速通道周期。
-
容易产生过多交易。双通道结构导致买卖点较多,需要合理控制仓位。
优化方向
-
增加开仓过滤条件。可以在开仓条件中加入volatility等指标,过滤趋势性不强的突破。
-
优化通道周期参数。可以通过更系统的方法寻找最优通道参数组合。
-
结合多个时间周期决策。可以在更高时间周期确定大趋势,在较低周期进行具体交易。
-
动态调整止损距离。可以根据市场波动程度动态调整止损距离。
总结
谱龄策略整体是一个较为标准的趋势跟踪策略。它利用价格通道判断趋势方向,并设定止损来控制风险。该策略具有一定的优势,但也存在回撤和止损点过近的问题。通过优化通道参数、增加过滤条件等方法,可以获得更好的策略效果。但需要注意的是,趋势跟踪策略对交易者的心态要求较高,需要做好回撤的心理准备。
||
Overview
The Puling strategy is a trend following strategy based on Donchian Channels. It uses fast and slow Donchian Channels to identify the trend direction and enter on pullbacks. The advantages of this strategy are that it can track trends automatically and cut losses in time when the trend changes. But it also has the risks of drawdown and stop loss being too close.
Strategy Logic
The strategy first defines the fast channel period as 20 bars, and the slow channel period as 50 bars. The fast channel is used to set the stop loss price, while the slow channel is used to determine the trend direction and entry timing.
First, the highest high and lowest low of the fast channel are calculated, and the midpoint is taken as the stop loss line. At the same time, the highest high and lowest low of the slow channel are calculated, and the channel top and bottom are used as the entry lines.
When the price breaks through the top of the slow channel, go long. When the price breaks through the bottom of the slow channel, go short. After entering the position, set the stop loss at the midpoint of the fast channel.
So the slow channel determines the major trend direction, while the fast channel tracks minor breakouts within a small range to determine the stop loss point. When the major trend reverses, the price will first break through the stop loss line of the fast channel to realize the stop loss.
Advantages
-
Automatically track trends and cut losses in time. The double channel structure can automatically track trends and quickly cut losses when trends reverse.
-
Enter on pullbacks, with some trend filtering effect. Only taking entries when price breaks through channel boundaries can filter out some false breakouts without real trend.
-
Controllable risk. The close stop loss distance can control single loss.
Risks
-
Larger drawdowns. Trend following strategies can have relatively large drawdowns which requires psychological preparation.
-
Stop loss too close. The fast channel period is short so the stop loss is close, prone to being stopped out. We can appropriately relax the fast channel period.
-
Too many trades. The double channel structure can generate excessive entries, requiring reasonable position sizing.
Optimization Directions
-
Add entry filters. We can add volatility etc. in entry conditions to filter breakouts without enough trend strength.
-
Optimize channel period parameters. We can find the optimal channel parameter combinations systematically.
-
Combining multiple timeframes. Determine the major trend on higher timeframes and trade on lower timeframes.
-
Dynamic stop loss distance. Adjust stop distance dynamically based on market volatility.
Summary
The Puling strategy is a standard trend following strategy overall. It uses price channels to determine trend direction and sets stop loss to control risks. The strategy has some advantages but also the problems of drawdown and stop loss being too close. We can optimize it through adjusting channel parameters, adding filters etc. But we should note trend following strategies require strong psychology to endure drawdowns.
[/trans]
Strategy Arguments
| Argument | Default | Description |
|---|---|---|
| v_input_1 | true | Long |
| v_input_2 | true | Short |
| v_input_3 | 2 | Risk size, % |
| v_input_4 | 20 | Fast channel (for stop-loss) |
| v_input_5 | 50 | Slow channel (for entries) |
| v_input_6 | true | Show offset |
| v_input_7 | true | Show lines |
| v_input_8 | true | Show label (drawdown) |
| v_input_9 | true | Show background |
| v_input_10 | 1900 | From Year |
| v_input_11 | 2100 | To Year |
| v_input_12 | true | From Month |
| v_input_13 | 12 | To Month |
| v_input_14 | true | From day |
| v_input_15 | 31 | To day |
Source (PineScript)
/*backtest
start: 2023-09-30 00:00:00
end: 2023-10-30 00:00:00
period: 2h
basePeriod: 15m
exchanges: [{"eid":"Futures_Binance","currency":"BTC_USDT"}]
*/

//Noro
//2020

//@version=4
strategy("Noro's RiskTurtle Strategy", shorttitle = "RiskTurtle str", overlay = true, default_qty_type = strategy.percent_of_equity, initial_capital = 100, default_qty_value = 100, commission_value = 0.1)

//Settings
needlong  = input(true, defval = true, title = "Long")
needshort = input(true, defval = true, title = "Short")
risk      = input(2, minval = 0.1, maxval = 99, title = "Risk size, %")
fast      = input(20, minval = 1, title = "Fast channel (for stop-loss)")
slow      = input(50, minval = 1, title = "Slow channel (for entries)")
showof    = input(true, defval = true, title = "Show offset")
showll    = input(true, defval = true, title = "Show lines")
showdd    = input(true, defval = true, title = "Show label (drawdown)")
showbg    = input(true, defval = true, title = "Show background")
fromyear  = input(1900, defval = 1900, minval = 1900, maxval = 2100, title = "From Year")
toyear    = input(2100, defval = 2100, minval = 1900, maxval = 2100, title = "To Year")
frommonth = input(01, defval = 01, minval = 01, maxval = 12, title = "From Month")
tomonth   = input(12, defval = 12, minval = 01, maxval = 12, title = "To Month")
fromday   = input(01, defval = 01, minval = 01, maxval = 31, title = "From day")
today     = input(31, defval = 31, minval = 01, maxval = 31, title = "To day")

//Donchian price channel fast
hf = highest(high, fast)
lf = lowest(low, fast)
center = (hf + lf) / 2

//Donchian price chennal slow
hs = highest(high, slow)
ls = lowest(low, slow)

//Lines
colorpc = showll ? color.blue : na
colorsl = showll ? color.red : na
offset = showof ? 1 : 0
plot(hs, offset = offset, color = colorpc, title = "Slow channel high")
plot(ls, offset = offset, color = colorpc, title = "Slow channel low")
plot(center, offset = offset, color = colorsl, title = "Fast channel stop-loss")

//Background
size = strategy.position_size
colorbg = showbg == false ? na : size > 0 ? color.lime : size < 0 ? color.red : na
bgcolor(colorbg, transp = 70)

//Var
loss = 0.0
maxloss = 0.0
equity = 0.0
truetime = true

//Lot size
risksize = -1 * risk
risklong = ((center / hs) - 1) * 100
coeflong = abs(risksize / risklong)
lotlong = (strategy.equity / close) * coeflong
riskshort = ((center / ls) - 1) * 100
coefshort = abs(risksize / riskshort)
lotshort = (strategy.equity / close) * coefshort

//Orders
strategy.entry("Long", strategy.long, lotlong, stop = hs, when = needlong and strategy.position_size == 0 and hs > 0 and truetime)
strategy.entry("Short", strategy.short, lotshort, stop = ls, when = needshort and strategy.position_size == 0 and ls > 0 and truetime)
strategy.exit("LongExit", "Long", stop = center, when = needlong and strategy.position_size > 0)
strategy.exit("Short", stop = center, when = needshort and strategy.position_size < 0)
if time > timestamp(toyear, tomonth, today, 23, 59)
    strategy.close_all()
    strategy.cancel("Long")
    strategy.cancel("Short")

if showdd

    //Drawdown
    max = 0.0
    max := max(strategy.equity, nz(max[1]))
    dd = (strategy.equity / max - 1) * 100
    min = 100.0
    min := min(dd, nz(min[1]))

    //Max loss size
    equity := strategy.position_size == 0 ? strategy.equity : equity[1]
    loss := equity < equity[1] ? ((equity / equity[1]) - 1) * 100 : 0
    maxloss := min(nz(maxloss[1]), loss)

    //Label
    min := round(min * 100) / 100
    maxloss := round(maxloss * 100) / 100
    labeltext = "Drawdown: " + tostring(min) + "%" + "\nMax.loss " + tostring(maxloss) + "%"
    var label la = na
    label.delete(la)
    tc = min > -100 ? color.white : color.red
    osx = timenow + round(change(time)*10)
    osy = highest(100)
    // la := label.new(x = osx, y = osy, text = labeltext, xloc = xloc.bar_time, yloc = yloc.price, color = color.black, style = label.style_labelup, textcolor = tc)
Detail
https://www.fmz.com/strategy/430693
Last Modified
2023-10-31 17:44:19