
9.6 KiB
Name
交易量百分比振荡指标策略Percentage-Volume-Oscillator-Strategy
Author
ChaoZhang
Strategy Description
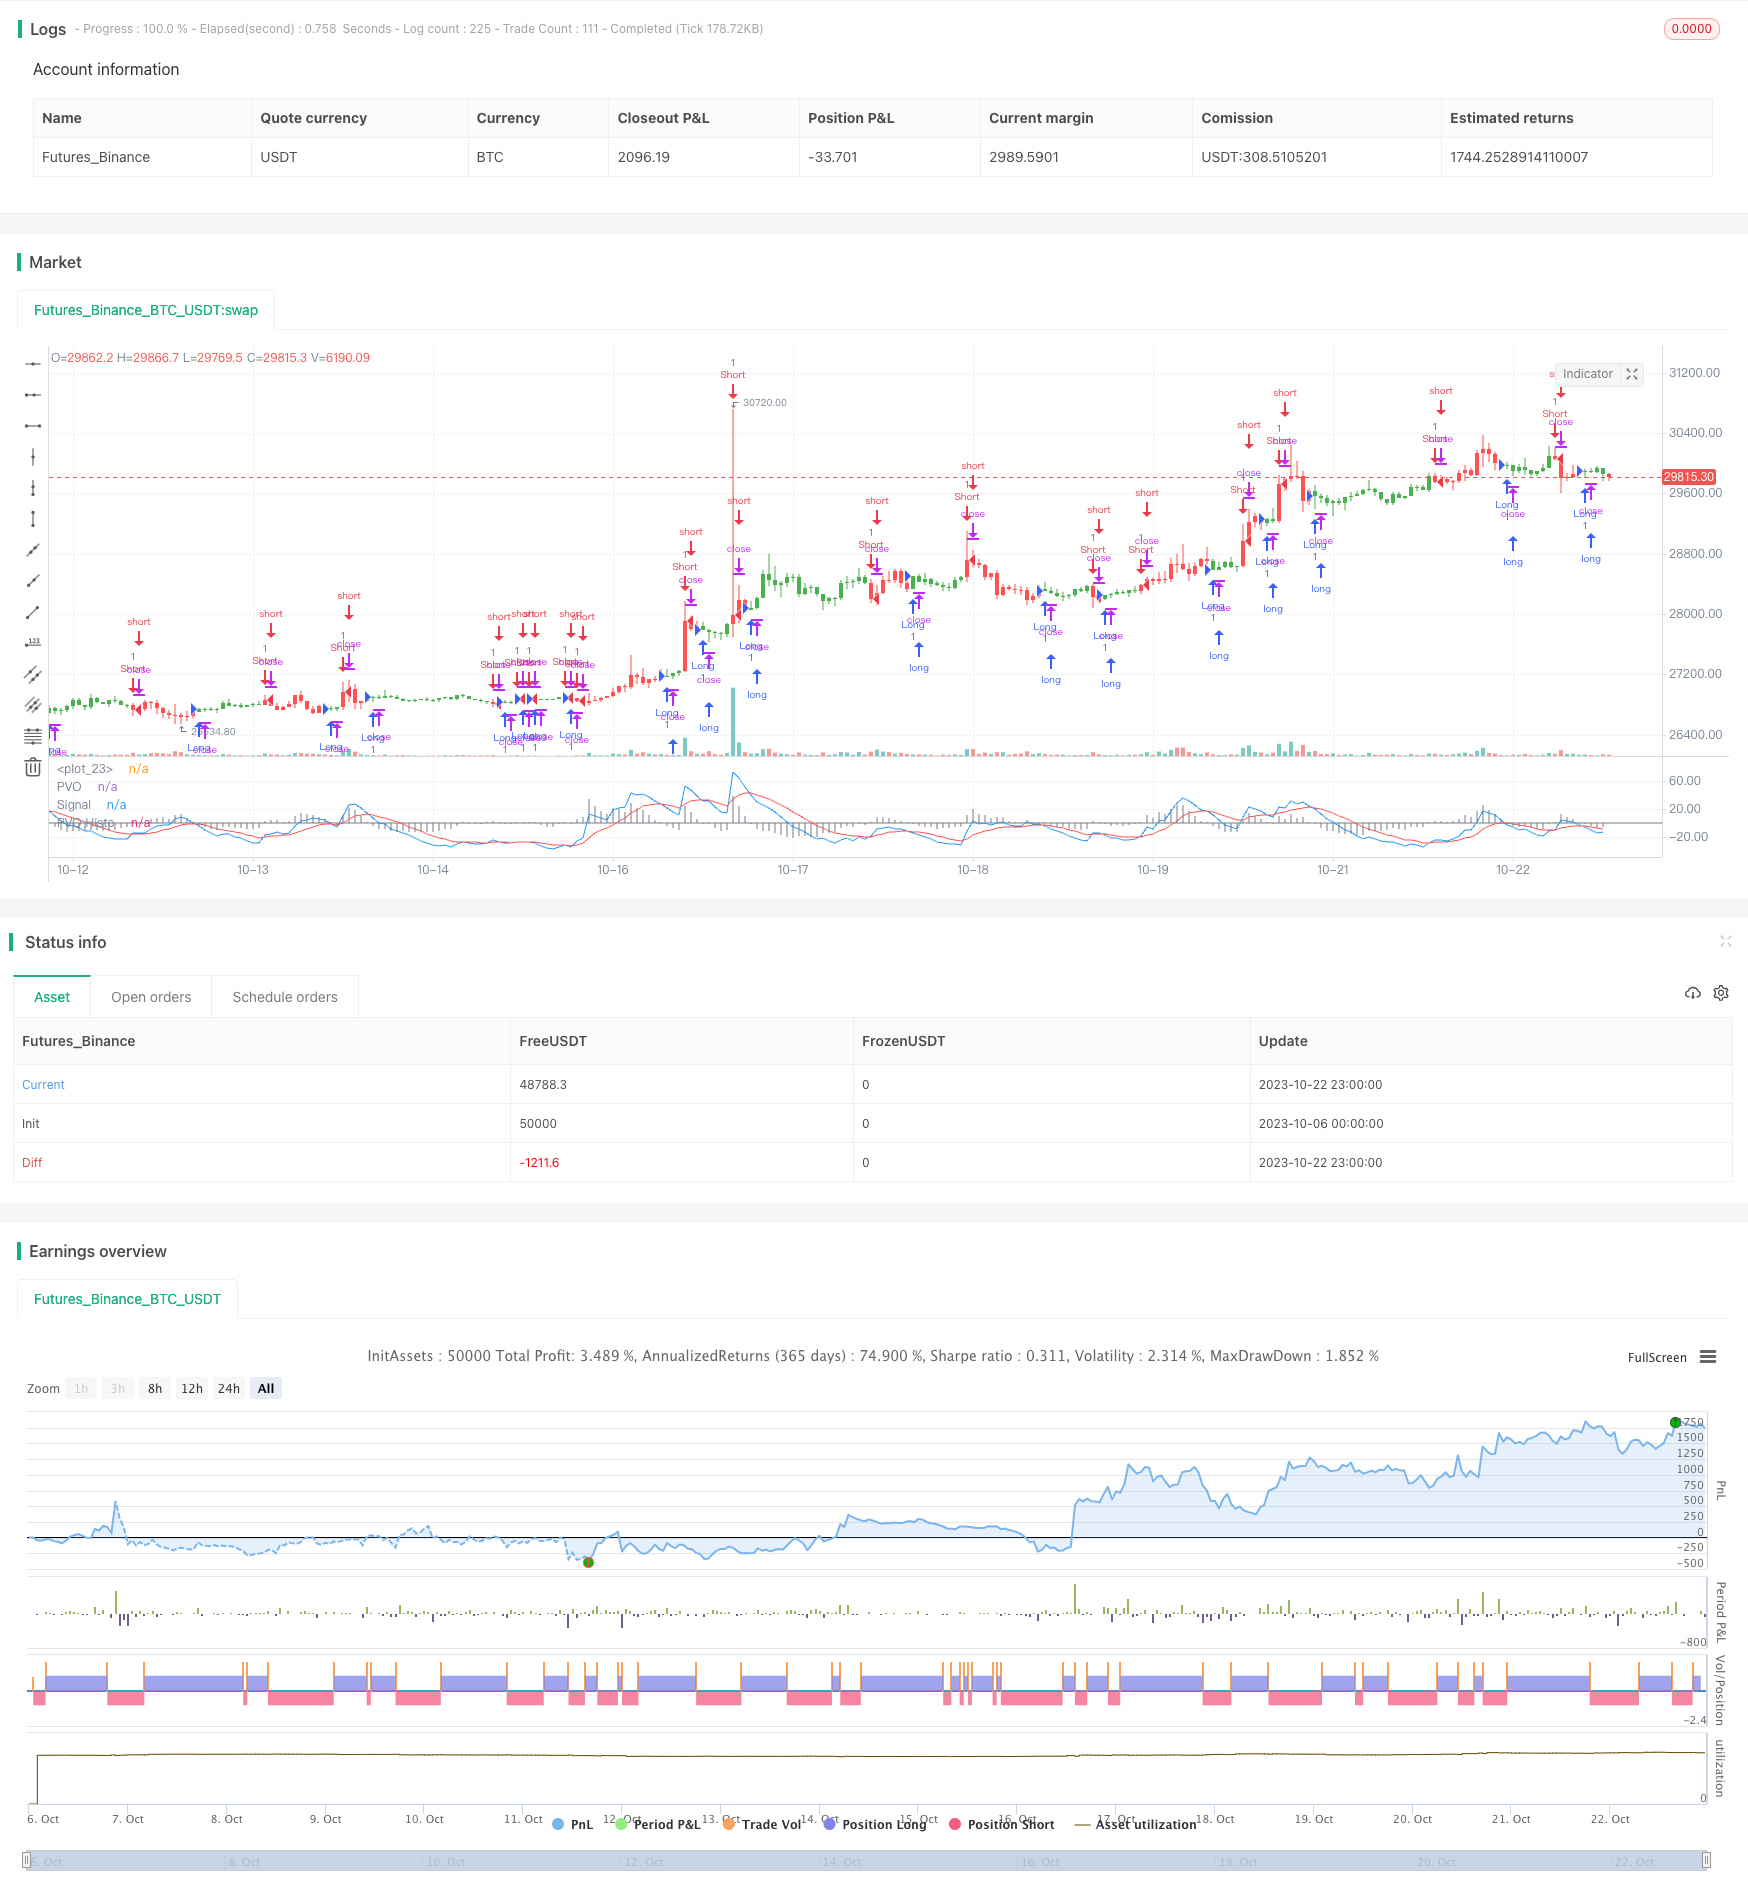 [trans]
概述:
交易量百分比振荡指标(PVO)是一种用于交易量的动量震荡指标。PVO 通过计算两个不同周期的交易量指数移动平均线之间的差异百分比,来衡量交易量趋势的变化。该策略运用PVO指标来发现交易量的趋势,以确认或否定价格行情。通常,当PVO为正或上升时,突破或支持位破裂更有效。
策略原理:
- 计算短期交易量EMA(默认12日)
- 计算长期交易量EMA(默认26日)
- 计算短期EMA与长期EMA的差异百分比作为PVO
- 计算PVO的信号线EMA(默认9日)
- 计算PVO与信号线的差异作为柱状图
- 当信号线上穿PVO线时做空,下穿时做多
- 可选择反向交易
- 对符合交易信号的K线绘制不同颜色
该策略通过双EMA组合形成PVO指标,再结合信号线,发现交易量变化趋势,指导价格交易方向。与普通双EMA不同的是,PVO更着眼于交易量差异百分比,能更清晰判断交易量增减。
优势分析:
- 利用交易量变化判断未来价格趋势,具有一定的阻断作用
- 双EMA结构简单实用,参数调整灵活
- 可视化K线颜色直观判断趋势,操作方便
- 结合信号线减少假信号,提高稳定性
- 可选择反向交易,丰富策略运用
- 适用于中长线趋势和短线操作
该策略充分利用了交易量变化对价格行情的提示作用。相比单一指标,PVO结构更稳定,可定制参数组合判断交易量趋势变化,从而提前探测价格可能的变动方向。直观的K线颜色区分强化趋势判断,可根据需要选择反向交易,是一种通用实用的交易量策略。
风险分析:
- 交易量指标对价格信号有一定滞后,可能出现背离
- EMA参数设置不当可能误判市场状态
- 反向交易时需要谨慎,可能加大亏损
- 依靠交易量变化无法确定具体入场点位
- 交易量不一定能百分之百预测价格,需结合其他指标
交易量变化往往滞后价格行情,当价格进入趋势末期时,PVO可能发出错误信号。参数设置不当也会影响判断效果。反向交易时务必审慎,因为趋势可能延续。交易量难以判断具体的入场时机,需辅助其他指标精确操作。交易量指标无法百分百预测价格,仍需要谨慎跟单。
策略优化方向:
- 优化EMA周期参数,适应不同品种和周期
- 增加过滤条件,避免无效信号
- 结合其他指标确认入场时机
- 增加止损条
可以测试优化EMA参数组合,寻找最佳周期判断买卖趋势。可设置交易量波动幅度条件,过滤无效信号。可引入MACD,KD等指标进一步确认具体入场点位。也可以设置止损线,控制单笔亏损。这将大大提高策略的实用性。
总结:
交易量百分比振荡指标策略通过计算交易量指数移动平均线的差异百分比,来判断交易量的变化趋势,以发现价格可能的未来走势。该策略运用简单有效的双EMA结构测量交易量波动,借助直观的K线颜色增强视觉效果。可根据需要选择反向交易,参数设置灵活,既适合中长线也适合短线,是一个非常实用的基于交易量的策略工具。但交易量指标对价格信号具有一定滞后性,无法明确入场时机,因此需要优化参数设置,并辅助其他指标来提高策略效果。
||
Overview:
The Percentage Volume Oscillator (PVO) is a momentum oscillator for volume. PVO measures the difference between two volume-based moving averages as a percentage of the larger moving average to gauge shifts in volume trends. This strategy uses PVO to identify volume trends to confirm or refute price action. Typically, a breakout or support break is validated when PVO is rising or positive.
Strategy Logic:
- Calculate short period volume EMA (default 12 days)
- Calculate long period volume EMA (default 26 days)
- Calculate PVO as the percentage difference between short and long EMA
- Calculate signal line EMA on PVO (default 9 days)
- Calculate histogram as difference between PVO and signal line
- Go short when signal line crosses above PVO, go long when crosses below
- Option to reverse trade direction
- Color bars based on signal
The strategy forms PVO indicator through double EMA composition and uses signal line to identify volume trend changes to anticipate potential price direction. Unlike regular double EMA, PVO focuses more on volume percentage difference for clearer judgement of volume increase/decrease.
Advantages:
- Utilize volume changes to determine future price trends as early warning
- Simple and practical double EMA structure with flexible parameter tuning
- Visualized color bars for intuitive trend judgement and easy operation
- Signal line reduces false signals and improves stability
- Optional reverse trading enriches strategy usage
- Applicable for mid-to-long term trends and short term trading
The strategy fully utilizes the indicative effect of volume changes on price action. Compared to single indicator, the PVO structure is more stable with customizable parameters to judge volume trend changes and detect potential price direction in advance. The intuitive color differentiation strengthens trend decision and reverse trading option makes it a versatile volume based strategy.
Risks:
- Volume indicator lags price signal and may diverge
- Improper EMA parameter setting may misjudge market state
- Reverse trading needs caution, can increase loss
- Volume change alone cannot determine specific entry point
- Volume does not fully predict price, needs combining with other indicators
Volume change often lags price action and PVO may give wrong signal when price approaches trend end. Wrong parameter settings can also affect judgement accuracy. Caution is needed when reverse trading, as trend may extend. Volume alone cannot determine precise entry point and needs aid of other indicators for timing. Volume does not fully predict price and needs prudent following.
Optimization:
- Optimize EMA periods for different products and timeframes
- Add filter conditions to avoid invalid signals
- Combine other indicators to confirm entry timing
- Add stop loss
Testing and optimizing EMA combinations to find best periods for trend detection. Adding volume fluctuation threshold to filter ineffective signals. Incorporating MACD, KD for further entry confirmation. Setting stop loss to control single trade loss. These will greatly improve strategy applicability.
Conclusion:
The Percentage Volume Oscillator strategy judges volume trend changes by calculating the percentage difference between volume EMAs to anticipate potential price direction. It adopts simple and effective double EMA structure to measure volume fluctuations and uses intuitive color coding to enhance visual effect. The flexible reverse trading option and parameter settings make it suitable for both mid-to-long term and short term trading. But as volume indicator lags price signal and cannot determine precise entry timing, parameters and incorporation of other indicators need optimization to improve strategy performance.
[/trans]
Strategy Arguments
| Argument | Default | Description |
|---|---|---|
| v_input_1 | 12 | LengthShortEMA |
| v_input_2 | 26 | LengthLongEMA |
| v_input_3 | 9 | LengthSignalEMA |
| v_input_4 | false | Trade reverse |
Source (PineScript)
/*backtest
start: 2023-10-06 00:00:00
end: 2023-10-23 00:00:00
period: 1h
basePeriod: 15m
exchanges: [{"eid":"Futures_Binance","currency":"BTC_USDT"}]
*/

//@version=2
////////////////////////////////////////////////////////////
//  Copyright by HPotter v1.0 27/09/2017
// The Percentage Volume Oscillator (PVO) is a momentum oscillator for volume.
// PVO measures the difference between two volume-based moving averages as a
// percentage of the larger moving average. As with MACD and the Percentage Price
// Oscillator (PPO), it is shown with a signal line, a histogram and a centerline.
// PVO is positive when the shorter volume EMA is above the longer volume EMA and
// negative when the shorter volume EMA is below. This indicator can be used to define
// the ups and downs for volume, which can then be use to confirm or refute other signals.
// Typically, a breakout or support break is validated when PVO is rising or positive.
//
// You can change long to short in the Input Settings
// WARNING:
// - For purpose educate only
// - This script to change bars colors.
////////////////////////////////////////////////////////////
strategy(title="Percentage Volume Oscillator (PVO)", shorttitle="PVO")
LengthShortEMA = input(12, minval=1)
LengthLongEMA = input(26, minval=1)
LengthSignalEMA = input(9, minval=1)
reverse = input(false, title="Trade reverse")
hline(0, color=gray, linestyle=line)
xShortEMA = ema(volume , LengthShortEMA)
xLongEMA = ema(volume , LengthLongEMA)
xPVO = ((xShortEMA - xLongEMA) / xLongEMA) * 100
xSignalEMA = ema(xPVO , LengthSignalEMA)
xPVOHisto = xPVO - xSignalEMA
pos = iff(xSignalEMA < xPVO, -1,
	   iff(xSignalEMA > xPVO, 1, nz(pos[1], 0)))
possig = iff(reverse and pos == 1, -1,
          iff(reverse and pos == -1, 1, pos))
if (possig == 1)
    strategy.entry("Long", strategy.long)
if (possig == -1)
    strategy.entry("Short", strategy.short)
barcolor(possig == -1 ? red: possig == 1 ? green : blue )
plot(xPVO, color=blue, title="PVO")
plot(xSignalEMA, color=red, title="Signal")
plot(xPVOHisto, color=gray, title="PVO Histo", style=histogram)
Detail
https://www.fmz.com/strategy/431266
Last Modified
2023-11-06 15:45:02