
11 KiB
Name
交易量动态调整DCA策略-Volume-based-Dynamic-DCA-Strategy
Author
ChaoZhang
Strategy Description
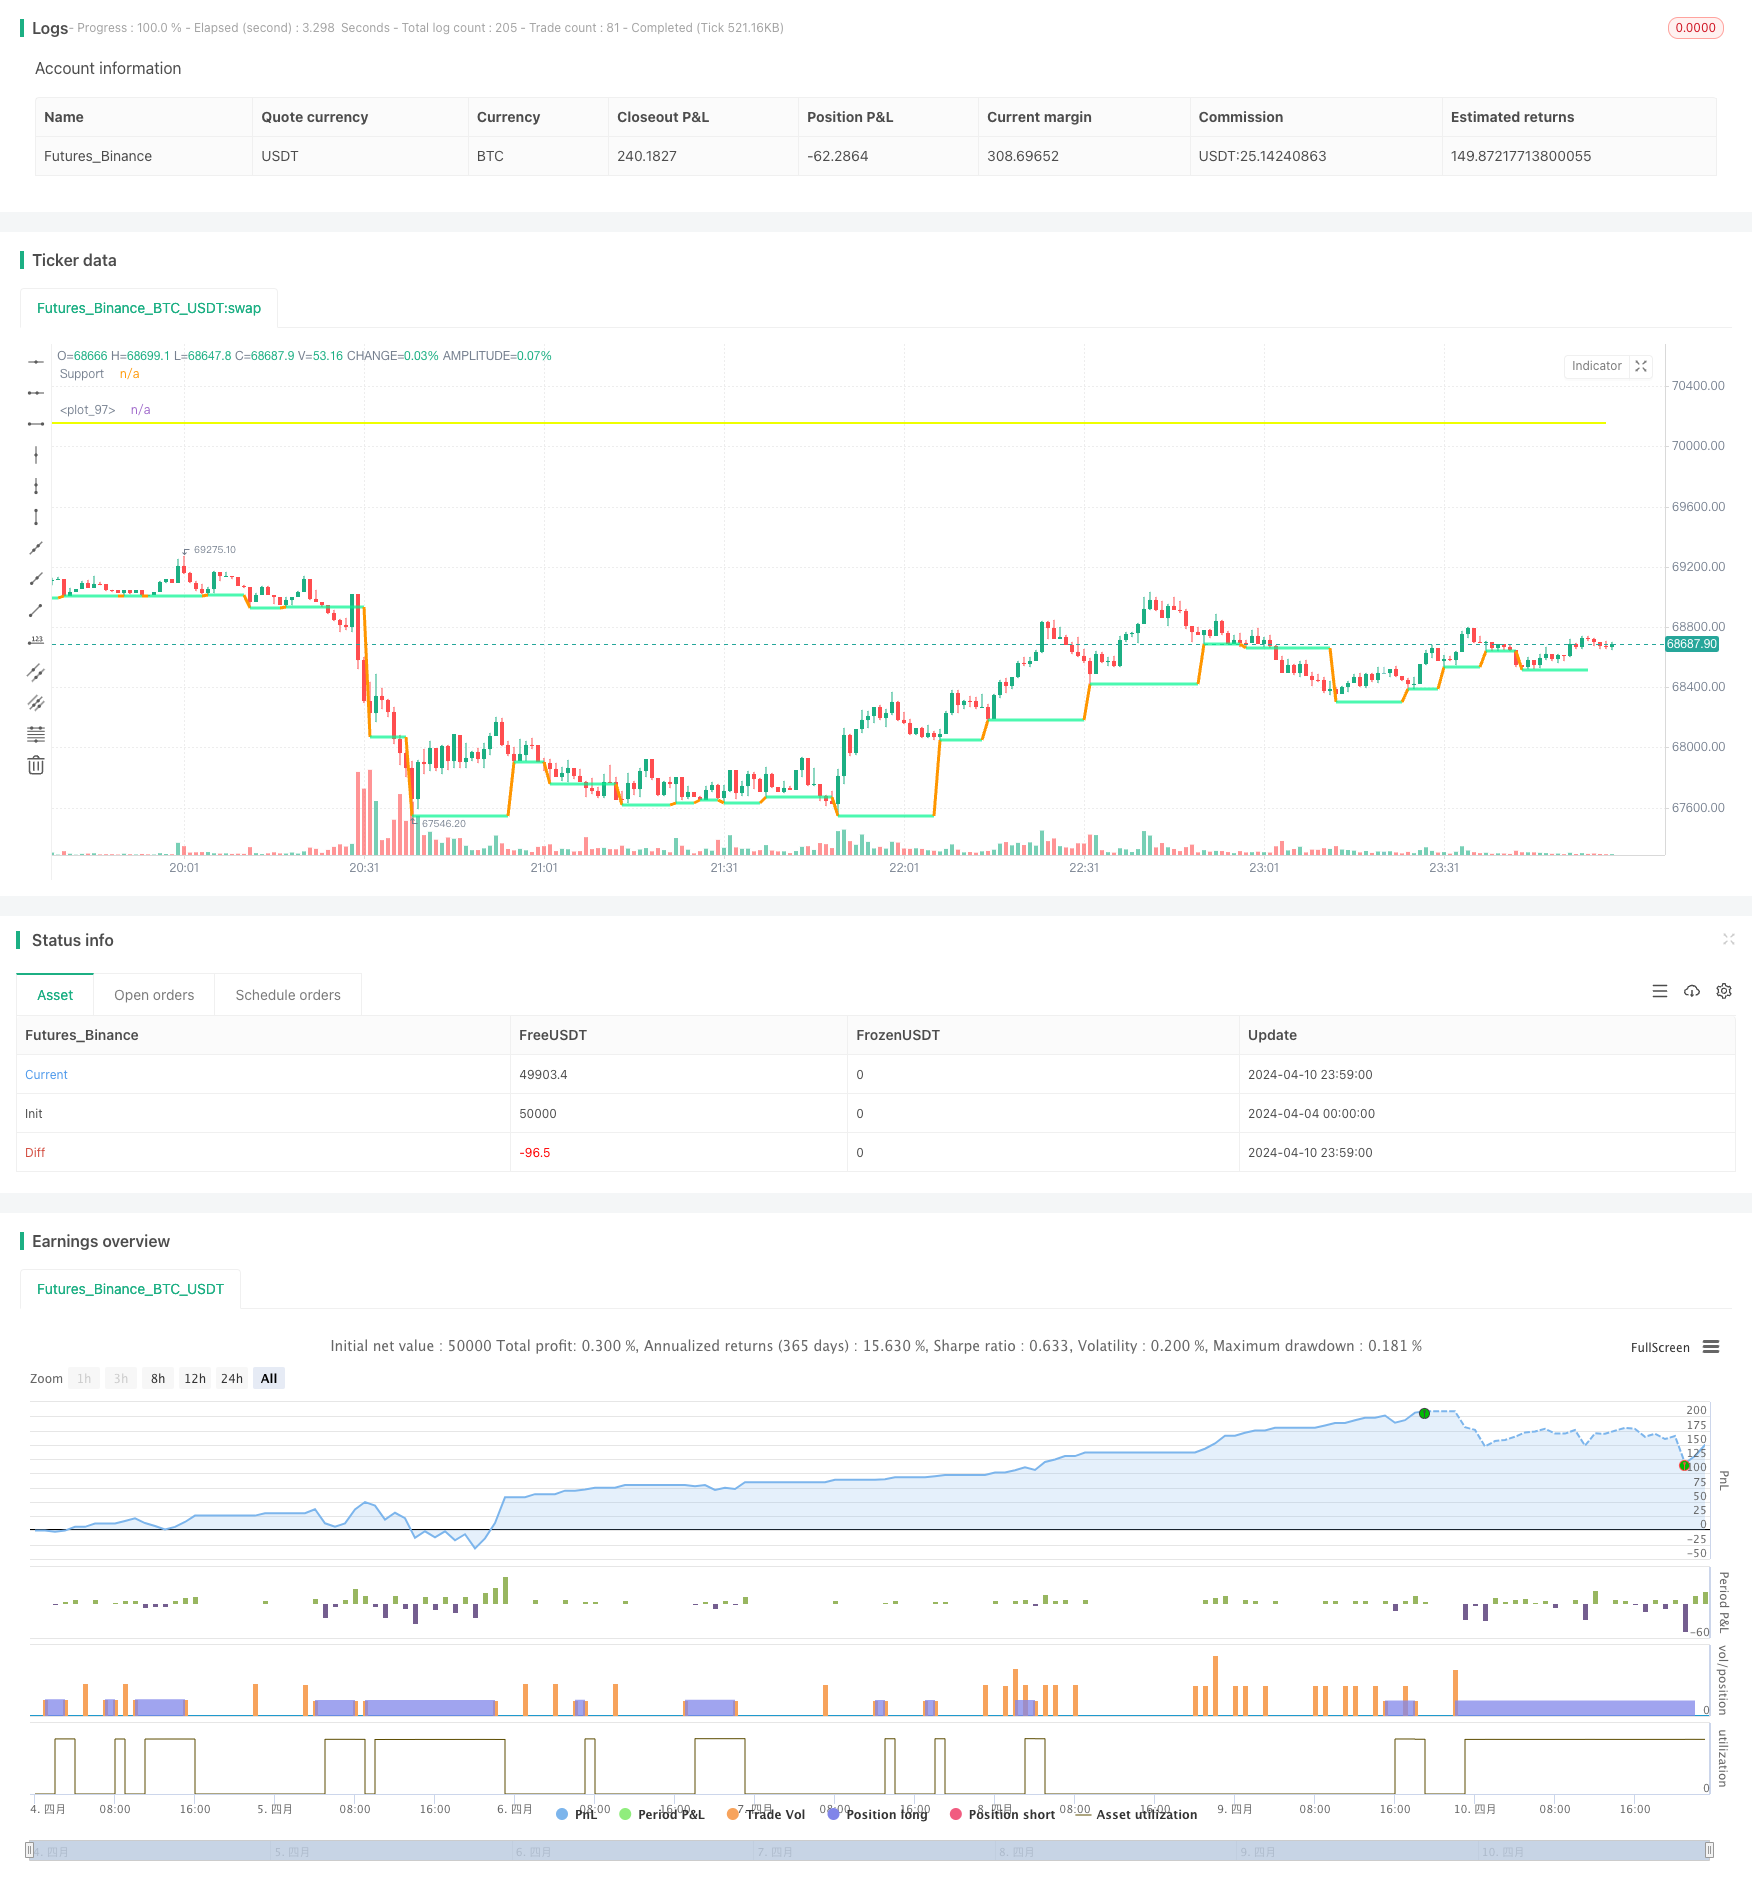
[trans]
概述
该策略是一种基于交易量和价格突破的动态DCA策略。它通过识别最近的价格低点,并在价格突破该低点且交易量增加时开始建仓。在价格继续下跌的过程中,策略会根据浮动亏损的大小,动态调整每次建仓的数量,直到达到设定的总建仓次数。同时,该策略还会根据价格下跌幅度的中位数来设置止盈价格。
策略原理
- 通过ta.pivotlow()函数识别最近的价格低点,并将其作为支撑位。
- 计算历史价格突破支撑位后的下跌幅度,取其中位数作为安全距离和止盈幅度的参考。
- 当价格突破支撑位且相对交易量大于设定的倍数时,触发建仓信号。
- 根据设定的总建仓次数,将总资金分为等比例的多个部分,每次建仓时,根据当前建仓次数动态调整建仓数量,实现仓位的指数增长。
- 在建仓过程中,如果浮动亏损达到设定的阈值,则继续加仓,直到达到总建仓次数。
- 当价格上涨到止盈价格时,平掉所有仓位。
策略优势
- 动态调整建仓数量:根据价格下跌过程中的浮动亏损,动态调整每次建仓的数量,控制风险的同时,也能够在价格反弹时获得更多的利润。
- 参考历史数据设置参数:通过计算历史价格突破支撑位后的下跌幅度,取其中位数作为安全距离和止盈幅度的参考,使策略参数更加贴近市场实际情况。
- 限制总建仓次数:通过设置总建仓次数,控制策略的总风险敞口,避免过度加仓导致的损失。
策略风险
- 支撑位失效风险:如果市场出现极端行情,价格突破支撑位后持续大幅下跌,策略的加仓机制可能会带来较大的损失。
- 参数设置风险:策略的表现很大程度上取决于参数的设置,如果参数设置不当,可能会导致策略表现不佳。
- 止盈价格设置风险:如果止盈价格设置过高,可能会错失部分利润;如果设置过低,可能会过早平仓,无法充分利用价格反弹的机会。
策略优化方向
- 引入更多指标:在建仓信号的判断中,可以引入更多的技术指标,如RSI、MACD等,以提高信号的准确性。
- 优化资金管理:可以根据市场波动性、账户风险承受能力等因素,动态调整每次建仓的资金比例,以更好地控制风险。
- 自适应止盈止损:根据市场波动性的变化,动态调整止盈止损的幅度,以更好地适应市场的变化。
总结
该策略通过动态调整建仓数量和参考历史数据设置参数的方式,在控制风险的同时,力求在价格反弹时获得更多的利润。但是,策略的表现很大程度上取决于参数的设置和市场情况,仍然存在一定的风险。通过引入更多指标、优化资金管理和自适应止盈止损等方式,可以进一步提高策略的表现。
||
Overview
This strategy is a volume-based dynamic DCA strategy that uses price breakouts. It identifies the most recent price low and starts building positions when the price breaks below that low and the trading volume increases. As the price continues to fall, the strategy dynamically adjusts the quantity of each position based on the size of the floating loss until it reaches the set total number of positions. At the same time, the strategy sets the take-profit price based on the median of the historical price drop percentages.
Strategy Principles
- Use the ta.pivotlow() function to identify the most recent price low and treat it as a support level.
- Calculate the historical price drop percentages after breaking the support level and take the median as a reference for the safe distance and take-profit percentage.
- Trigger the position-building signal when the price breaks below the support level and the relative trading volume is greater than the set multiple.
- Based on the set total number of positions, divide the total funds into equal proportions. Each time a position is built, dynamically adjust the position size based on the current number of positions, achieving exponential growth in position size.
- During the position-building process, if the floating loss reaches the set threshold, continue to add positions until the total number of positions is reached.
- When the price rises to the take-profit price, close all positions.
Strategy Advantages
- Dynamic position size adjustment: By dynamically adjusting the size of each position based on the floating loss during the price decline, the strategy controls risk while also allowing for greater profits when the price rebounds.
- Parameter setting based on historical data: By calculating the median of the historical price drop percentages after breaking the support level and using it as a reference for the safe distance and take-profit percentage, the strategy parameters are more closely aligned with actual market conditions.
- Limiting the total number of positions: By setting a total number of positions, the strategy controls its overall risk exposure and avoids excessive losses due to over-positioning.
Strategy Risks
- Support level failure risk: If the market experiences extreme conditions and the price continues to fall sharply after breaking the support level, the strategy's position-adding mechanism may lead to significant losses.
- Parameter setting risk: The strategy's performance largely depends on the parameter settings. If the parameters are set improperly, it may lead to poor strategy performance.
- Take-profit price setting risk: If the take-profit price is set too high, potential profits may be missed. If it is set too low, positions may be closed too early, missing opportunities to fully capitalize on price rebounds.
Strategy Optimization Directions
- Introduce more indicators: In determining the position-building signal, more technical indicators such as RSI and MACD can be introduced to improve signal accuracy.
- Optimize money management: Based on factors such as market volatility and account risk tolerance, dynamically adjust the proportion of funds for each position to better control risk.
- Adaptive take-profit and stop-loss: Dynamically adjust the take-profit and stop-loss percentages based on changes in market volatility to better adapt to market changes.
Summary
By dynamically adjusting position sizes and setting parameters based on historical data, this strategy aims to control risk while seeking greater profits during price rebounds. However, the strategy's performance largely depends on parameter settings and market conditions, and risks still exist. By introducing more indicators, optimizing money management, and using adaptive take-profit and stop-loss, the strategy's performance can be further improved. [/trans]
Strategy Arguments
| Argument | Default | Description |
|---|---|---|
| v_input_1 | 3 | Swing Points |
| v_input_float_1 | 1.1 | Median drop Mult |
| v_input_2 | -5 | Floating Loss |
| v_input_3 | 5 | Number of all orders |
| v_input_4 | 20 | Length of relative volume |
| v_input_5 | 2 | Volume Multiplier |
| v_input_float_2 | true | Take Profit Multiplier |
Source (PineScript)
/*backtest
start: 2024-04-04 00:00:00
end: 2024-04-11 00:00:00
period: 1m
basePeriod: 1m
exchanges: [{"eid":"Futures_Binance","currency":"BTC_USDT"}]
*/

// This Pine Script™ code is subject to the terms of the Mozilla Public License 2.0 at https://mozilla.org/MPL/2.0/
// © AHMEDABDELAZIZZIZO

//@version=5

strategy("Qfl Dca strategy", overlay=true)

// Parameters
swing = input(3 , title = "Swing Points")
mediandropmult = input.float(1.1, "Median drop Mult", step=0.1 , tooltip = "The script Calculate The Median Drop for all last Bases That Was cracked you can Increase or decrease it")
floatinglossvalue = input(-5 , "Floating Loss" , tooltip = "Position Floating Loss to start firs DCA order")
num_orders = input(5 , "Number of all orders" , tooltip = " The number of orders is including the base order and the DCA orders the script will alculate every order qty based on the orders number So that the position size doubles with every order")
length = input(20, title="Length of relative volume" ,tooltip =  " the length of relative volume indicator")
mult = input(2.0, title="Volume Multiplier" , tooltip = "you can adjust the relative volume multiplier to find best parameter")
tpmult = input.float(1, step=0.1 ,title = "Take Profit Multiplier" ,tooltip =  " By default, the script is set to take profits based on the same median drop percent you can adjust it as you like")


// Pivot Calculation
p = ta.pivotlow(low, swing, swing)
v = ta.valuewhen(p, low[swing], 0)

// Variables
var float[] lows = array.new_float()
var float chn = na

// Calculate drops
if v < v[1]
    chn := (v[1] - v) / v[1] * 100
    if array.size(lows) < 4000
        array.push(lows, chn)
    else
        array.shift(lows)
        array.push(lows, chn)

mediandrop = array.avg(lows)
maxdrop = array.max(lows)
mindrop = array.min(lows)

// Table display
textcolor = color.white
// tabl = table.new(position=position.top_right, columns=4, rows=4)
// table.cell(table_id=tabl, column=1, row=1, text="Avg Drop %", width=15, text_color=textcolor)
// table.cell(table_id=tabl, column=2, row=1, text="Min Drop %", width=15, text_color=textcolor)
// table.cell(table_id=tabl, column=3, row=1, text="Max Drop %", width=15, text_color=textcolor)
// table.cell(table_id=tabl, column=1, row=2, text=str.tostring(mediandrop), width=10, text_color=textcolor)
// table.cell(table_id=tabl, column=2, row=2, text=str.tostring(mindrop), width=10, text_color=textcolor)
// table.cell(table_id=tabl, column=3, row=2, text=str.tostring(maxdrop), width=10, text_color=textcolor)

// Plot support
t = fixnan(ta.pivotlow(low, swing, swing))
plot(t, color=ta.change(t) ? na : #03f590b6, linewidth=3, offset=-(swing), title="Support")

// Calculate relative volume
avgVolume = ta.sma(volume, length)
relVolume = volume / avgVolume

// Base Activation
var bool baseisactive = na
if not na(p)
    baseisactive := true

// Buy Signal Calculation
buyprice = v * (1 - (mediandrop / 100) * mediandropmult)
signal = close <= buyprice and relVolume > mult and baseisactive

// Take Profit Calculation
tpsl = (mediandrop / 100)
tp = (strategy.position_avg_price * (1 + (tpsl * tpmult)))

// Position Sizing
capital_per_order(num_orders, equity) =>
    equity / math.pow(2, (num_orders - 1))

equity_per_order = capital_per_order(num_orders, strategy.equity)

qty_per_order(equity_per_order, order_number) =>
    equity_per_order * order_number / close

// Calculate floating loss
floatingLoss = ((close - strategy.position_avg_price) / strategy.position_avg_price) * 100

// Strategy Entries
if signal and strategy.opentrades == 0
    strategy.entry("Buy", strategy.long, qty=qty_per_order(equity_per_order, 1))
    baseisactive := false

for i = 1 to num_orders -1
    if signal and strategy.opentrades == i and floatingLoss <= floatinglossvalue
        strategy.entry("Buy", strategy.long, qty=qty_per_order(equity_per_order, i), comment="DCA Order" + str.tostring(i))
        baseisactive := false

// Strategy Exit
strategy.exit("exit", "Buy", limit=tp)

// Plot
plot(strategy.position_avg_price, color=color.rgb(238, 255, 0), style=plot.style_linebr, linewidth=2)
Detail
https://www.fmz.com/strategy/448073
Last Modified
2024-04-12 17:12:07