
16 KiB
Name
交叉动能趋势跟踪策略SMA-RSI交叉动量系统-Cross-Momentum-Trend-Following-Strategy-SMA-RSI-Cross-Momentum-System
Author
ianzeng123
Strategy Description
[trans]## 概述
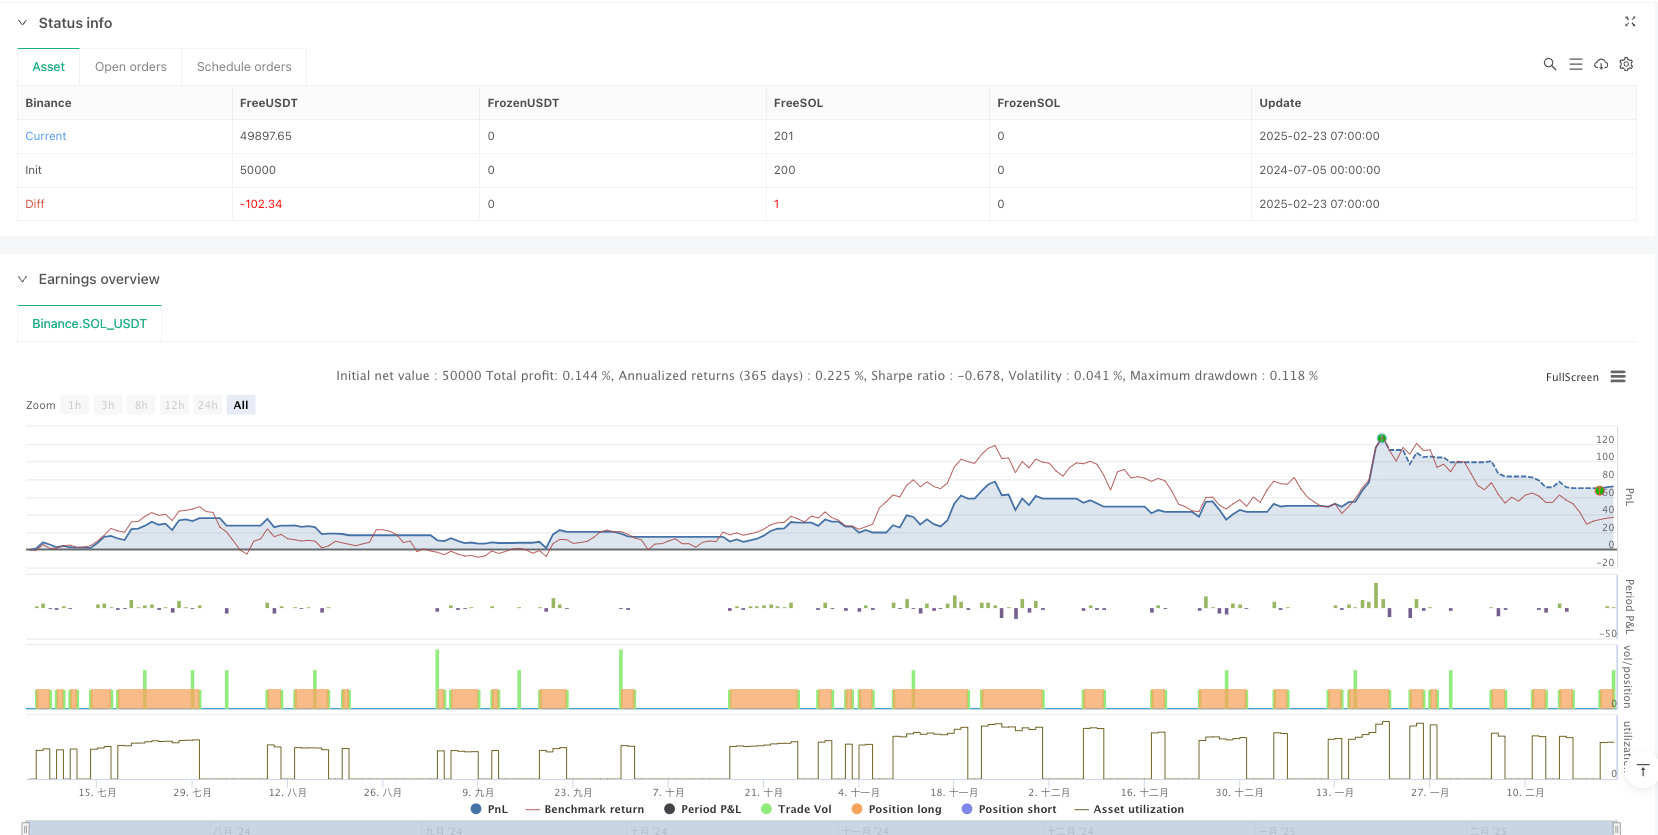
交叉动能趋势跟踪策略是一种简单而高效的交易系统,它巧妙地结合了移动平均线(SMA)和相对强弱指数(RSI)两个技术指标,形成了一个自动化的买卖信号生成系统。该策略利用价格与20周期SMA的交叉点作为主要信号触发条件,同时结合RSI指标的动量确认,过滤掉了一些低质量的交易信号。策略还包含了性能跟踪模块,可实时监控交易成功率和失败率,为交易者提供决策参考。
策略原理
该策略的核心原理是通过价格与均线的交叉来捕捉趋势的转变点,同时利用RSI动量指标进行信号确认,具体如下:
-
买入条件:当价格向上穿越20周期SMA且RSI值大于60时,系统生成买入信号。这一条件结合了趋势和动量两个维度:价格突破均线表明可能形成上升趋势,而高于60的RSI值确认了上涨动能的存在。
-
卖出条件:当价格向下穿越20周期SMA且RSI值小于40时,系统生成卖出信号。同样地,这一条件识别了可能的趋势逆转,并通过低于40的RSI值确认了下跌动能。
-
性能跟踪机制:策略内置了交易性能监控系统,跟踪以下指标:
- 总信号数:记录所有产生的买入信号数量
- 成功计数:价格在买入后上涨超过2%的次数
- 失败计数:价格在买入后7个周期内跌破买入周期低点的次数
-
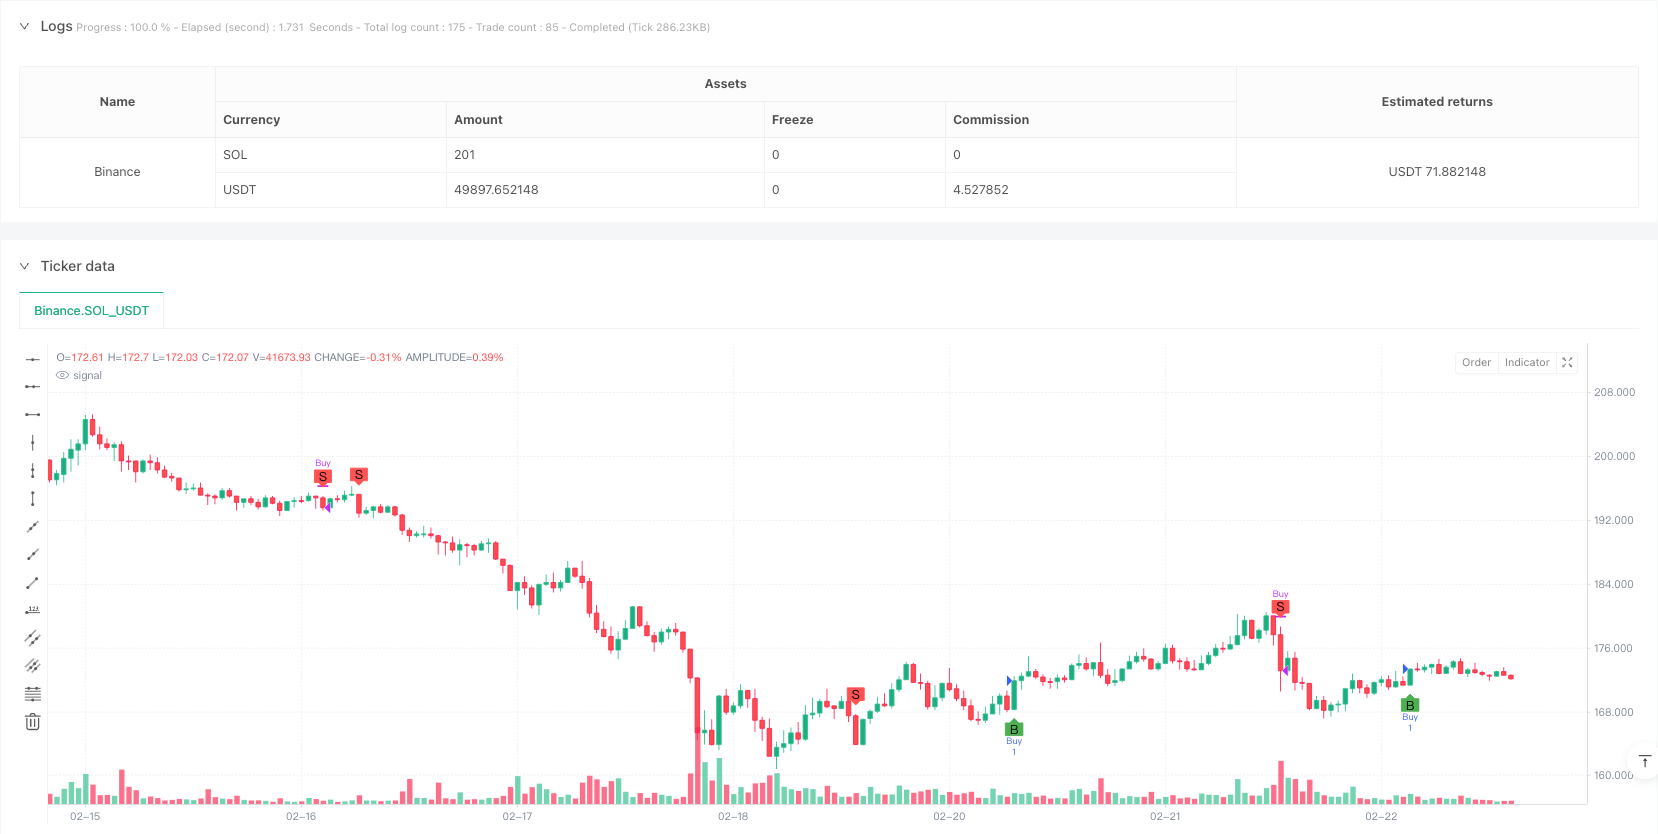
可视化:策略在图表上用"B"(Buy)和"S"(Sell)标记买卖点,并通过表格实时显示性能统计数据。
策略优势
-
简洁高效:仅使用两个常见技术指标(SMA和RSI)构建完整交易系统,降低了过度优化和过拟合的风险。
-
双重确认机制:结合趋势指标(SMA)和动量指标(RSI),提高了信号的可靠性。价格必须不仅突破均线,还需要有足够的动能才能触发交易。
-
自动化程度高:策略完全自动化生成买卖信号,减少了人为情绪干扰,适合系统化交易者使用。
-
内置性能评估:实时跟踪关键性能指标,允许交易者客观评估策略表现,及时调整参数或退出表现不佳的策略。
-
风险控制意识:通过监控买入后7个周期内的价格行为,帮助识别潜在的止损点,培养风险管理意识。
-
直观的可视化:通过图表标记和性能表格,交易者可以直观理解策略执行情况,便于回测分析和策略改进。
策略风险
-
假突破风险:尽管使用RSI进行过滤,策略仍可能在盘整市场中产生大量假突破信号,导致频繁交易和不必要的交易成本。
-
参数敏感性:策略性能高度依赖于SMA周期(20)和RSI周期(8)及其阈值(60/40)的选择。在不同市场环境或品种上,这些固定参数可能表现不佳。
-
缺乏适应性:策略不具备市场环境识别能力,在趋势市场表现良好,但在震荡市场可能频繁亏损。
-
简单止损机制:虽然策略跟踪了失败情况,但没有实际实现动态止损功能,可能导致在剧烈行情中承受过大损失。
-
缺乏仓位管理:策略采用固定仓位进出场,没有根据市场波动性或信号强度调整仓位大小,无法优化资金利用率。
-
性能评估局限性:成功定义为价格上涨2%,这一固定阈值可能不适用于所有市场环境,高波动品种可能需要更高阈值。
策略优化方向
-
加入市场环境过滤器:引入波动率指标(如ATR)或趋势强度指标(如ADX),帮助识别市场状态,在震荡市场降低交易频率或调整参数。
-
参数自适应机制:实现SMA和RSI参数的动态调整,根据近期市场表现自动优化周期和阈值,提高策略适应性。
-
优化仓位管理:基于信号强度(如RSI偏离度)、市场波动性或账户风险设计动态仓位分配系统,控制单笔交易风险。
-
完善止损机制:实现基于ATR的动态止损或跟踪止损功能,更精细地控制每笔交易风险。
-
增加时间过滤:考虑市场时间因素,避开波动性异常时段或低流动性时段交易,提高信号质量。
-
多周期确认:加入多周期分析,要求较大时间周期趋势方向与交易方向一致,过滤掉逆大趋势的交易信号。
-
优化性能评估:改进成功/失败的定义,可考虑采用风险调整后收益或收益/风险比等更全面的评估指标。
总结
交叉动能趋势跟踪策略是一个简洁而实用的交易系统,通过结合SMA和RSI指标,在识别趋势转折点的同时进行动量确认,有效过滤了部分低质量信号。该策略特别适合刚接触量化交易的投资者,既能提供清晰的交易信号,又内置了性能跟踪功能帮助交易者客观评估策略表现。
虽然策略在设计上相对简单,但它体现了量化交易中的重要原则:趋势跟踪、信号确认和性能监控。通过建议的优化方向,如市场环境过滤、参数自适应和完善止损机制等,交易者可以在保持策略核心逻辑的同时,显著提升策略的稳健性和适应性。
这种结合经典技术指标的简单策略往往比复杂算法更具可靠性和生命力,特别是当它们内置了风险管理和性能评估机制时。对于寻求入门级量化策略的交易者,这是一个理想的起点,既能提供实战体验,又为后续策略开发打下基础。 ||
Overview
The Cross-Momentum Trend Following Strategy is a simple yet effective trading system that cleverly combines two technical indicators - Simple Moving Average (SMA) and Relative Strength Index (RSI) - to form an automated buy and sell signal generation system. The strategy utilizes price crossovers with the 20-period SMA as the primary signal trigger condition, while incorporating RSI momentum confirmation to filter out low-quality trading signals. The strategy also includes a performance tracking module that monitors success and failure rates in real-time, providing traders with decision-making reference.
Strategy Principles
The core principle of this strategy is to capture trend reversal points through price and moving average crossovers, while using the RSI momentum indicator for signal confirmation:
-
Buy Condition: When price crosses above the 20-period SMA and the RSI value is greater than 60, the system generates a buy signal. This condition combines two dimensions: price breaking above the moving average indicates a potential uptrend formation, while an RSI value above 60 confirms the presence of upward momentum.
-
Sell Condition: When price crosses below the 20-period SMA and the RSI value is less than 40, the system generates a sell signal. Similarly, this condition identifies potential trend reversals and confirms downward momentum through the sub-40 RSI value.
-
Performance Tracking Mechanism: The strategy has a built-in trade performance monitoring system that tracks the following metrics:
- Total Signal Count: Records the number of all generated buy signals
- Success Count: Number of times price rises more than 2% after buying
- Failure Count: Number of times price falls below the buy candle's low within 7 periods
-
Visualization: The strategy marks buy and sell points on the chart with "B" (Buy) and "S" (Sell), and displays performance statistics in real-time through a table.
Strategy Advantages
-
Simplicity and Efficiency: Uses only two common technical indicators (SMA and RSI) to build a complete trading system, reducing the risk of over-optimization and overfitting.
-
Dual Confirmation Mechanism: Combines trend indicator (SMA) and momentum indicator (RSI), improving signal reliability. Price must not only break through the moving average but also have sufficient momentum to trigger a trade.
-
High Degree of Automation: The strategy completely automates the generation of buy and sell signals, reducing emotional interference and is suitable for systematic traders.
-
Built-in Performance Evaluation: Real-time tracking of key performance metrics allows traders to objectively assess strategy performance and timely adjust parameters or exit underperforming strategies.
-
Risk Control Awareness: By monitoring price behavior within 7 periods after buying, it helps identify potential stop-loss points and cultivates risk management awareness.
-
Intuitive Visualization: Through chart markers and performance tables, traders can intuitively understand strategy execution, facilitating backtesting analysis and strategy improvement.
Strategy Risks
-
False Breakout Risk: Despite using RSI for filtering, the strategy may still produce numerous false breakout signals in consolidating markets, leading to frequent trading and unnecessary transaction costs.
-
Parameter Sensitivity: Strategy performance highly depends on the choice of SMA period (20) and RSI period (8) and their thresholds (60/40). These fixed parameters may perform poorly in different market environments or instruments.
-
Lack of Adaptability: The strategy lacks market environment identification capability, performing well in trending markets but potentially losing frequently in oscillating markets.
-
Simple Stop-Loss Mechanism: Although the strategy tracks failure cases, it does not actually implement dynamic stop-loss functionality, potentially leading to excessive losses in volatile markets.
-
Lack of Position Management: The strategy uses fixed position entry and exit, without adjusting position size based on market volatility or signal strength, failing to optimize capital utilization.
-
Performance Evaluation Limitations: Success is defined as a 2% price increase, which may not be applicable to all market environments; highly volatile instruments may require higher thresholds.
Strategy Optimization Directions
-
Adding Market Environment Filters: Introduce volatility indicators (such as ATR) or trend strength indicators (such as ADX) to help identify market states, reducing trading frequency in oscillating markets or adjusting parameters accordingly.
-
Parameter Adaptive Mechanism: Implement dynamic adjustment of SMA and RSI parameters, automatically optimizing periods and thresholds based on recent market performance to improve strategy adaptability.
-
Optimize Position Management: Design a dynamic position allocation system based on signal strength (such as RSI deviation), market volatility, or account risk to control single trade risk.
-
Improve Stop-Loss Mechanism: Implement ATR-based dynamic stop-loss or trailing stop-loss functionality for more refined control of individual trade risk.
-
Add Time Filters: Consider market time factors, avoiding trading during abnormally volatile periods or low liquidity periods to improve signal quality.
-
Multi-timeframe Confirmation: Add multi-timeframe analysis, requiring larger timeframe trend direction to be consistent with the trading direction, filtering out trades against the major trend.
-
Optimize Performance Evaluation: Improve the definition of success/failure, considering more comprehensive evaluation metrics such as risk-adjusted returns or return/risk ratios.
Summary
The Cross-Momentum Trend Following Strategy is a concise and practical trading system that effectively filters out some low-quality signals by combining SMA and RSI indicators to identify trend turning points while confirming momentum. This strategy is particularly suitable for investors new to quantitative trading, providing clear trading signals while incorporating performance tracking functionality to help traders objectively evaluate strategy performance.
Although relatively simple in design, the strategy embodies important principles in quantitative trading: trend following, signal confirmation, and performance monitoring. Through the suggested optimization directions, such as market environment filtering, parameter adaptation, and improved stop-loss mechanisms, traders can significantly enhance the robustness and adaptability of the strategy while maintaining its core logic.
These simple strategies combining classic technical indicators often prove more reliable and viable than complex algorithms, especially when they incorporate risk management and performance evaluation mechanisms. For traders seeking entry-level quantitative strategies, this is an ideal starting point, providing practical experience while laying the foundation for subsequent strategy development.[/trans]
Source (PineScript)
/*backtest
start: 2024-07-05 00:00:00
end: 2025-02-23 08:00:00
period: 1h
basePeriod: 1h
exchanges: [{"eid":"Binance","currency":"SOL_USDT"}]
*/

//@version=5
strategy("STOCKS TO BUY", overlay=true, fill_orders_on_standard_ohlc=true)

// Define 20-period SMA
sma20 = ta.sma(close, 20)

// RSI Calculation (8-period)
rsiValue = ta.rsi(close, 8)

// Buy Condition: Close crosses above 20-SMA and RSI > 60
buyCondition = ta.crossover(close, sma20) and rsiValue > 60

// Sell Condition: Close crosses below 20-SMA and RSI < 40
sellCondition = ta.crossunder(close, sma20) and rsiValue < 40

// Tracking Performance Metrics
var int totalSignals = 0  // Total number of 'B' signals
var int successCount = 0  // Times price rose >2% from 'B' candle close
var int failureCount = 0  // Times price fell below 'B' candle low within 7 bars

// Store entry price and low when signal occurs
var float entryPrice = na
var float entryLow = na
var int barCounter = na  // Bar counter for tracking 7-candle window

if buyCondition
    strategy.entry("Buy", strategy.long)
    totalSignals := totalSignals + 1  // Increment 'B' count
    entryPrice := close
    entryLow := low
    barCounter := 0  // Reset counter when new 'B' signal appears

if sellCondition
    strategy.close("Buy")  // Close the buy position on sell signal

// Monitor for 7 candles only
if not na(barCounter)
    barCounter := barCounter + 1

    // Check for Success (Price rises >2%)
    success = high >= entryPrice * 1.02
    if success
        successCount := successCount + 1
        entryPrice := na  // Reset entry price after success

    // Check for Failure (Price falls below entryLow within 7 candles)
    failure = low < entryLow and barCounter <= 7
    if failure
        failureCount := failureCount + 1
        entryLow := na  // Reset entry low after failure

    // Stop tracking after 7 candles
    if barCounter > 7
        barCounter := na

// Plot 'B' on chart when buy condition is met
plotshape(series=buyCondition, location=location.belowbar, color=color.green, style=shape.labelup, text="B")

// Plot 'S' on chart when sell condition is met
plotshape(series=sellCondition, location=location.abovebar, color=color.red, style=shape.labeldown, text="S")

// Display Performance Metrics Table
var table performanceTable = table.new(position=position.top_right, columns=2, rows=4, bgcolor=color.gray, border_width=1)

if bar_index % 10 == 0  // Update table every 10 bars for efficiency
    table.cell(performanceTable, 0, 0, "Metric", text_color=color.white, bgcolor=color.blue)
    table.cell(performanceTable, 1, 0, "Value", text_color=color.white, bgcolor=color.blue)

    table.cell(performanceTable, 0, 1, "Total 'B' Signals", text_color=color.white)
    table.cell(performanceTable, 1, 1, str.tostring(totalSignals), text_color=color.white)

    table.cell(performanceTable, 0, 2, "Price Rose >2%", text_color=color.white)
    table.cell(performanceTable, 1, 2, str.tostring(successCount), text_color=color.green)

    table.cell(performanceTable, 0, 3, "Price Fell Below 'B' Low (7 bars)", text_color=color.white)
    table.cell(performanceTable, 1, 3, str.tostring(failureCount), text_color=color.red)
Detail
https://www.fmz.com/strategy/483674
Last Modified
2025-02-25 10:44:04