
9.3 KiB
Name
五均线RSI趋势跟踪动态通道交易系统-Five-EMA-RSI-Trend-Following-Dynamic-Channel-Trading-System
Author
ChaoZhang
Strategy Description
[trans]
概述
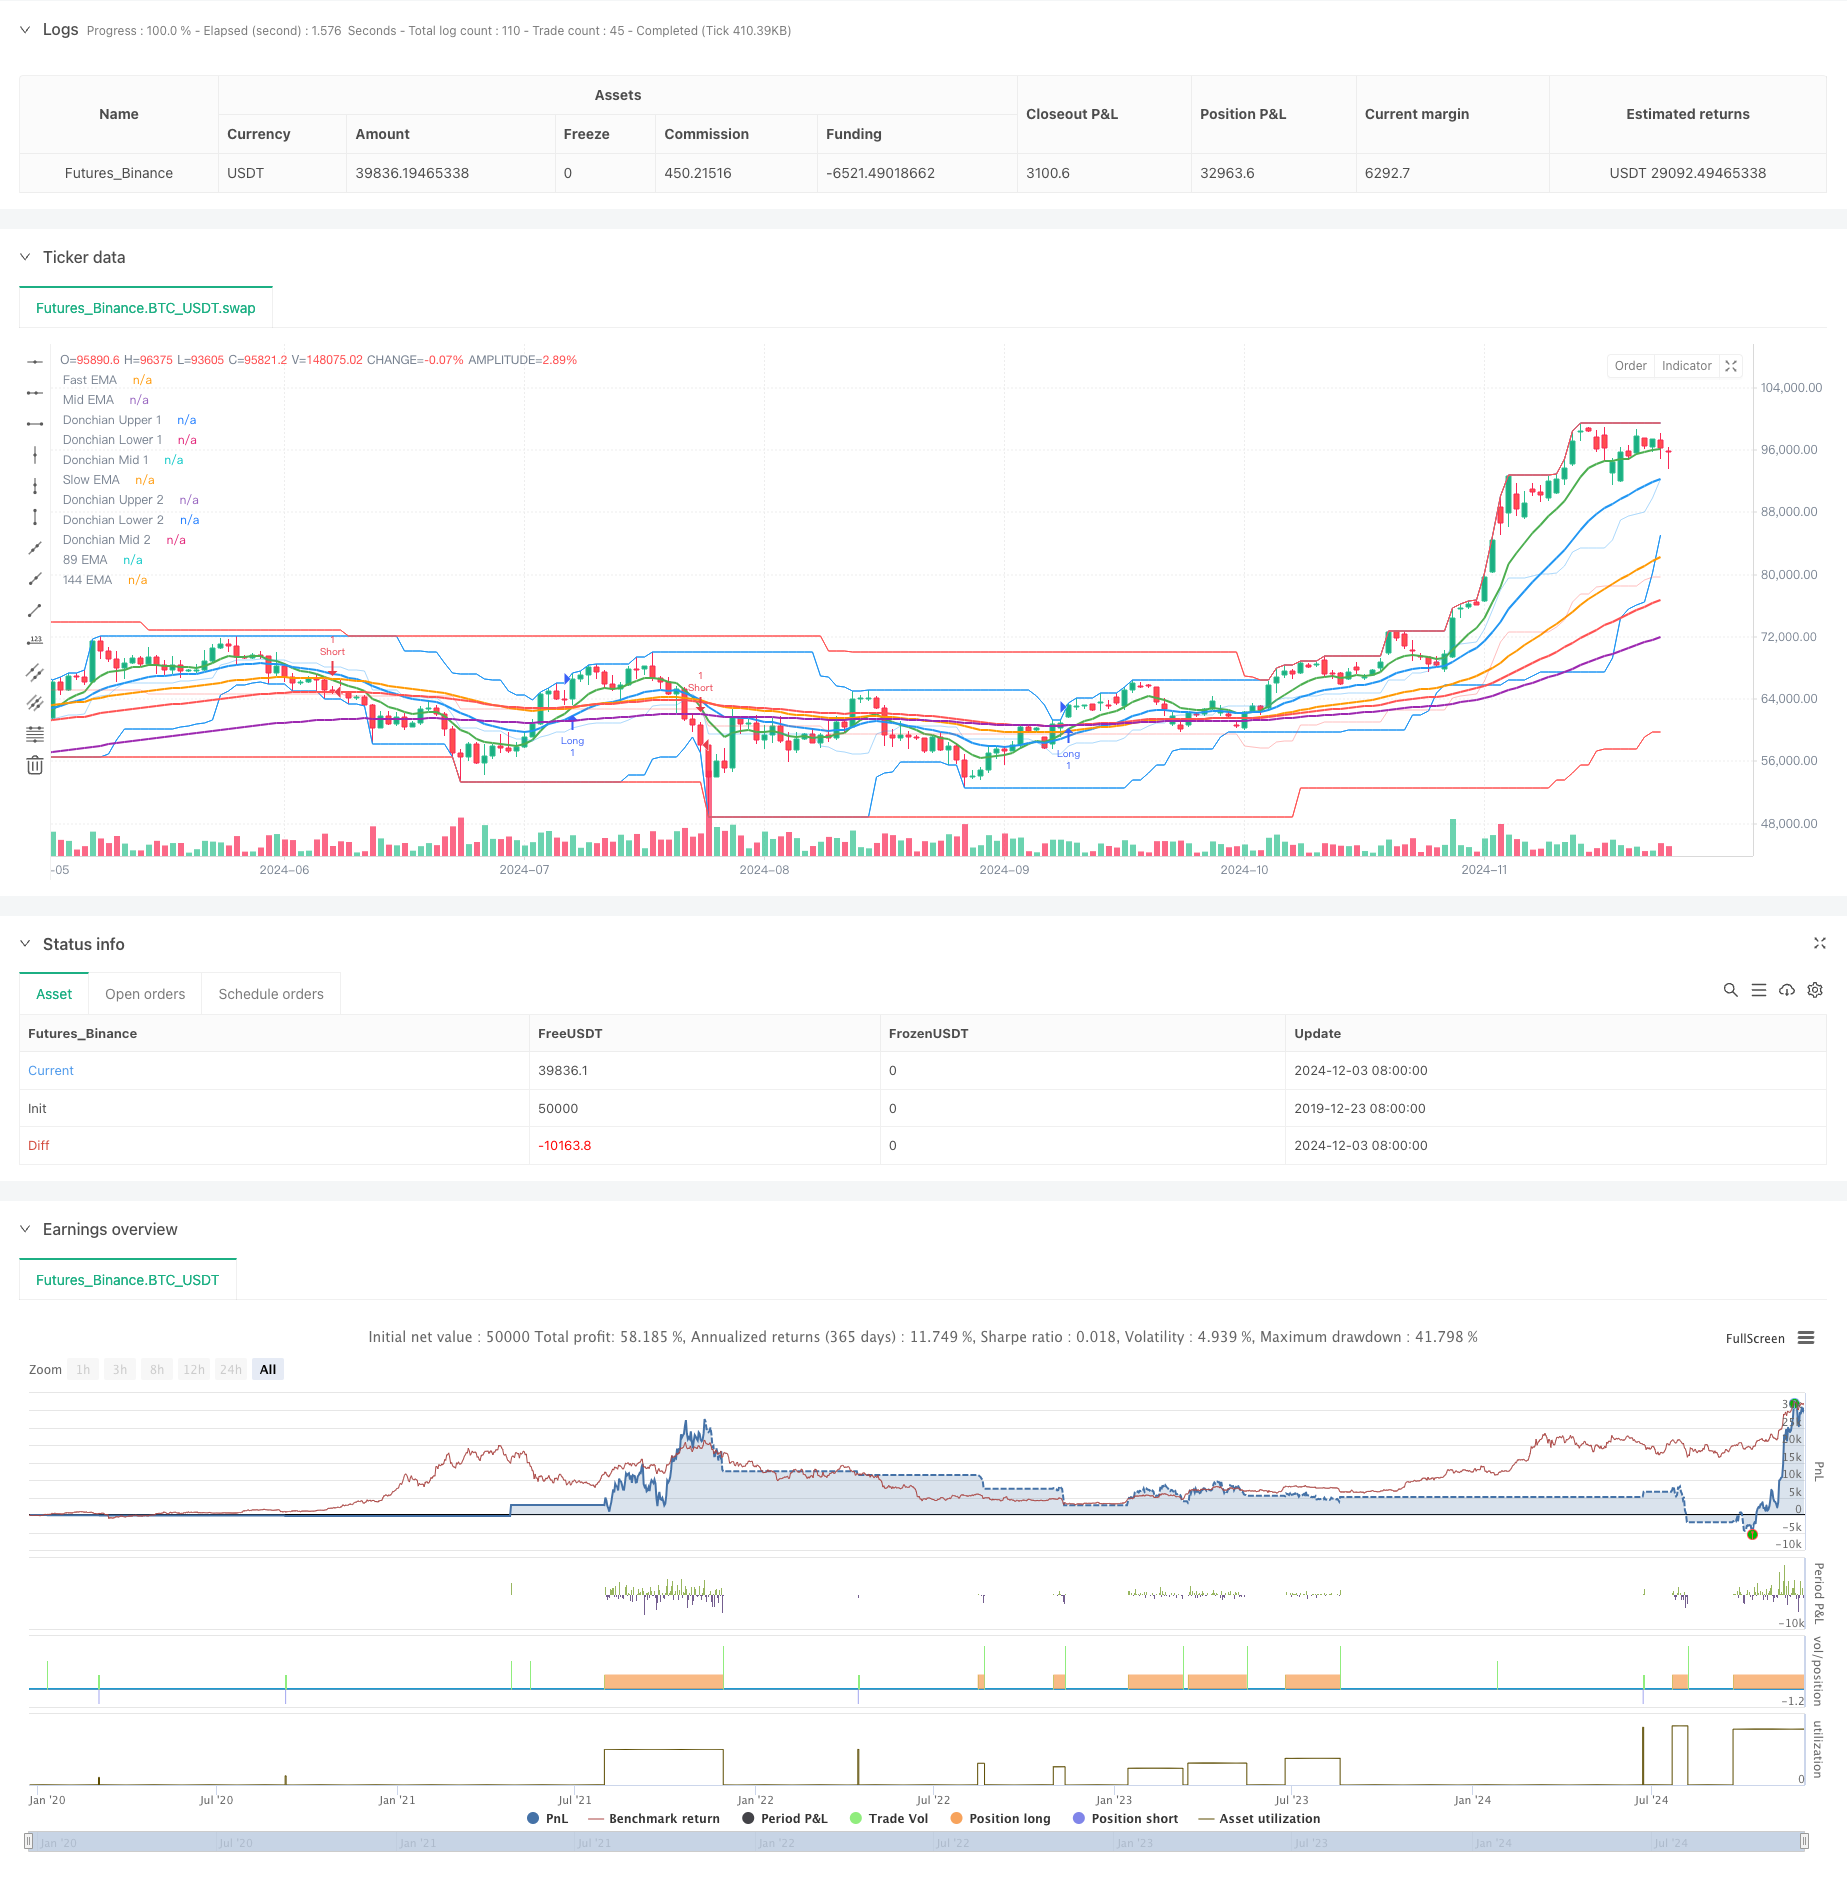
该策略是一个结合了多重技术指标的趋势跟踪系统,主要整合了五条不同周期的指数移动平均线(EMA)、相对强弱指标(RSI)以及两个不同周期的唐奇安通道(Donchian Channel)。系统通过多重指标的配合来捕捉市场趋势,并利用动态止损和获利目标来管理风险和收益。
策略原理
策略采用多层技术指标进行信号确认:首先使用5条EMA(9、21、55、89、144周期)构建趋势框架,通过快速EMA与慢速EMA的交叉确定初步趋势方向。其次,使用RSI(14周期)作为趋势过滤器,要求RSI位于超买区(60以上)才允许做多,位于超卖区(40以下)才允许做空,这样可以避免在盘整市场中频繁交易。最后,通过21周期和74周期的唐奇安通道来确定价格波动范围,为交易提供更多的市场结构参考。
策略优势
- 多重技术指标交叉验证,提高信号可靠性
- 结合趋势跟踪和动量指标,能够在趋势市场中获得良好表现
- 使用动态止损和多重获利目标,既保护资金安全又能充分利用趋势
- 通过RSI过滤信号,降低盘整市场的假信号
- 系统自动化程度高,减少人为干预带来的情绪影响
策略风险
- 多重指标可能导致信号滞后,在快速反转市场中容易产生较大回撤
- RSI过滤可能错过一些重要的趋势起点
- 固定百分比的止损和获利设置可能不适合所有市场环境
- 在高波动市场中,可能频繁触及止损位
- 过多的技术指标可能导致系统过度优化
策略优化方向
- 引入自适应的指标参数,根据市场波动率动态调整
- 增加成交量指标作为辅助确认
- 开发更灵活的止损方案,如跟踪止损或基于ATR的动态止损
- 加入市场环境识别机制,在不同市场条件下使用不同的参数设置
- 考虑增加时间过滤器,避免在不适合交易的时段开仓
总结
该策略通过多重技术指标的组合,构建了一个相对完整的交易系统。虽然存在一定的滞后性,但通过严格的信号过滤和风险管理,能够在趋势市场中获得稳定的收益。建议交易者在实际应用中,根据具体市场特点和自身风险承受能力,对参数进行适当调整。同时,持续监控系统表现,定期评估优化方向,确保策略始终适应市场变化。
||
Overview
This strategy is a trend-following system that combines multiple technical indicators, primarily integrating five Exponential Moving Averages (EMAs) of different periods, the Relative Strength Index (RSI), and two Donchian Channels of different periods. The system captures market trends through the coordination of multiple indicators and manages risk and returns using dynamic stop-loss and profit targets.
Strategy Principles
The strategy employs multiple technical indicators for signal confirmation: First, it uses 5 EMAs (9, 21, 55, 89, 144 periods) to construct a trend framework, determining initial trend direction through crossovers between fast and slow EMAs. Second, it uses RSI (14 periods) as a trend filter, requiring RSI to be in the overbought zone (above 60) for long positions and oversold zone (below 40) for short positions, thus avoiding frequent trading in ranging markets. Finally, it uses 21-period and 74-period Donchian Channels to define price movement ranges, providing additional market structure reference for trading.
Strategy Advantages
- Multiple technical indicators cross-validation improves signal reliability
- Combination of trend-following and momentum indicators performs well in trending markets
- Uses dynamic stop-loss and multiple profit targets to protect capital while maximizing trend utilization
- RSI filtering reduces false signals in ranging markets
- High degree of system automation reduces emotional interference
Strategy Risks
- Multiple indicators may lead to signal lag, causing significant drawdowns in quick reversal markets
- RSI filtering might miss important trend beginnings
- Fixed percentage stop-loss and profit targets may not suit all market conditions
- Frequent stop-loss hits possible in highly volatile markets
- Too many technical indicators may lead to system over-optimization
Optimization Directions
- Introduce adaptive indicator parameters that adjust dynamically based on market volatility
- Add volume indicators as auxiliary confirmation
- Develop more flexible stop-loss strategies, such as trailing stops or ATR-based dynamic stops
- Implement market condition recognition mechanism for different parameter settings in different market conditions
- Consider adding time filters to avoid trading during unfavorable periods
Conclusion
The strategy constructs a relatively complete trading system through the combination of multiple technical indicators. While it has some lag, it can achieve stable returns in trending markets through strict signal filtering and risk management. Traders are advised to adjust parameters according to specific market characteristics and their risk tolerance in practical applications. Meanwhile, continuous monitoring of system performance and regular evaluation of optimization directions are necessary to ensure the strategy remains adaptable to market changes.[/trans]
Source (PineScript)
/*backtest
start: 2019-12-23 08:00:00
end: 2024-12-04 00:00:00
period: 1d
basePeriod: 1d
exchanges: [{"eid":"Futures_Binance","currency":"BTC_USDT"}]
*/

//@version=5
strategy("EMA RSI Donchian Strategy", overlay=true)

// Input parameters
fastEmaLength = input(9, title="Fast EMA Length")
midEmaLength = input(21, title="Mid EMA Length")
slowEmaLength = input(55, title="Slow EMA Length")
ema89Length = input(89, title="89 EMA Length")
ema144Length = input(144, title="144 EMA Length")
rsiPeriod = input(14, title="RSI Period")
rsiOverbought = input(60, title="RSI Overbought Level")
rsiOversold = input(40, title="RSI Oversold Level")
donchianLength1 = input(21, title="Donchian Channel Length 1")
donchianLength2 = input(74, title="Donchian Channel Length 2")

// EMA calculations
fastEma = ta.ema(close, fastEmaLength)
midEma = ta.ema(close, midEmaLength)
slowEma = ta.ema(close, slowEmaLength)
ema89 = ta.ema(close, ema89Length)
ema144 = ta.ema(close, ema144Length)

// RSI calculation
rsi = ta.rsi(close, rsiPeriod)

// Donchian Channel calculations
donchianUpper1 = ta.highest(high, donchianLength1)
donchianLower1 = ta.lowest(low, donchianLength1)
donchianUpper2 = ta.highest(high, donchianLength2)
donchianLower2 = ta.lowest(low, donchianLength2)
donchianMid1 = (donchianUpper1 + donchianLower1) / 2
donchianMid2 = (donchianUpper2 + donchianLower2) / 2

// Plot EMAs
plot(fastEma, color=color.green, linewidth=2, title="Fast EMA")
plot(midEma, color=color.blue, linewidth=2, title="Mid EMA")
plot(slowEma, color=color.orange, linewidth=2, title="Slow EMA")
plot(ema89, color=color.red, linewidth=2, title="89 EMA")
plot(ema144, color=color.purple, linewidth=2, title="144 EMA")

// Plot Donchian Channels
plot(donchianUpper1, color=color.new(color.blue, 0), title="Donchian Upper 1")
plot(donchianLower1, color=color.new(color.blue, 0), title="Donchian Lower 1")
plot(donchianMid1, color=color.new(color.blue, 80), title="Donchian Mid 1")
plot(donchianUpper2, color=color.new(color.red, 0), title="Donchian Upper 2")
plot(donchianLower2, color=color.new(color.red, 0), title="Donchian Lower 2")
plot(donchianMid2, color=color.new(color.red, 80), title="Donchian Mid 2")

// Entry Conditions
longCondition = ta.crossover(fastEma, slowEma) and rsi > rsiOverbought
shortCondition = ta.crossunder(fastEma, slowEma) and rsi < rsiOversold

// Stop Loss and Take Profit
var float longStopLoss = na
var float longTakeProfit1 = na
var float longTakeProfit2 = na
var float shortStopLoss = na
var float shortTakeProfit1 = na
var float shortTakeProfit2 = na

if longCondition
    longStopLoss := high * 0.99
    longTakeProfit1 := longStopLoss * 1.02618
    longTakeProfit2 := longStopLoss * 1.036185
    strategy.entry("Long", strategy.long)

if shortCondition
    shortStopLoss := low * 1.01
    shortTakeProfit1 := shortStopLoss * 0.97382
    shortTakeProfit2 := shortTakeProfit1 * 0.96381
    strategy.entry("Short", strategy.short)

// Exit Conditions
if not na(longStopLoss)
    strategy.exit("Take Profit 1", "Long", limit=longTakeProfit1)
    strategy.exit("Take Profit 2", "Long", limit=longTakeProfit2)
    strategy.exit("Stop Loss", "Long", stop=longStopLoss)

if not na(shortStopLoss)
    strategy.exit("Take Profit 1", "Short", limit= shortTakeProfit1)
    strategy.exit("Take Profit 2", "Short", limit=shortTakeProfit2)
    strategy.exit("Stop Loss", "Short", stop=shortStopLoss)

// Labels for buy and sell signals
if longCondition
    label.new(bar_index, low, "Buy", color=color.green, style=label.style_label_up, textcolor=color.white)

if shortCondition
    label.new(bar_index, high, "Sell", color=color.red, style=label.style_label_down, textcolor=color.white)

// Alerts
alertcondition(longCondition, title="Long Entry Alert", message="Long entry signal")
alertcondition(shortCondition, title="Short Entry Alert", message="Short entry signal")
Detail
https://www.fmz.com/strategy/474038
Last Modified
2024-12-05 15:15:28