
7.0 KiB
Name
五分钟开盘突破ATR动态止盈止损量化交易策略-Five-Minute-Opening-Breakout-Strategy-with-Dynamic-ATR-Based-Stop-Loss-and-Take-Profit
Author
ianzeng123
Strategy Description
[trans]
概述
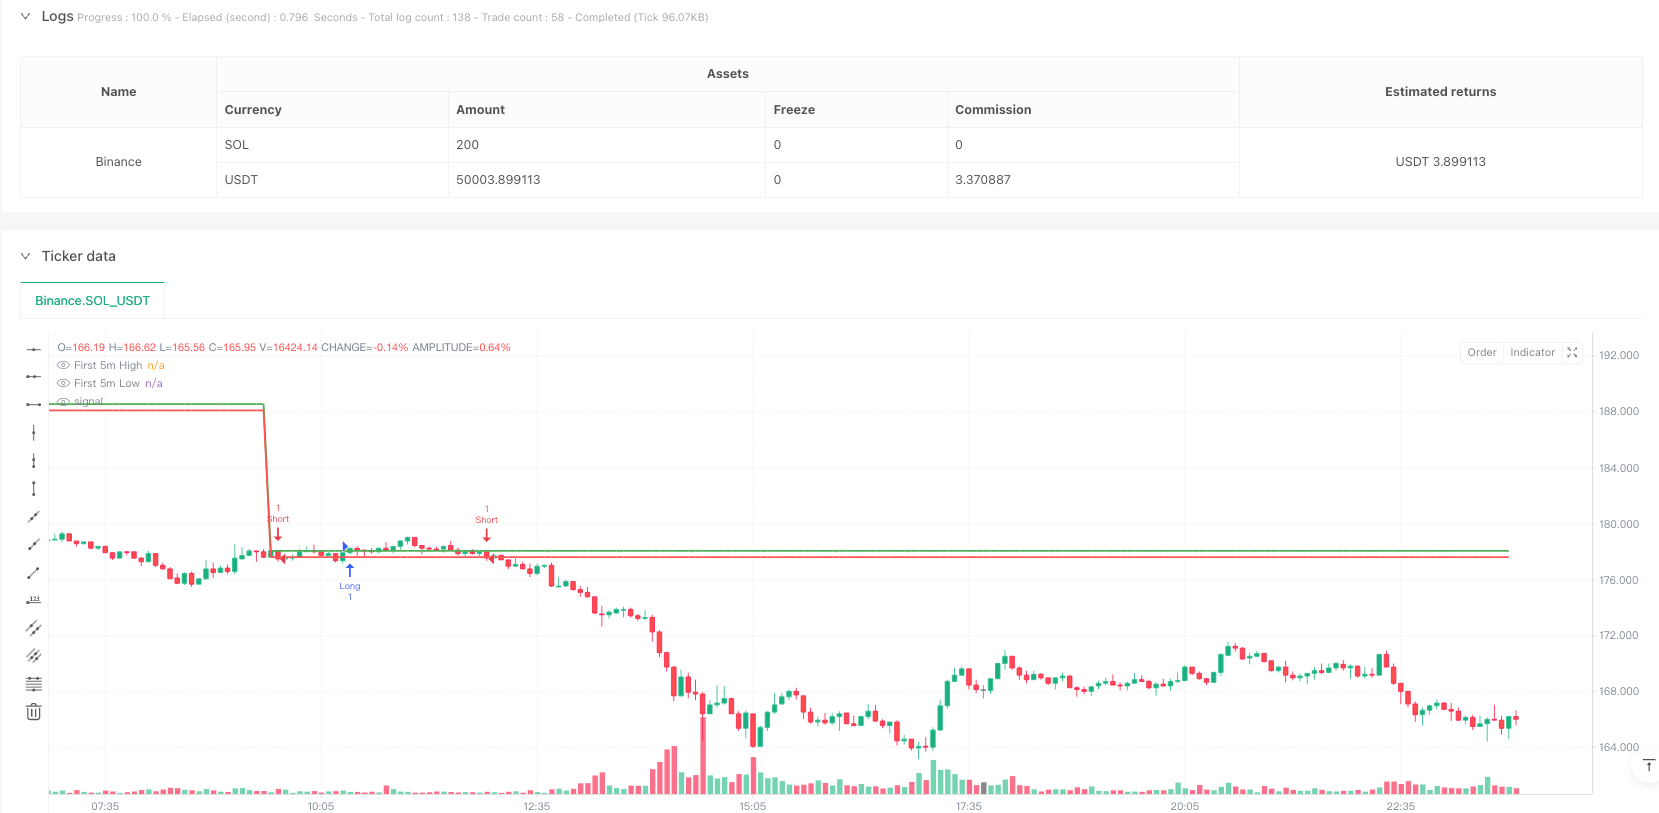
该策略是一个基于五分钟开盘突破的量化交易系统,结合ATR指标进行动态止盈止损管理。策略主要通过识别开盘后第一根五分钟K线的高低点作为关键价格区间,当价格突破该区间时触发交易信号,并使用基于ATR的动态止损来控制风险。
策略原理
策略的核心逻辑包含以下几个关键步骤:
- 确定交易时段起始点(以纽约证券交易所9:30开盘为例)
- 捕捉开盘后第一根五分钟K线,记录其开盘价、最高价和最低价
- 当价格突破第一根K线高点时,触发做多信号;突破低点时,触发做空信号
- 使用14周期ATR指标计算波动率,用于设置动态止损位
- 采用1:1.5的风险收益比设置止盈止损,其中止损距离为1倍ATR,止盈距离为突破区间的1.5倍
策略优势
- 时间框架精准:专注于开盘后最活跃的五分钟交易时段,捕捉市场初始波动
- 风险管理完善:通过ATR动态调整止损位置,适应市场波动性变化
- 执行标准化:使用明确的突破信号和固定的风险收益比,降低主观判断
- 自适应性强:ATR指标能根据市场波动度自动调整止损范围
- 操作简单直观:策略逻辑清晰,便于实际执行和回测验证
策略风险
- 假突破风险:开盘时段波动可能造成虚假突破信号
- 滑点影响:高波动期间的订单执行可能面临较大滑点
- ATR参数敏感:14周期设置可能不适合所有市场环境
- 固定倍数局限:1:1.5的风险收益比可能需要根据品种特性调整
- 交易成本考量:频繁交易可能产生较高交易成本
策略优化方向
- 信号过滤:引入成交量确认或动量指标,减少假突破
- 参数自适应:开发ATR周期的动态调整机制
- 时间过滤:增加具体时间段的交易限制,避开低效率时段
- 止损优化:研究基于市场微观结构的止损方法
- 分品种优化:根据不同交易品种的特性调整风险收益比
总结
这是一个结构完整、逻辑清晰的量化交易策略,通过对开盘价格突破的监测和ATR动态止损的运用,实现了风险可控的自动化交易。策略的核心优势在于其简单而有效的设计理念,但也需要针对不同市场环境和交易品种进行持续优化。建议交易者在实盘使用前进行充分的回测验证,并根据实际情况调整参数设置。 ||
Overview
This strategy is a quantitative trading system based on five-minute opening breakout combined with dynamic ATR-based stop-loss management. It identifies key price levels from the first five-minute candle after market open, generates trading signals upon breakouts, and implements dynamic risk control using ATR-based stops.
Strategy Principles
The core logic includes the following key steps:
- Determine trading session start time (e.g., NYSE 9:30 AM)
- Capture the first five-minute candle, recording its open, high, and low prices
- Generate long signals on high breakout and short signals on low breakout
- Calculate volatility using 14-period ATR for dynamic stop-loss placement
- Implement 1:1.5 risk-reward ratio with stop-loss at 1x ATR and take-profit at 1.5x the breakout range
Strategy Advantages
- Precise Timeframe: Focuses on the most active five-minute period after market open
- Robust Risk Management: Dynamically adjusts stop-loss levels using ATR
- Standardized Execution: Uses clear breakout signals and fixed risk-reward ratio
- High Adaptability: ATR indicator automatically adjusts to market volatility
- Simple Implementation: Clear strategy logic facilitates testing and execution
Strategy Risks
- False Breakout Risk: Opening volatility may generate false signals
- Slippage Impact: High volatility periods may face significant slippage
- ATR Parameter Sensitivity: 14-period setting may not suit all market conditions
- Fixed Multiplier Limitation: 1:1.5 risk-reward ratio may need adjustment
- Transaction Cost Consideration: Frequent trading may incur high costs
Optimization Directions
- Signal Filtering: Incorporate volume confirmation or momentum indicators
- Parameter Adaptation: Develop dynamic ATR period adjustment mechanism
- Time Filtering: Add specific timeframe restrictions
- Stop-Loss Enhancement: Research market microstructure-based stop methods
- Instrument-Specific Optimization: Adjust risk-reward ratios per instrument
Summary
This is a well-structured quantitative trading strategy that achieves controlled risk automated trading through opening price breakout monitoring and ATR dynamic stops. Its core strength lies in its simple yet effective design, though it requires continuous optimization for different market environments and instruments. Traders should conduct thorough backtesting and adjust parameters according to actual conditions before live implementation.[/trans]
Source (PineScript)
/*backtest
start: 2025-02-13 00:00:00
end: 2025-02-19 00:00:00
period: 5m
basePeriod: 5m
exchanges: [{"eid":"Binance","currency":"SOL_USDT"}]
*/

//@version=5
strategy("5-Min Open Candle Breakout", overlay=true)

// Get the current bar's year, month, and day
currentYear = year
currentMonth = month
currentDay = dayofmonth

// Define session start time (adjust based on market)
sessionStart = timestamp(currentYear, currentMonth, currentDay, 9, 30) // 9:30 AM for NYSE

// Identify the first 5-minute candle
isFirstCandle = (time >= sessionStart and time < sessionStart + 300000)  // 5 min = 300,000 ms

var float openPrice = na
var float highPrice = na
var float lowPrice = na

if isFirstCandle
    openPrice := open
    highPrice := high
    lowPrice := low

// Breakout Conditions
longEntry = ta.crossover(close, highPrice)
shortEntry = ta.crossunder(close, lowPrice)

// Define Stop Loss & Take Profit (Ratio 1:1.5)
slFactor = 1.0  // Stop Loss Multiplier
tpFactor = 1.5  // Take Profit Multiplier

atrValue = ta.atr(14)  // Fix: Use ta.atr() instead of atr()

longSL = lowPrice - atrValue * slFactor
longTP = highPrice + (highPrice - lowPrice) * tpFactor

shortSL = highPrice + atrValue * slFactor
shortTP = lowPrice - (highPrice - lowPrice) * tpFactor

// Execute Trades
strategy.entry("Long", strategy.long, when=longEntry)
strategy.exit("Exit Long", from_entry="Long", stop=longSL, limit=longTP)

strategy.entry("Short", strategy.short, when=shortEntry)
strategy.exit("Exit Short", from_entry="Short", stop=shortSL, limit=shortTP)

// Plot High/Low of First Candle
plot(highPrice, title="First 5m High", color=color.green, linewidth=2)
plot(lowPrice, title="First 5m Low", color=color.red, linewidth=2)
Detail
https://www.fmz.com/strategy/482863
Last Modified
2025-02-27 17:33:35