
32 KiB
Name
三重指标动量反转策略Triple-Indicator-Momentum-Reversal-Strategy
Author
ChaoZhang
Strategy Description
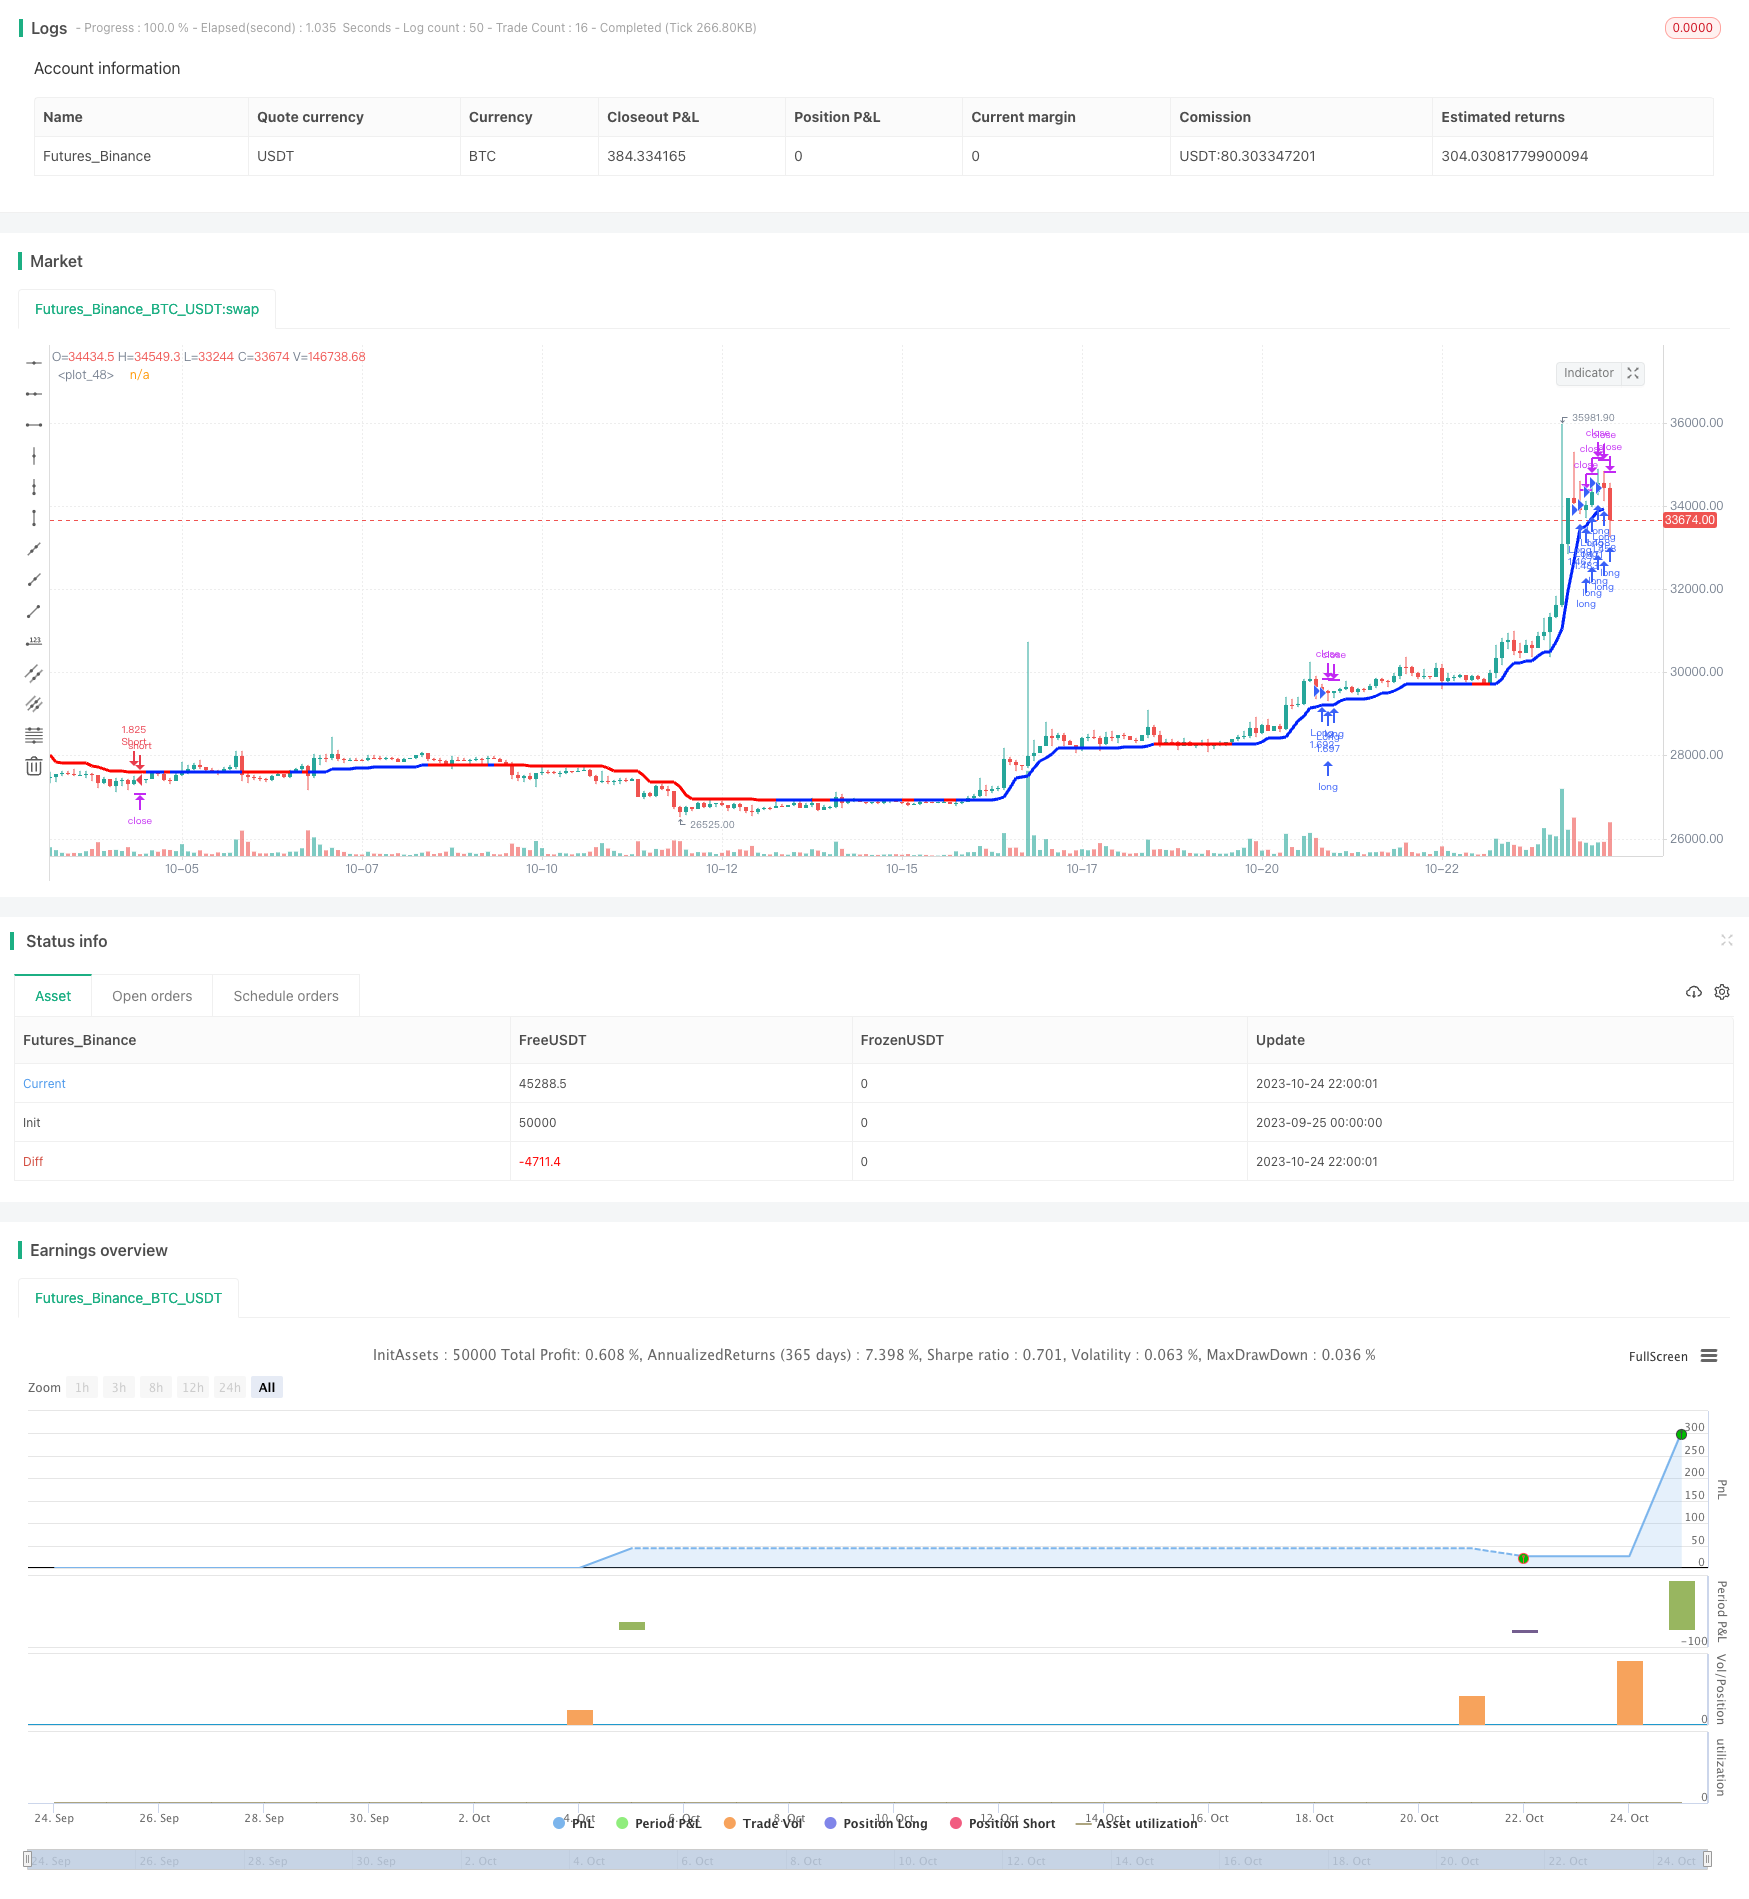
[trans]
概述
该策略综合运用三个开源公共指标——趋势魔术指标、压缩动量指标和累积增量成交量指标,以发掘市场中的剧烈变动。这三个指标相互验证,可以有效识别市场反转点。本策略试图在这三个指标同时发出买入/卖出信号时开仓,实现低风险的动量反转交易。
策略原理
本策略使用1分钟或3分钟K线,设置止损为收盘价的1.5倍ATR。
首先,趋势魔术指标结合ATR指标判断市场趋势和波动性。CCI指标大于0表示正在发生波动,此时若ATR指标的位置高于价格表示向上趋势,反之则表示向下趋势。
其次,压缩动量指标判断波动加剧和缩减的时机。当布林带收缩在基尔特通道内时表示市场波动度降低,这种压缩状态持续一段时间后,布林带必然会突破基尔特通道,引发价格的剧烈涨跌。
最后,累积增量成交量指标通过计算买卖双方成交量差异推断市场力量。成交量以买方为多方时,表示多头力量增强。
当三个指标同时发出信号时,证实市场正处于反转点附近,这时开仓做反向操作。
优势分析
- 利用多个指标确认,可以有效避免假突破
- 突破布林带和基尔特通道具有较高胜率
- 成交量反转预示着力量的转移,支持反转信号
- 反转交易风险较低,适合短线操作
风险分析
- 单一时间周期操作风险较大,容易被套
- 反转不一定出现在首次突破点,存在错过最佳点位的风险
- 需要同时监控更长时间周期,避免逆势操作
- 可根据大周期趋势方向,选择只做长单或短单
- 可设置ADX条件,在趋向不明确时回避操作
优化方向
- 增加跨时间周期验证,利用更长周期判断趋势
- 增加产品筛选,选择波动较大的交易品种
- 调整指标参数,优化指标效果
- 增加机器学习模型辅助判断,提升胜率
- 结合情绪指标,在极端市场情绪出现时反其道而行之
总结
该策略综合运用多个指标判断市场走势,在多个指标发出一致信号时开仓交易。相较单一指标,能够过滤掉更多假信号。但由于仅在一个时间周期操作,在趋势行情中仍易被套牢。下一步可通过引入机器学习等更高级技术提升效果,或结合更长时间周期指标避免逆势操作,使策略在更多市场中适用。
||
Overview
This strategy combines three open-source public indicators - Trend Magic, Squeeze Momentum, and Cumulative Delta Volume to detect extreme movements in the market. These three indicators verify each other and can effectively identify reversal points in the market. This strategy attempts to open positions when all three indicators give buy/sell signals simultaneously, in order to implement low-risk momentum reversal trading.
Strategy Logic
This strategy uses 1-minute or 3-minute candlestick chart, with a stop loss of 1.5 times the ATR from the closing price.
Firstly, the Trend Magic indicator, together with the ATR indicator, judges the trend and volatility of the market. When the CCI indicator is above 0, it indicates that volatility is taking place. At this time, if the ATR indicator position is higher than the price, it indicates an upward trend, otherwise it indicates a downward trend.
Secondly, the Squeeze Momentum indicator judges when volatility increases and decreases. When Bollinger Bands are compressed within Keltner Channels, it indicates that market volatility is decreasing. After this compression state lasts for a period of time, Bollinger Bands will inevitably break through the Keltner Channels, triggering extreme price rises or falls.
Finally, the Cumulative Delta Volume indicator deduces market forces by calculating the difference between buy and sell trading volumes. When trading volume is dominated by the buying side, it indicates that bullish forces are strengthening.
When all three indicators give signals at the same time, it confirms that the market is near a reversal point. At this time, open positions to trade against the current direction.
Advantage Analysis
- Using multiple indicators to confirm can effectively avoid false breakouts
- Breaking Bollinger Bands and Keltner Channels has a relatively high win rate
- Volume reversals indicate a shift in forces, supporting reversal signals
- Reversal trading has relatively low risks and is suitable for short-term operations
Risk Analysis
- Trading on a single timeframe poses significant risks of being trapped
- Reversals may not occur at the first breakout point, risk missing the optimal entry
- Need to also monitor longer timeframes to avoid trading against the trend
- Can choose to only go long or short based on the major trend direction
- Can set ADX conditions to avoid trading when trend is unclear
Optimization Directions
- Add cross-timeframe validation, using longer periods to determine the trend
- Add product screening, choose products with higher volatility
- Adjust indicator parameters to optimize indicator effects
- Incorporate machine learning models to improve win rate
- Combine sentiment indicators, trade against extremes in market sentiment
Conclusion
This strategy uses multiple indicators to determine market trends, and opens positions when multiple indicators give consistent signals. Compared to single indicators, it can filter out more false signals. But since it only operates on a single timeframe, it is still prone to being trapped in trending markets. Next steps could be to incorporate more advanced techniques like machine learning to improve performance, or combine longer timeframe indicators to avoid trading against the trend, making the strategy viable in more market conditions.
[/trans]
Strategy Arguments
| Argument | Default | Description |
|---|---|---|
| v_input_bool_1 | true | Use Heiken Ashi |
| v_input_bool_2 | true | Is Crypto? |
| v_input_1 | 20 | CCI period |
| v_input_2 | 2 | ATR Multiplier |
| v_input_3 | 5 | ATR Period |
| v_input_4 | 17 | Number of bars to look back to validate Trend Magic trend |
| v_input_6 | 2 | BB MultFactor |
| v_input_7 | 10 | KC Length |
| v_input_8 | 1.5 | KC MultFactor |
| v_input_9 | true | Use TrueRange (KC) |
| v_input_10 | 14 | Number of bars to look back to validate Sqz Mom trend |
| v_input_11 | true | Heikin Ashi Candles? |
| v_input_bool_3 | false | SMA 1 |
| v_input_int_1 | 50 | ma1len |
| v_input_color_1 | lime | ma1col |
| v_input_bool_4 | false | SMA 2 |
| v_input_int_2 | 200 | ma2len |
| v_input_color_2 | red | ma2col |
| v_input_bool_5 | false | EMA 1 |
| v_input_int_3 | 50 | ema1len |
| v_input_color_3 | lime | ema1col |
| v_input_bool_6 | false | EMA 2 |
| v_input_int_4 | 200 | ema2len |
| v_input_color_4 | red | ema2col |
| v_input_color_5 | lime | Body |
| v_input_color_6 | red | colordown |
| v_input_color_7 | #74e05e | Border |
| v_input_color_8 | #ffad7d | bcoldown |
| v_input_color_9 | #b5b5b8 | Wicks |
| v_input_color_10 | #b5b5b8 | wcoldown |
| v_input_12 | 14 | Number of bars to look back to validate CDV trend |
| v_input_5 | 10 | (?Squeeze Momentum)BB Length |
| v_input_string_1 | 0 | (?Cumlative Delta Volume)Style: Candle |
| v_input_bool_7 | false | (?ADX)Average Directional Index (ADX) |
| v_input_13 | 14 | ADX Smoothing |
| v_input_14 | 14 | DI Length |
| v_input_15 | 25 | ADX Threshold |
| v_input_bool_8 | true | (?Date Range)Start |
| v_input_16 | timestamp(1 Jan 2019) | startPeriodTime |
| v_input_bool_9 | true | End |
| v_input_17 | timestamp(31 Dec 2030) | endPeriodTime |
| v_input_string_2 | 0 | (?Trade Direction)Trade Direction: Long and Short |
| v_input_float_1 | 2 | (?Take Profit)Take Profit 1 - Target % |
| v_input_int_5 | 100 | % Of Position |
| v_input_float_2 | 100 | Take Profit 2 - Target % |
| v_input_int_6 | 100 | % Of Position |
| v_input_float_3 | 100 | Take Profit 3 - Target % |
| v_input_int_7 | 100 | % Of Position |
| v_input_float_4 | 100 | Take Profit 4 - Target % |
| v_input_float_5 | 6 | (?Stop Loss)Stop Loss (%) |
| v_input_float_6 | true | (?Leverage)Leverage |
| v_input_string_3 | CRYPTANEX_99FTX_Strategy-Name-Here | (?ProfitView Alert Syntax)Alert Syntax Prefix |
| v_input_bool_10 | false | (?Dashboard)Show Dashboard |
Source (PineScript)
/*backtest
start: 2023-09-25 00:00:00
end: 2023-10-25 00:00:00
period: 2h
basePeriod: 15m
exchanges: [{"eid":"Futures_Binance","currency":"BTC_USDT"}]
*/

// This source code is subject to the terms of the Mozilla Public License 2.0 at https://mozilla.org/MPL/2.0/
// © myn

//@version=5
strategy('Strategy Myth-Busting #11 - TrendMagic+SqzMom+CDV - [MYN]', max_bars_back=5000, overlay=true, pyramiding=0, initial_capital=1000, currency='USD', default_qty_type=strategy.percent_of_equity, default_qty_value=1, commission_value=0.075, use_bar_magnifier = false)

// HA to Regular Candlestick resolover
useHA = input.bool(true, "Use Heiken Ashi")

CLOSE = close
OPEN = open
HIGH = high
LOW = low

CLOSE := useHA ? (OPEN + CLOSE + HIGH + LOW) / 4 : CLOSE
OPEN := useHA ? na(OPEN[1]) ? (OPEN + CLOSE) / 2: (OPEN[1] + CLOSE[1]) / 2 : OPEN
HIGH := useHA ? math.max(HIGH, math.max(OPEN, CLOSE)) : HIGH
LOW := useHA ? math.min(LOW, math.min(OPEN, CLOSE)) : LOW

isCrypto = input.bool(true, "Is Crypto?")

// Functions
f_priorBarsSatisfied(_objectToEval, _numOfBarsToLookBack) =>
    returnVal = false
    for i = 0 to _numOfBarsToLookBack
        if (_objectToEval[i] == true)
            returnVal = true


/////////////////////////////////////
//* Put your strategy logic below *//
/////////////////////////////////////

// Trend Magic by KivancOzbilgic
//░░░░░░░░░░░░░░░░░░░░░░░░░░░░░░░░░░░░░░░░░░░░░░░░░░░░░░░░░░░░░░░░░░░░░░░░░░░░░░░░░░░░░░░░░░░░░░░░░░░░░░░░░░░░░░░░░░░░░░░░░░░░░░░░░░░░░░░░░░░░░░░░░░

period = input(20, 'CCI period')
coeff = input(2, 'ATR Multiplier')
AP = input(5, 'ATR Period')
ATR = ta.sma(ta.tr, AP)
src = CLOSE
upT = LOW - ATR * coeff
downT = HIGH + ATR * coeff
MagicTrend = 0.0
MagicTrend := ta.cci(src, period) >= 0 ? upT < nz(MagicTrend[1]) ? nz(MagicTrend[1]) : upT : downT > nz(MagicTrend[1]) ? nz(MagicTrend[1]) : downT
color1 = ta.cci(src, period) >= 0 ? #0022FC : #FC0400
plot(MagicTrend, color=color1, linewidth=3)
alertcondition(ta.cross(CLOSE, MagicTrend), title='Cross Alert', message='Price - MagicTrend Crossing!')
alertcondition(ta.crossover(LOW, MagicTrend), title='CrossOver Alarm', message='BUY SIGNAL!')
alertcondition(ta.crossunder(HIGH, MagicTrend), title='CrossUnder Alarm', message='SELL SIGNAL!')

i_numLookbackBarsTM = input(17,title="Number of bars to look back to validate Trend Magic trend")
//trendMagicEntryLong = trendMagicEntryConditionLong and f_priorBarsSatisfied(trendMagicEntryConditionLong,i_numLookbackBarsTM)
//trendMagicEntryShort = trendMagicEntryConditionShort and f_priorBarsSatisfied(trendMagicEntryConditionShort,i_numLookbackBarsTM)

trendMagicEntryConditionLong = ta.cci(src, period) >= 0 and src > MagicTrend + (isCrypto ? 5 : 0 )
trendMagicEntryConditionShort = ta.cci(src, period) < 0 and src < MagicTrend - (isCrypto ? 5 : 0)

trendMagicEntryLong = trendMagicEntryConditionLong and ta.barssince(trendMagicEntryConditionShort) > i_numLookbackBarsTM
trendMagicEntryShort = trendMagicEntryConditionShort and ta.barssince(trendMagicEntryConditionLong) > i_numLookbackBarsTM


// Squeeze Momentum by LazyBear
//░░░░░░░░░░░░░░░░░░░░░░░░░░░░░░░░░░░░░░░░░░░░░░░░░░░░░░░░░░░░░░░░░░░░░░░░░░░░░░░░░░░░░░░░░░░░░░░░░░░░░░░░░░░░░░░░░░░░░░░░░░░░░░░░░░░░░░░░░░░░░░░░░░


length = input(10, title='BB Length', group="Squeeze Momentum")
mult = input(2.0, title='BB MultFactor')
lengthKC = input(10, title='KC Length')
multKC = input(1.5, title='KC MultFactor')

useTrueRange = input(true, title='Use TrueRange (KC)')

// Calculate BB
source = CLOSE
basis = ta.sma(source, length)
dev = multKC * ta.stdev(source, length)
upperBB = basis + dev
lowerBB = basis - dev

// Calculate KC
ma = ta.sma(source, lengthKC)
range_1 = useTrueRange ? ta.tr : HIGH - LOW
rangema = ta.sma(range_1, lengthKC)
upperKC = ma + rangema * multKC
lowerKC = ma - rangema * multKC

sqzOn = lowerBB > lowerKC and upperBB < upperKC
sqzOff = lowerBB < lowerKC and upperBB > upperKC
noSqz = sqzOn == false and sqzOff == false

val = ta.linreg(source - math.avg(math.avg(ta.highest(HIGH, lengthKC), ta.lowest(LOW, lengthKC)), ta.sma(CLOSE, lengthKC)), lengthKC, 0)

iff_1 = val > nz(val[1]) ? color.lime : color.green
iff_2 = val < nz(val[1]) ? color.red : color.maroon
bcolor = val > 0 ? iff_1 : iff_2
scolor = noSqz ? color.blue : sqzOn ? color.black : color.gray
//plot(val, color=bcolor, style=plot.style_histogram, linewidth=4)
//plot(0, color=scolor, style=plot.style_cross, linewidth=2)

i_numLookbackBarsSM = input(14,title="Number of bars to look back to validate Sqz Mom trend")
//sqzmomEntryLong = val > 0 and f_priorBarsSatisfied(val > 0,i_numLookbackBarsSM)
//sqzmomEntryShort = val < 0 and f_priorBarsSatisfied(val < 0,i_numLookbackBarsSM)


sqzmomEntryConditionLong = val > 0
sqzmomEntryConditionShort = val < 0
sqzmomEntryLong = sqzmomEntryConditionLong and ta.barssince(sqzmomEntryConditionShort) > i_numLookbackBarsSM
sqzmomEntryShort = sqzmomEntryConditionShort and ta.barssince(sqzmomEntryConditionLong) > i_numLookbackBarsSM


// Cumulative Delta Volume by LonesomeTheBlue
//░░░░░░░░░░░░░░░░░░░░░░░░░░░░░░░░░░░░░░░░░░░░░░░░░░░░░░░░░░░░░░░░░░░░░░░░░░░░░░░░░░░░░░░░░░░░░░░░░░░░░░░░░░░░░░░░░░░░░░░░░░░░░░░░░░░░░░░░░░░░░░░░░░

linestyle = input.string(defval='Candle', title='Style', options=['Candle', 'Line'], group="Cumlative Delta Volume")
hacandle = input(defval=true, title='Heikin Ashi Candles?')
showma1 = input.bool(defval=false, title='SMA 1', inline='ma1')
ma1len = input.int(defval=50, title='', minval=1, inline='ma1')
ma1col = input.color(defval=color.lime, title='', inline='ma1')
showma2 = input.bool(defval=false, title='SMA 2', inline='ma2')
ma2len = input.int(defval=200, title='', minval=1, inline='ma2')
ma2col = input.color(defval=color.red, title='', inline='ma2')
showema1 = input.bool(defval=false, title='EMA 1', inline='ema1')
ema1len = input.int(defval=50, title='', minval=1, inline='ema1')
ema1col = input.color(defval=color.lime, title='', inline='ema1')
showema2 = input.bool(defval=false, title='EMA 2', inline='ema2')
ema2len = input.int(defval=200, title='', minval=1, inline='ema2')
ema2col = input.color(defval=color.red, title='', inline='ema2')
colorup = input.color(defval=color.lime, title='Body', inline='bcol')
colordown = input.color(defval=color.red, title='', inline='bcol')
bcolup = input.color(defval=#74e05e, title='Border', inline='bocol')
bcoldown = input.color(defval=#ffad7d, title='', inline='bocol')
wcolup = input.color(defval=#b5b5b8, title='Wicks', inline='wcol')
wcoldown = input.color(defval=#b5b5b8, title='', inline='wcol')

tw = HIGH - math.max(OPEN, CLOSE)
bw = math.min(OPEN, CLOSE) - LOW
body = math.abs(CLOSE - OPEN)

_rate(cond) =>
    ret = 0.5 * (tw + bw + (cond ? 2 * body : 0)) / (tw + bw + body)
    ret := nz(ret) == 0 ? 0.5 : ret
    ret

deltaup = volume * _rate(OPEN <= CLOSE)
deltadown = volume * _rate(OPEN > CLOSE)
delta = CLOSE >= OPEN ? deltaup : -deltadown
cumdelta = ta.cum(delta)
float ctl = na
float o = na
float h = na
float l = na
float c = na
if linestyle == 'Candle'
    o := cumdelta[1]
    h := math.max(cumdelta, cumdelta[1])
    l := math.min(cumdelta, cumdelta[1])
    c := cumdelta
    ctl
else
    ctl := cumdelta
    ctl

plot(ctl, title='CDV Line', color=color.new(color.blue, 0), linewidth=2)

float haclose = na
float haopen = na
float hahigh = na
float halow = na
haclose := (o + h + l + c) / 4
haopen := na(haopen[1]) ? (o + c) / 2 : (haopen[1] + haclose[1]) / 2
hahigh := math.max(h, math.max(haopen, haclose))
halow := math.min(l, math.min(haopen, haclose))

c_ = hacandle ? haclose : c
o_ = hacandle ? haopen : o
h_ = hacandle ? hahigh : h
l_ = hacandle ? halow : l

//plotcandle(o_, h_, l_, c_, title='CDV Candles', color=o_ <= c_ ? colorup : colordown, bordercolor=o_ <= c_ ? bcolup : bcoldown, wickcolor=o_ <= c_ ? bcolup : bcoldown)

//plot(showma1 and linestyle == 'Candle' ? ta.sma(c_, ma1len) : na, title='SMA 1', color=ma1col)
//plot(showma2 and linestyle == 'Candle' ? ta.sma(c_, ma2len) : na, title='SMA 2', color=ma2col)
//plot(showema1 and linestyle == 'Candle' ? ta.ema(c_, ema1len) : na, title='EMA 1', color=ema1col)
//plot(showema2 and linestyle == 'Candle' ? ta.ema(c_, ema2len) : na, title='EMA 2', color=ema2col)

i_numLookbackBarsCDV = input(14,title="Number of bars to look back to validate CDV trend")
//cdvEntryLong = o_ < c_ and f_priorBarsSatisfied(o_ < c_,i_numLookbackBarsCDV)
//cdvEntryShort = o_ > c_ and f_priorBarsSatisfied(o_ > c_,i_numLookbackBarsCDV)

cdvEntryConditionLong = o_ <= c_
cdvEntryConditionShort = o_ > c_
cdvEntryLong = cdvEntryConditionLong and ta.barssince(cdvEntryConditionShort) > i_numLookbackBarsCDV
cdvEntryShort = cdvEntryConditionShort and ta.barssince(cdvEntryConditionLong) > i_numLookbackBarsCDV


//////////////////////////////////////
//* Put your strategy rules below *//
/////////////////////////////////////

longCondition = trendMagicEntryLong and sqzmomEntryLong and cdvEntryLong
shortCondition = trendMagicEntryShort and sqzmomEntryShort and cdvEntryShort

//define as 0 if do not want to use
closeLongCondition = 0
closeShortCondition = 0


// ADX
//░░░░░░░░░░░░░░░░░░░░░░░░░░░░░░░░░░░░░░░░░░░░░░░░░░░░░░░░░░░░░░░░░░░░░░░░░░░░░░░░░░░░░░░░░░░░░░░░░░░░░░░░░░░░░░░░░░░░░░░░░░░░░░░░░░░░░░░░░░░░░░░░░░

adxEnabled = input.bool(defval = false , title = "Average Directional Index (ADX)", tooltip = "", group ="ADX" )
adxlen = input(14, title="ADX Smoothing", group="ADX")
adxdilen = input(14, title="DI Length", group="ADX")
adxabove = input(25, title="ADX Threshold", group="ADX")

adxdirmov(len) =>
	adxup = ta.change(HIGH)
	adxdown = -ta.change(LOW)
	adxplusDM = na(adxup) ? na : (adxup > adxdown and adxup > 0 ? adxup : 0)
	adxminusDM = na(adxdown) ? na : (adxdown > adxup and adxdown > 0 ? adxdown : 0)
	adxtruerange = ta.rma(ta.tr, len)
	adxplus = fixnan(100 * ta.rma(adxplusDM, len) / adxtruerange)
	adxminus = fixnan(100 * ta.rma(adxminusDM, len) / adxtruerange)
	[adxplus, adxminus]
adx(adxdilen, adxlen) =>
	[adxplus, adxminus] = adxdirmov(adxdilen)
	adxsum = adxplus + adxminus
	adx = 100 * ta.rma(math.abs(adxplus - adxminus) / (adxsum == 0 ? 1 : adxsum), adxlen)

adxsig = adxEnabled ? adx(adxdilen, adxlen) : na
isADXEnabledAndAboveThreshold = adxEnabled ? (adxsig > adxabove) : true

//Backtesting Time Period (Input.time not working as expected as of 03/30/2021.  Giving odd start/end dates
//░░░░░░░░░░░░░░░░░░░░░░░░░░░░░░░░░░░░░░░░░░░░░░░░░░░░░░░░░░░░░░░░░░░░░░░░░░░░░░░░░░░░░░░░░░░░░░░░░░░░░░░░░░░░░░░░░░░░░░░░░░░░░░░░░░░░░░░░░░░░░░░░░░
useStartPeriodTime = input.bool(true, 'Start', group='Date Range', inline='Start Period')
startPeriodTime = input(timestamp('1 Jan 2019'), '', group='Date Range', inline='Start Period')
useEndPeriodTime = input.bool(true, 'End', group='Date Range', inline='End Period')
endPeriodTime = input(timestamp('31 Dec 2030'), '', group='Date Range', inline='End Period')

start = useStartPeriodTime ? startPeriodTime >= time : false
end = useEndPeriodTime ? endPeriodTime <= time : false
calcPeriod = true

// Trade Direction
// ░░░░░░░░░░░░░░░░░░░░░░░░░░░░░░░░░░░░░░░░░░░░░░░░░░░░░░░░░░░░░░░░░░░░░░░░░░░░░░░░░░░░░░░░░░░░░░░░░░░░░░░░░░░░░░░░░░░░░░░░░░░░░░░░░░░░░░░░░░░░░░░░░░
tradeDirection = input.string('Long and Short', title='Trade Direction', options=['Long and Short', 'Long Only', 'Short Only'], group='Trade Direction')

// Percent as Points
// ░░░░░░░░░░░░░░░░░░░░░░░░░░░░░░░░░░░░░░░░░░░░░░░░░░░░░░░░░░░░░░░░░░░░░░░░░░░░░░░░░░░░░░░░░░░░░░░░░░░░░░░░░░░░░░░░░░░░░░░░░░░░░░░░░░░░░░░░░░░░░░░░░░
per(pcnt) =>
    strategy.position_size != 0 ? math.round(pcnt / 100 * strategy.position_avg_price / syminfo.mintick) : float(na)

// Take profit 1
// ░░░░░░░░░░░░░░░░░░░░░░░░░░░░░░░░░░░░░░░░░░░░░░░░░░░░░░░░░░░░░░░░░░░░░░░░░░░░░░░░░░░░░░░░░░░░░░░░░░░░░░░░░░░░░░░░░░░░░░░░░░░░░░░░░░░░░░░░░░░░░░░░░░
tp1 = input.float(title='Take Profit 1 - Target %', defval=2, minval=0.0, step=0.5, group='Take Profit', inline='Take Profit 1')
q1 = input.int(title='% Of Position', defval=100, minval=0, group='Take Profit', inline='Take Profit 1')

// Take profit 2
// ░░░░░░░░░░░░░░░░░░░░░░░░░░░░░░░░░░░░░░░░░░░░░░░░░░░░░░░░░░░░░░░░░░░░░░░░░░░░░░░░░░░░░░░░░░░░░░░░░░░░░░░░░░░░░░░░░░░░░░░░░░░░░░░░░░░░░░░░░░░░░░░░░░
tp2 = input.float(title='Take Profit 2 - Target %', defval=100, minval=0.0, step=0.5, group='Take Profit', inline='Take Profit 2')
q2 = input.int(title='% Of Position', defval=100, minval=0, group='Take Profit', inline='Take Profit 2')

// Take profit 3
// ░░░░░░░░░░░░░░░░░░░░░░░░░░░░░░░░░░░░░░░░░░░░░░░░░░░░░░░░░░░░░░░░░░░░░░░░░░░░░░░░░░░░░░░░░░░░░░░░░░░░░░░░░░░░░░░░░░░░░░░░░░░░░░░░░░░░░░░░░░░░░░░░░░
tp3 = input.float(title='Take Profit 3 - Target %', defval=100, minval=0.0, step=0.5, group='Take Profit', inline='Take Profit 3')
q3 = input.int(title='% Of Position', defval=100, minval=0, group='Take Profit', inline='Take Profit 3')

// Take profit 4
// ░░░░░░░░░░░░░░░░░░░░░░░░░░░░░░░░░░░░░░░░░░░░░░░░░░░░░░░░░░░░░░░░░░░░░░░░░░░░░░░░░░░░░░░░░░░░░░░░░░░░░░░░░░░░░░░░░░░░░░░░░░░░░░░░░░░░░░░░░░░░░░░░░░
tp4 = input.float(title='Take Profit 4 - Target %', defval=100, minval=0.0, step=0.5, group='Take Profit')

/// Stop Loss
// ░░░░░░░░░░░░░░░░░░░░░░░░░░░░░░░░░░░░░░░░░░░░░░░░░░░░░░░░░░░░░░░░░░░░░░░░░░░░░░░░░░░░░░░░░░░░░░░░░░░░░░░░░░░░░░░░░░░░░░░░░░░░░░░░░░░░░░░░░░░░░░░░░░
stoplossPercent = input.float(title='Stop Loss (%)', defval=6, minval=0.01, group='Stop Loss') * 0.01
slLongClose = CLOSE < strategy.position_avg_price * (1 - stoplossPercent)
slShortClose = CLOSE > strategy.position_avg_price * (1 + stoplossPercent)

/// Leverage
// ░░░░░░░░░░░░░░░░░░░░░░░░░░░░░░░░░░░░░░░░░░░░░░░░░░░░░░░░░░░░░░░░░░░░░░░░░░░░░░░░░░░░░░░░░░░░░░░░░░░░░░░░░░░░░░░░░░░░░░░░░░░░░░░░░░░░░░░░░░░░░░░░░░
leverage = input.float(1, 'Leverage', step=.5, group='Leverage')
contracts = math.min(math.max(.000001, strategy.equity / CLOSE * leverage), 1000000000)


/// Trade State Management
// ░░░░░░░░░░░░░░░░░░░░░░░░░░░░░░░░░░░░░░░░░░░░░░░░░░░░░░░░░░░░░░░░░░░░░░░░░░░░░░░░░░░░░░░░░░░░░░░░░░░░░░░░░░░░░░░░░░░░░░░░░░░░░░░░░░░░░░░░░░░░░░░░░░

isInLongPosition = strategy.position_size > 0
isInShortPosition = strategy.position_size < 0

/// ProfitView Alert Syntax String Generation
// ░░░░░░░░░░░░░░░░░░░░░░░░░░░░░░░░░░░░░░░░░░░░░░░░░░░░░░░░░░░░░░░░░░░░░░░░░░░░░░░░░░░░░░░░░░░░░░░░░░░░░░░░░░░░░░░░░░░░░░░░░░░░░░░░░░░░░░░░░░░░░░░░░░

alertSyntaxPrefix = input.string(defval='CRYPTANEX_99FTX_Strategy-Name-Here', title='Alert Syntax Prefix', group='ProfitView Alert Syntax')
alertSyntaxBase = alertSyntaxPrefix + '\n#' + str.tostring(OPEN) + ',' + str.tostring(HIGH) + ',' + str.tostring(LOW) + ',' + str.tostring(CLOSE) + ',' + str.tostring(volume) + ','


/// Trade Execution
// ░░░░░░░░░░░░░░░░░░░░░░░░░░░░░░░░░░░░░░░░░░░░░░░░░░░░░░░░░░░░░░░░░░░░░░░░░░░░░░░░░░░░░░░░░░░░░░░░░░░░░░░░░░░░░░░░░░░░░░░░░░░░░░░░░░░░░░░░░░░░░░░░░░

longConditionCalc = (longCondition and isADXEnabledAndAboveThreshold)
shortConditionCalc = (shortCondition and isADXEnabledAndAboveThreshold)

if calcPeriod
    if longConditionCalc and tradeDirection != 'Short Only' and isInLongPosition == false
        strategy.entry('Long', strategy.long, qty=contracts)

        alert(message=alertSyntaxBase + 'side:long', freq=alert.freq_once_per_bar_close)

    if shortConditionCalc and tradeDirection != 'Long Only' and isInShortPosition == false
        strategy.entry('Short', strategy.short, qty=contracts)

        alert(message=alertSyntaxBase + 'side:short', freq=alert.freq_once_per_bar_close)

    //Inspired from Multiple %% profit exits example by adolgo https://www.tradingview.com/script/kHhCik9f-Multiple-profit-exits-example/
    strategy.exit('TP1', qty_percent=q1, profit=per(tp1))
    strategy.exit('TP2', qty_percent=q2, profit=per(tp2))
    strategy.exit('TP3', qty_percent=q3, profit=per(tp3))
    strategy.exit('TP4', profit=per(tp4))

    strategy.close('Long', qty_percent=100, comment='SL Long', when=slLongClose)
    strategy.close('Short', qty_percent=100, comment='SL Short', when=slShortClose)

    strategy.close_all(when=closeLongCondition or closeShortCondition, comment='Close Postion')

/// Dashboard
// ░░░░░░░░░░░░░░░░░░░░░░░░░░░░░░░░░░░░░░░░░░░░░░░░░░░░░░░░░░░░░░░░░░░░░░░░░░░░░░░░░░░░░░░░░░░░░░░░░░░░░░░░░░░░░░░░░░░░░░░░░░░░░░░░░░░░░░░░░░░░░░░░░░
// Inspired by https://www.tradingview.com/script/uWqKX6A2/ - Thanks VertMT

showDashboard = input.bool(group="Dashboard", title="Show Dashboard", defval=false)

f_fillCell(_table, _column, _row, _title, _value, _bgcolor, _txtcolor) =>
    _cellText = _title + "\n" + _value
    table.cell(_table, _column, _row, _cellText, bgcolor=_bgcolor, text_color=_txtcolor, text_size=size.auto)

// Draw dashboard table
if showDashboard
    var bgcolor = color.new(color.black,0)

    // Keep track of Wins/Losses streaks
    newWin  = (strategy.wintrades  > strategy.wintrades[1]) and (strategy.losstrades == strategy.losstrades[1]) and (strategy.eventrades == strategy.eventrades[1])
    newLoss = (strategy.wintrades == strategy.wintrades[1]) and (strategy.losstrades  > strategy.losstrades[1]) and (strategy.eventrades == strategy.eventrades[1])

    varip int winRow     = 0
    varip int lossRow    = 0
    varip int maxWinRow  = 0
    varip int maxLossRow = 0

    if newWin
        lossRow := 0
        winRow := winRow + 1
    if winRow > maxWinRow
        maxWinRow := winRow

    if newLoss
        winRow := 0
        lossRow := lossRow + 1
    if lossRow > maxLossRow
        maxLossRow := lossRow


    // Prepare stats table
    var table dashTable = table.new(position.bottom_right, 1, 15, border_width=1)


    if barstate.islastconfirmedhistory
        // Update table
        dollarReturn = strategy.netprofit
        f_fillCell(dashTable, 0, 0, "Start:", str.format("{0,date,long}", strategy.closedtrades.entry_time(0)) , bgcolor, color.white) // + str.format(" {0,time,HH:mm}", strategy.closedtrades.entry_time(0))
        f_fillCell(dashTable, 0, 1, "End:", str.format("{0,date,long}", strategy.opentrades.entry_time(0)) , bgcolor, color.white) // + str.format(" {0,time,HH:mm}", strategy.opentrades.entry_time(0))
        _profit = (strategy.netprofit / strategy.initial_capital) * 100
        f_fillCell(dashTable, 0, 2, "Net Profit:", str.tostring(_profit, '##.##') + "%", _profit > 0 ? color.green : color.red, color.white)
        _numOfDaysInStrategy = (strategy.opentrades.entry_time(0) - strategy.closedtrades.entry_time(0)) / (1000 * 3600 * 24)
        f_fillCell(dashTable, 0, 3, "Percent Per Day", str.tostring(_profit / _numOfDaysInStrategy, '#########################.#####')+"%", _profit > 0 ? color.green : color.red, color.white)
        _winRate = ( strategy.wintrades / strategy.closedtrades ) * 100
        f_fillCell(dashTable, 0, 4, "Percent Profitable:", str.tostring(_winRate, '##.##') + "%", _winRate < 50 ? color.red : _winRate < 75 ? #999900 : color.green, color.white)
        f_fillCell(dashTable, 0, 5, "Profit Factor:", str.tostring(strategy.grossprofit / strategy.grossloss,  '##.###'), strategy.grossprofit > strategy.grossloss ? color.green : color.red, color.white)
        f_fillCell(dashTable, 0, 6, "Total Trades:", str.tostring(strategy.closedtrades), bgcolor, color.white)
        f_fillCell(dashTable, 0, 8, "Max Wins In A Row:", str.tostring(maxWinRow, '######') , bgcolor, color.white)
        f_fillCell(dashTable, 0, 9, "Max Losses In A Row:", str.tostring(maxLossRow, '######') , bgcolor, color.white)
Detail
https://www.fmz.com/strategy/430260
Last Modified
2023-10-26 16:12:33