
8.8 KiB
Name
三重布林带标准差趋势跟踪策略-Triple-Bollinger-Band-Standard-Deviation-Trend-Following-Strategy
Author
ianzeng123
Strategy Description
[trans]
概述
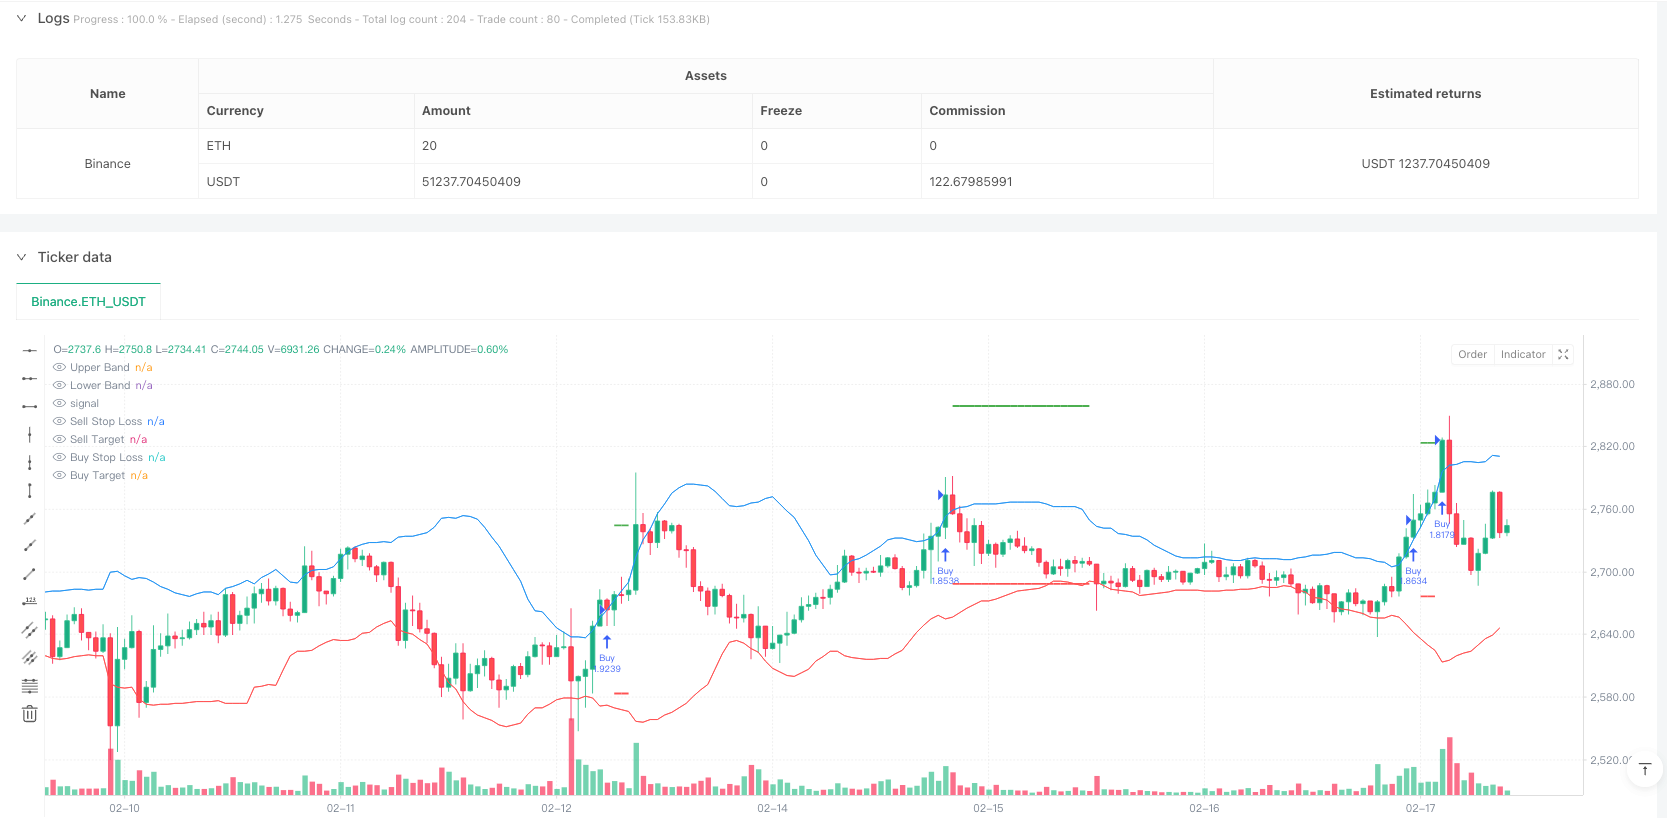
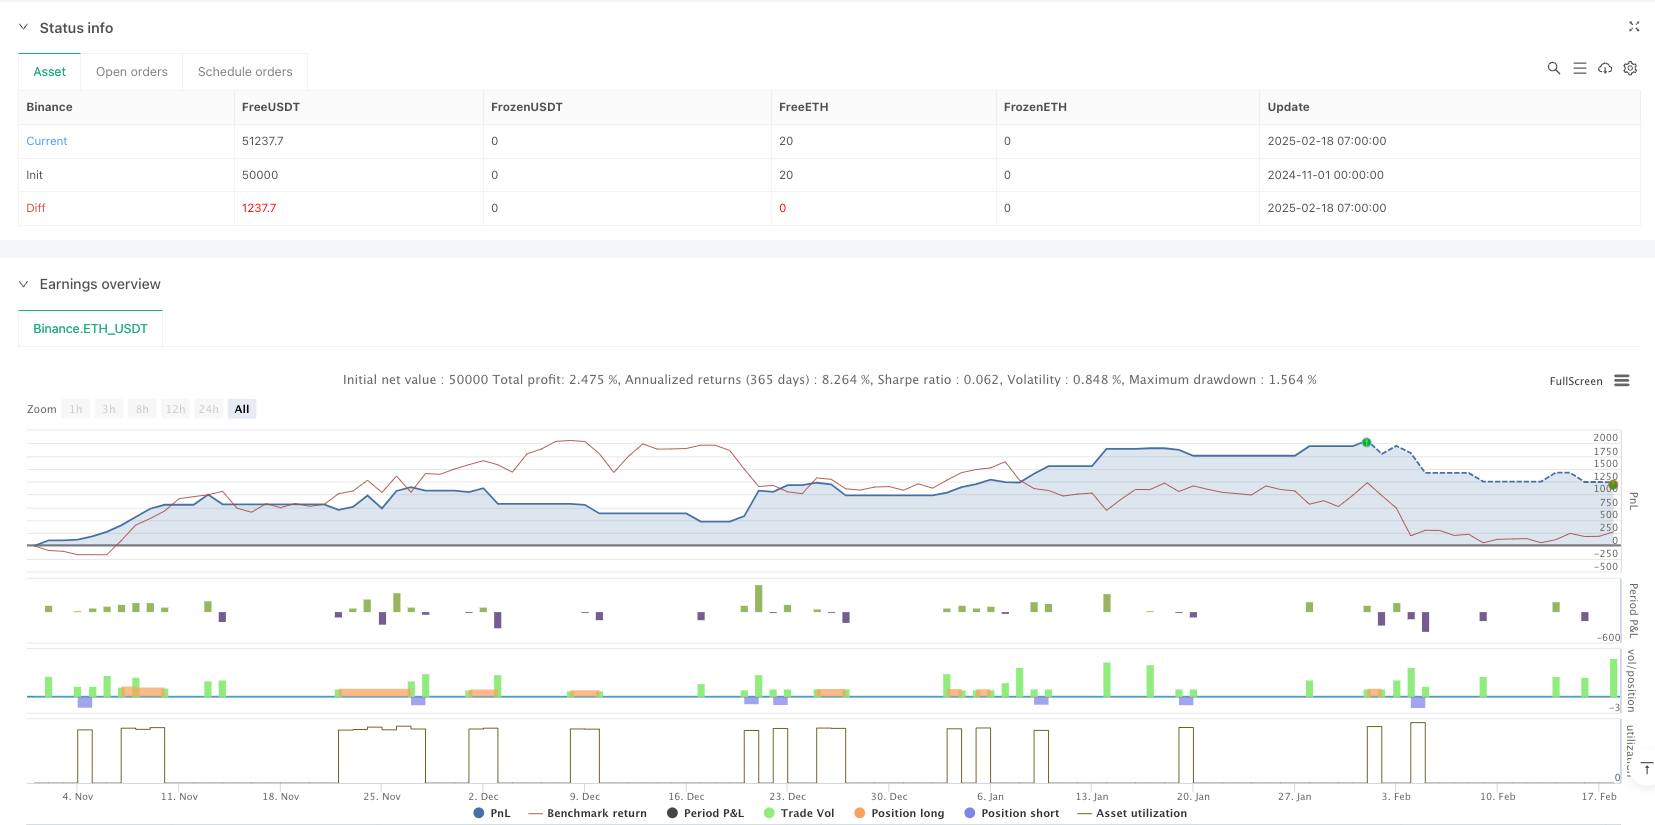
该策略是一个基于布林带标准差的趋势跟踪交易系统。策略通过观察连续三根蜡烛线相对于布林带上下轨的位置关系来判断趋势的强度,并在趋势确立时进行交易。系统采用了固定风险收益比的方式来管理每笔交易的风险。
策略原理
策略的核心逻辑基于以下几点:
- 使用20周期移动平均线作为布林带的中轨,并使用2倍标准差计算上下轨。
- 当连续三根蜡烛线的收盘价都位于上轨之上时,系统认为上升趋势已经确立,在第三根蜡烛线收盘时入场做多。
- 当连续三根蜡烛线的收盘价都位于下轨之下时,系统认为下降趋势已经确立,在第三根蜡烛线收盘时入场做空。
- 止损设置在入场信号最早的那根蜡烛线的极值处。
- 目标价位的设置采用1:1的风险收益比,即盈利目标距离等于止损距离。
策略优势
- 信号确认机制稳健 - 要求连续三根蜡烛线突破布林带,有效降低了假突破的风险。
- 风险管理合理 - 使用固定的风险收益比进行交易管理,避免了单笔交易的过度损失。
- 趋势跟踪效果显著 - 布林带的标准差特性使策略能够适应市场波动率的变化。
- 执行规则明确 - 入场、止损和获利目标的设置都有明确的量化标准,不需要主观判断。
策略风险
- 横盘市场表现欠佳 - 在无明显趋势的市场中可能产生频繁的假信号。
- 入场时机略滞后 - 需要等待三根蜡烛线确认才能入场,可能错过一些行情的早期阶段。
- 固定风险收益比的限制 - 1:1的风险收益比可能在强趋势中过早了结获利部位。
- 缺乏趋势强度过滤 - 仅依靠价格与布林带的关系判断,未考虑其他趋势确认指标。
策略优化方向
- 增加趋势强度过滤器 - 可以引入ADX或者MACD等趋势指标,提高信号质量。
- 优化风险收益比设置 - 可以根据市场波动率动态调整风险收益比。
- 完善止盈机制 - 考虑增加移动止损或者分批获利的机制,更好地把握大趋势。
- 加入成交量确认 - 在信号生成时增加成交量突破确认,提高信号可靠性。
总结
这是一个设计合理的趋势跟踪策略,通过布林带和多重确认机制来捕捉市场趋势。策略的风险管理框架完善,执行标准明确。虽然存在一定的滞后性,但通过建议的优化方向可以进一步提升策略的稳定性和盈利能力。对于偏好趋势跟踪、注重风险控制的交易者来说,这是一个值得参考的策略框架。 ||
Overview
This strategy is a trend following trading system based on Bollinger Band standard deviation. It determines trend strength by observing the relationship between three consecutive candles and the Bollinger Bands, executing trades when trends are confirmed. The system employs a fixed risk-reward ratio for managing trade risk.
Strategy Principle
The core logic is based on the following points:
- Uses a 20-period moving average as the middle band, with 2 standard deviations for upper and lower bands.
- When three consecutive candles close above the upper band, an uptrend is confirmed, entering long at the close of the third candle.
- When three consecutive candles close below the lower band, a downtrend is confirmed, entering short at the close of the third candle.
- Stop loss is set at the extreme value of the earliest candle in the entry signal.
- Target price is set with a 1:1 risk-reward ratio, meaning the profit target distance equals the stop loss distance.
Strategy Advantages
- Robust Signal Confirmation - Requires three consecutive candles breaking the Bollinger Bands, effectively reducing false breakout risks.
- Rational Risk Management - Uses fixed risk-reward ratio for trade management, preventing excessive losses in single trades.
- Effective Trend Following - Bollinger Band's standard deviation characteristics allow the strategy to adapt to market volatility changes.
- Clear Execution Rules - Entry, stop loss, and profit targets all have clear quantitative standards, requiring no subjective judgment.
Strategy Risks
- Poor Performance in Ranging Markets - May generate frequent false signals in markets without clear trends.
- Delayed Entry Timing - Waiting for three-candle confirmation may miss early stages of price movements.
- Fixed Risk-Reward Ratio Limitations - 1:1 risk-reward ratio may close profitable positions too early in strong trends.
- Lack of Trend Strength Filtering - Relies solely on price-band relationships without considering other trend confirmation indicators.
Strategy Optimization Directions
- Add Trend Strength Filter - Incorporate ADX or MACD for improved signal quality.
- Optimize Risk-Reward Ratio Setting - Dynamically adjust risk-reward ratio based on market volatility.
- Enhance Profit-Taking Mechanism - Consider adding trailing stops or partial profit-taking mechanisms for better trend capture.
- Include Volume Confirmation - Add volume breakout confirmation when generating signals to improve reliability.
Summary
This is a well-designed trend following strategy that captures market trends through Bollinger Bands and multiple confirmation mechanisms. The strategy features a comprehensive risk management framework with clear execution standards. While there is some inherent lag, the suggested optimization directions can further enhance strategy stability and profitability. For traders who prefer trend following and emphasize risk control, this provides a valuable strategic framework.[/trans]
Source (PineScript)
/*backtest
start: 2024-11-01 00:00:00
end: 2025-02-18 08:00:00
period: 1h
basePeriod: 1h
exchanges: [{"eid":"Binance","currency":"ETH_USDT"}]
*/

//@version=6
strategy("Bollinger Band Buy and Sell Strategy (Entry at Close of 3rd Candle)", overlay=true, default_qty_type=strategy.percent_of_equity, default_qty_value=10, pyramiding=0)

// Bollinger Band settings
length = input.int(20, "Bollinger Band Length")
mult = input.float(2.0, "Standard Deviation Multiplier")
basis = ta.sma(close, length)
dev = mult * ta.stdev(close, length)
upper_band = basis + dev
lower_band = basis - dev

// Plot Bollinger Bands
plot(upper_band, "Upper Band", color.blue)
plot(lower_band, "Lower Band", color.red)

// Initialize variables
var float buyEntryPrice = na
var float buyStopLoss = na
var float buyTargetPrice = na

var float sellEntryPrice = na
var float sellStopLoss = na
var float sellTargetPrice = na

// Buy Condition: Last 3 candles closed above upper band
buyCondition = close[2] > upper_band[2] and
               close[1] > upper_band[1] and
               close > upper_band

// Sell Condition: Last 3 candles closed below lower band
sellCondition = close[2] < lower_band[2] and   close[1] < lower_band[1] and   close < lower_band

// Buy Logic
if buyCondition and strategy.position_size == 0
    buyEntryPrice := close  // Entry at the close of the 3rd candle
    buyStopLoss := low[2]   // Low of the earliest candle in the 3-candle sequence
    buyTargetPrice := buyEntryPrice + (buyEntryPrice - buyStopLoss)

    strategy.entry("Buy", strategy.long)
    strategy.exit("Buy Exit", "Buy", stop=buyStopLoss, limit=buyTargetPrice)

    // Plot buy signal arrow on the entry candle
    label.new(bar_index, low, "▲", color=color.green, style=label.style_label_up, yloc=yloc.belowbar)

// Sell Logic
if sellCondition and strategy.position_size == 0
    sellEntryPrice := close  // Entry at the close of the 3rd candle
    sellStopLoss := high[2]  // High of the earliest candle in the 3-candle sequence
    sellTargetPrice := sellEntryPrice - (sellStopLoss - sellEntryPrice)

    strategy.entry("Sell", strategy.short)
    strategy.exit("Sell Exit", "Sell", stop=sellStopLoss, limit=sellTargetPrice)

    // Plot sell signal arrow on the entry candle
    label.new(bar_index, high, "▼", color=color.red, style=label.style_label_down, yloc=yloc.abovebar)

// Plot stop loss and target levels for buy trades
plot(strategy.position_size > 0 ? buyStopLoss : na, "Buy Stop Loss", color.red, 2, plot.style_linebr)
plot(strategy.position_size > 0 ? buyTargetPrice : na, "Buy Target", color.green, 2, plot.style_linebr)

// Plot stop loss and target levels for sell trades
plot(strategy.position_size < 0 ? sellStopLoss : na, "Sell Stop Loss", color.red, 2, plot.style_linebr)
plot(strategy.position_size < 0 ? sellTargetPrice : na, "Sell Target", color.green, 2, plot.style_linebr)
Detail
https://www.fmz.com/strategy/482878
Last Modified
2025-02-20 16:16:14