
13 KiB
Name
三段趋势突破与动量跟踪策略-Trinity-Bar-Based-Trend-Breakthrough-and-Momentum-Tracking-Strategy
Author
ChaoZhang
Strategy Description
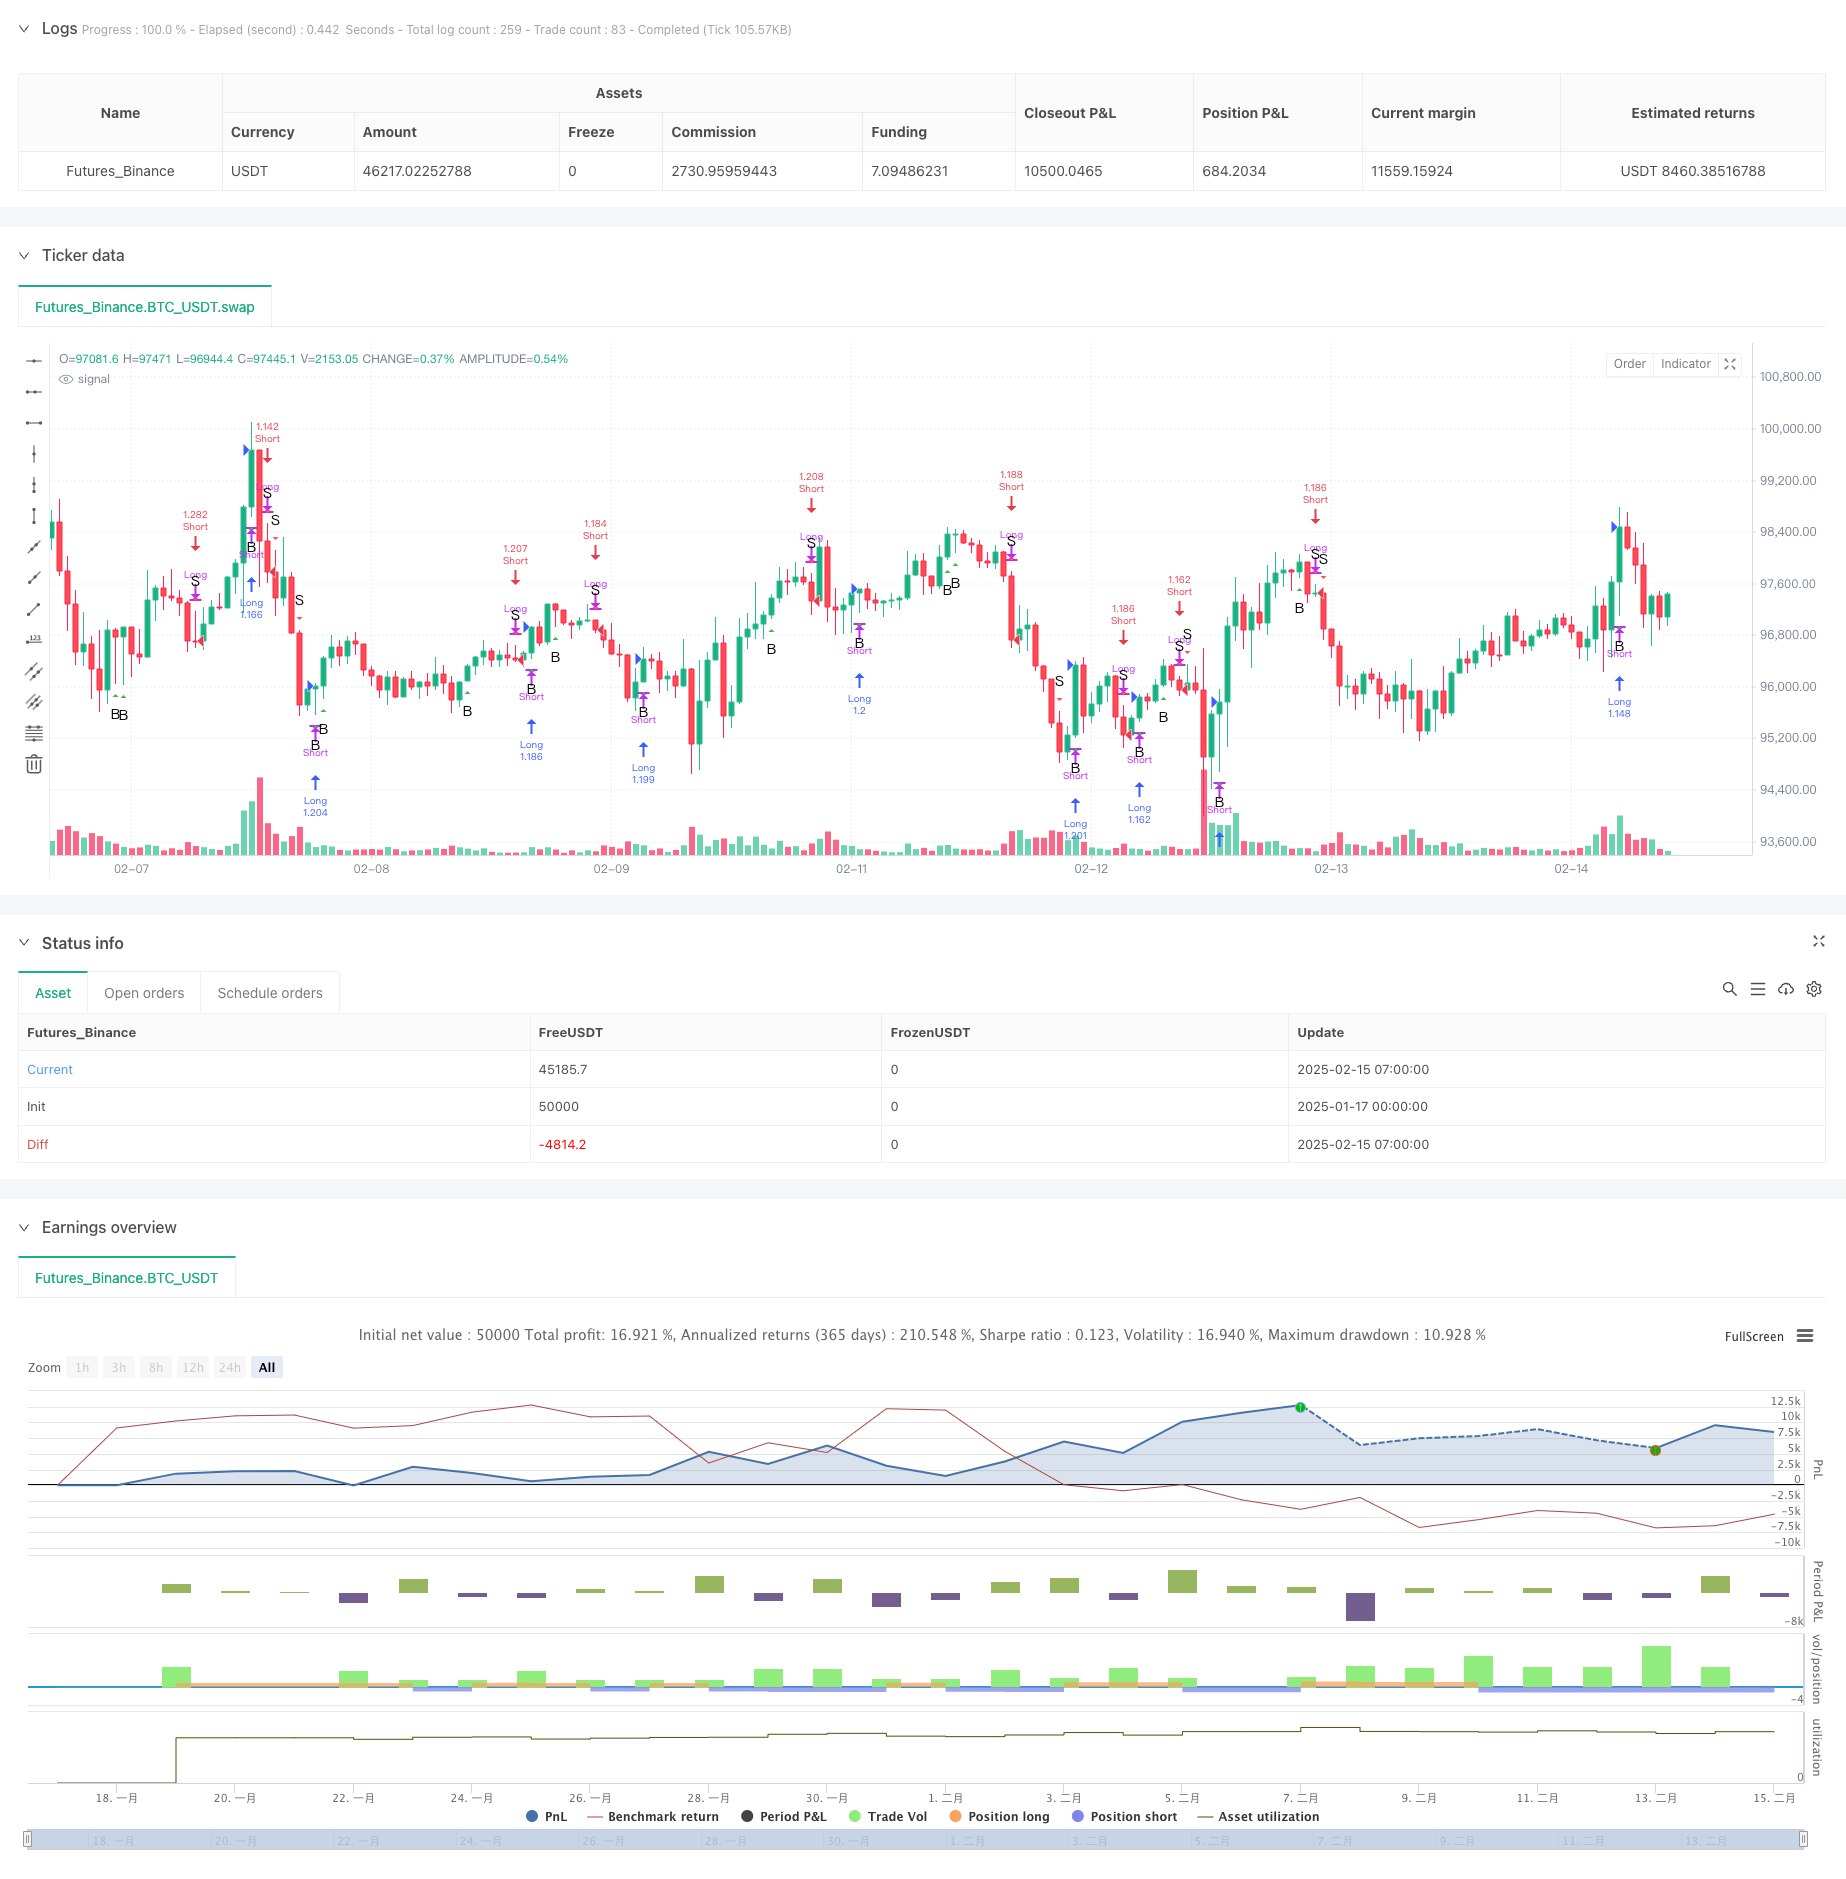 Based on the provided code, I'll help create an SEO-friendly article analyzing this trading strategy in both Chinese and English.
[trans]
概述
本策略基于价格行为分析(Price Action)和Bill Williams的K线三等分理论,通过对当前和前一根K线的开盘价、收盘价在K线三等分区间的位置关系进行分析,识别市场趋势的转折点和持续性,从而生成交易信号。该策略完全基于价格行为,不依赖任何技术指标,通过系统化的方法消除了交易过程中的情绪偏差。
策略原理
策略的核心逻辑是将每根K线的波动区间分为三等份,通过分析开盘价和收盘价在这些区间的位置来判断市场趋势。具体包括:
- K线分类 - 根据开收盘价位置将K线分为多种类型:
- 看多形态:1-3(下开上收)、2-3(中开上收)、3-3(上开上收)
- 看空形态:3-1(上开下收)、2-1(中开下收)、1-1(下开下收)
- 信号生成 - 通过连续两根K线的形态组合确认交易信号:
- 买入信号:前一根K线为任意看多形态,当前K线为1-3或3-3形态
- 卖出信号:前一根K线为任意看空形态,当前K线为1-1或3-1形态
- 交易执行 - 在确认信号后自动执行市价单:
- 出现买入信号时,平掉空仓并开多
- 出现卖出信号时,平掉多仓并开空
策略优势
- 纯价格驱动 - 完全基于价格行为分析,避免了技术指标的滞后性
- 系统化交易 - 通过明确的规则体系执行交易,降低主观判断带来的偏差
- 趋势跟踪 - 能够有效捕捉价格的大幅波动,提高单笔盈利空间
- 风险控制 - 通过对连续两根K线的分析提高信号可靠性
- 简单直观 - 策略逻辑清晰,易于理解和执行
策略风险
- 震荡市不适用 - 在区间震荡行情中可能产生频繁的假信号
- 入场时机滞后 - 需要等待K线收盘才能确认信号,可能错过最佳入场点
- 资金管理不足 - 策略本身不包含止损止盈机制,需要额外的风险控制措施
- 市场环境依赖 - 在流动性不足或高波动率环境下可能表现不佳
- 参数敏感性 - K线周期的选择对策略表现有重要影响
策略优化方向
- 引入波动率过滤 - 通过添加ATR等波动率指标,在不同市场环境下动态调整交易频率
- 完善风险控制 - 设计基于K线三等分的动态止损止盈机制
- 优化信号确认 - 考虑引入成交量、波动率等辅助指标提高信号可靠性
- 增加市场环境分析 - 开发市场状态识别模块,在不同市场环境下采用不同的交易参数
- 改进仓位管理 - 根据信号强度和市场环境动态调整持仓比例
总结
该策略通过将K线三等分的创新方法分析价格行为,建立了一个简单而有效的趋势跟踪系统。虽然存在一定的局限性,但通过合理的优化和风险控制措施,可以在趋势明显的市场环境下获得稳定的收益。策略的核心优势在于其系统化的方法论和对价格行为的深入分析,为量化交易提供了一个值得参考的研究方向。 ||
Overview
This strategy is based on Price Action analysis and Bill Williams' bar thirds theory. It analyzes the position relationships of opening and closing prices within the three equal sections of current and previous bars to identify market trend reversal points and continuity, generating trading signals. The strategy relies solely on price action without any technical indicators, eliminating emotional bias through a systematic approach.
Strategy Principle
The core logic divides each bar's range into three equal parts and analyzes the position of opening and closing prices within these sections to determine market trends. Specifically:
- Bar Classification - Categorizes bars based on open/close positions:
- Bullish Patterns: 1-3(low open high close), 2-3(mid open high close), 3-3(high open high close)
- Bearish Patterns: 3-1(high open low close), 2-1(mid open low close), 1-1(low open low close)
- Signal Generation - Confirms trading signals through two consecutive bars:
- Buy Signal: Previous bar shows any bullish pattern, current bar is 1-3 or 3-3
- Sell Signal: Previous bar shows any bearish pattern, current bar is 1-1 or 3-1
- Trade Execution - Automatically executes market orders:
- On buy signals, closes short positions and opens long
- On sell signals, closes long positions and opens short
Strategy Advantages
- Pure Price-Driven - Based entirely on price action, avoiding indicator lag
- Systematic Trading - Executes trades through clear rules, reducing subjective bias
- Trend Following - Effectively captures significant price movements
- Risk Control - Improves signal reliability through two-bar analysis
- Simple and Intuitive - Clear strategy logic, easy to understand and implement
Strategy Risks
- Unsuitable for Ranging Markets - May generate frequent false signals in sideways markets
- Delayed Entry - Requires bar closure for signal confirmation, potentially missing optimal entry points
- Insufficient Money Management - Strategy lacks built-in stop-loss/profit mechanisms
- Market Environment Dependency - May underperform in low liquidity or high volatility conditions
- Parameter Sensitivity - Bar timeframe selection significantly impacts strategy performance
Strategy Optimization Directions
- Volatility Filtering - Add ATR or similar indicators to dynamically adjust trading frequency
- Enhanced Risk Control - Design dynamic stop-loss/profit mechanisms based on bar thirds
- Improved Signal Confirmation - Consider volume and volatility as auxiliary indicators
- Market Environment Analysis - Develop market state recognition for parameter adaptation
- Position Management Improvement - Dynamically adjust position sizes based on signal strength
Summary
This strategy establishes an effective trend-following system through an innovative bar-thirds approach to price action analysis. While it has limitations, proper optimization and risk control measures can generate stable returns in trending markets. Its core strengths lie in the systematic methodology and deep price action analysis, providing a valuable reference direction for quantitative trading.[/trans]
Source (PineScript)
/*backtest
start: 2025-01-17 00:00:00
end: 2025-02-15 08:00:00
period: 1h
basePeriod: 1h
exchanges: [{"eid":"Futures_Binance","currency":"BTC_USDT"}]
*/

//@version=5
strategy("TrinityBar", overlay=true, initial_capital=100000,
     default_qty_type=strategy.percent_of_equity, default_qty_value=200)

//─────────────────────────────────────────────────────────────
// Current Bar Thirds Calculations
//─────────────────────────────────────────────────────────────
cur_range      = high - low
cur_lowerThird = low + cur_range / 3
cur_upperThird = high - cur_range / 3

//─────────────────────────────────────────────────────────────
// Previous Bar Thirds Calculations
//─────────────────────────────────────────────────────────────
prev_range      = high[1] - low[1]
prev_lowerThird = low[1] + prev_range / 3
prev_upperThird = high[1] - prev_range / 3

//─────────────────────────────────────────────────────────────
// Define Bullish Bar Types for Current Bar
//─────────────────────────────────────────────────────────────
is_1_3 = (open <= cur_lowerThird) and (close >= cur_upperThird)
is_3_3 = (open >= cur_upperThird) and (close >= cur_upperThird)
is_2_3 = (open > cur_lowerThird) and (open < cur_upperThird) and (close >= cur_upperThird)

//─────────────────────────────────────────────────────────────
// Define Bearish Bar Types for Current Bar
//─────────────────────────────────────────────────────────────
is_3_1 = (open >= cur_upperThird) and (close <= cur_lowerThird)
is_1_1 = (open <= cur_lowerThird) and (close <= cur_lowerThird)
is_2_1 = (open > cur_lowerThird) and (open < cur_upperThird) and (close <= cur_lowerThird)

//─────────────────────────────────────────────────────────────
// Define Bullish Bar Types for Previous Bar
//─────────────────────────────────────────────────────────────
prev_is_1_3 = (open[1] <= prev_lowerThird) and (close[1] >= prev_upperThird)
prev_is_3_3 = (open[1] >= prev_upperThird) and (close[1] >= prev_upperThird)
prev_is_2_3 = (open[1] > prev_lowerThird) and (open[1] < prev_upperThird) and (close[1] >= prev_upperThird)

//─────────────────────────────────────────────────────────────
// Define Bearish Bar Types for Previous Bar
//─────────────────────────────────────────────────────────────
prev_is_3_1 = (open[1] >= prev_upperThird) and (close[1] <= prev_lowerThird)
prev_is_1_1 = (open[1] <= prev_lowerThird) and (close[1] <= prev_lowerThird)
prev_is_2_1 = (open[1] > prev_lowerThird) and (open[1] < prev_upperThird) and (close[1] <= prev_lowerThird)

//─────────────────────────────────────────────────────────────
// Valid Signal Conditions
//─────────────────────────────────────────────────────────────
// Bullish Signal: If the previous bar is any bullish type (2‑3, 3‑3, or 1‑3)
// and the current bar is either a 1‑3 or a 3‑3 bar.
validBuy = (prev_is_2_3 or prev_is_3_3 or prev_is_1_3) and (is_1_3 or is_3_3)

// Bearish Signal: If the previous bar is any bearish type (2‑1, 1‑1, or 3‑1)
// and the current bar is either a 1‑1 or a 3‑1 bar.
validSell = (prev_is_2_1 or prev_is_1_1 or prev_is_3_1) and (is_1_1 or is_3_1)

//─────────────────────────────────────────────────────────────
// Plot Only the Signal Triangles
//─────────────────────────────────────────────────────────────
plotshape(validBuy, title="Valid Buy", style=shape.triangleup, location=location.belowbar,
     color=color.green, size=size.small, text="B")
plotshape(validSell, title="Valid Sell", style=shape.triangledown, location=location.abovebar,
     color=color.red, size=size.small, text="S")

//─────────────────────────────────────────────────────────────
// Market Order Execution Based on Signals
//─────────────────────────────────────────────────────────────
if validBuy
    // Close any short positions.
    strategy.close("Short", comment="")
    // If not already long, enter a market long.
    if strategy.position_size <= 0
        strategy.entry("Long", strategy.long, comment="")

if validSell
    // Close any long positions.
    strategy.close("Long", comment="")
    // If not already short, enter a market short.
    if strategy.position_size >= 0
        strategy.entry("Short", strategy.short, comment="")
Detail
https://www.fmz.com/strategy/482242
Last Modified
2025-02-17 10:53:49