
10 KiB
Name
三倍标准差布林带突破量化交易策略结合百日均线优化-Triple-Standard-Deviation-Bollinger-Bands-Breakout-Strategy-with-100-Day-Moving-Average-Optimization
Author
ChaoZhang
Strategy Description
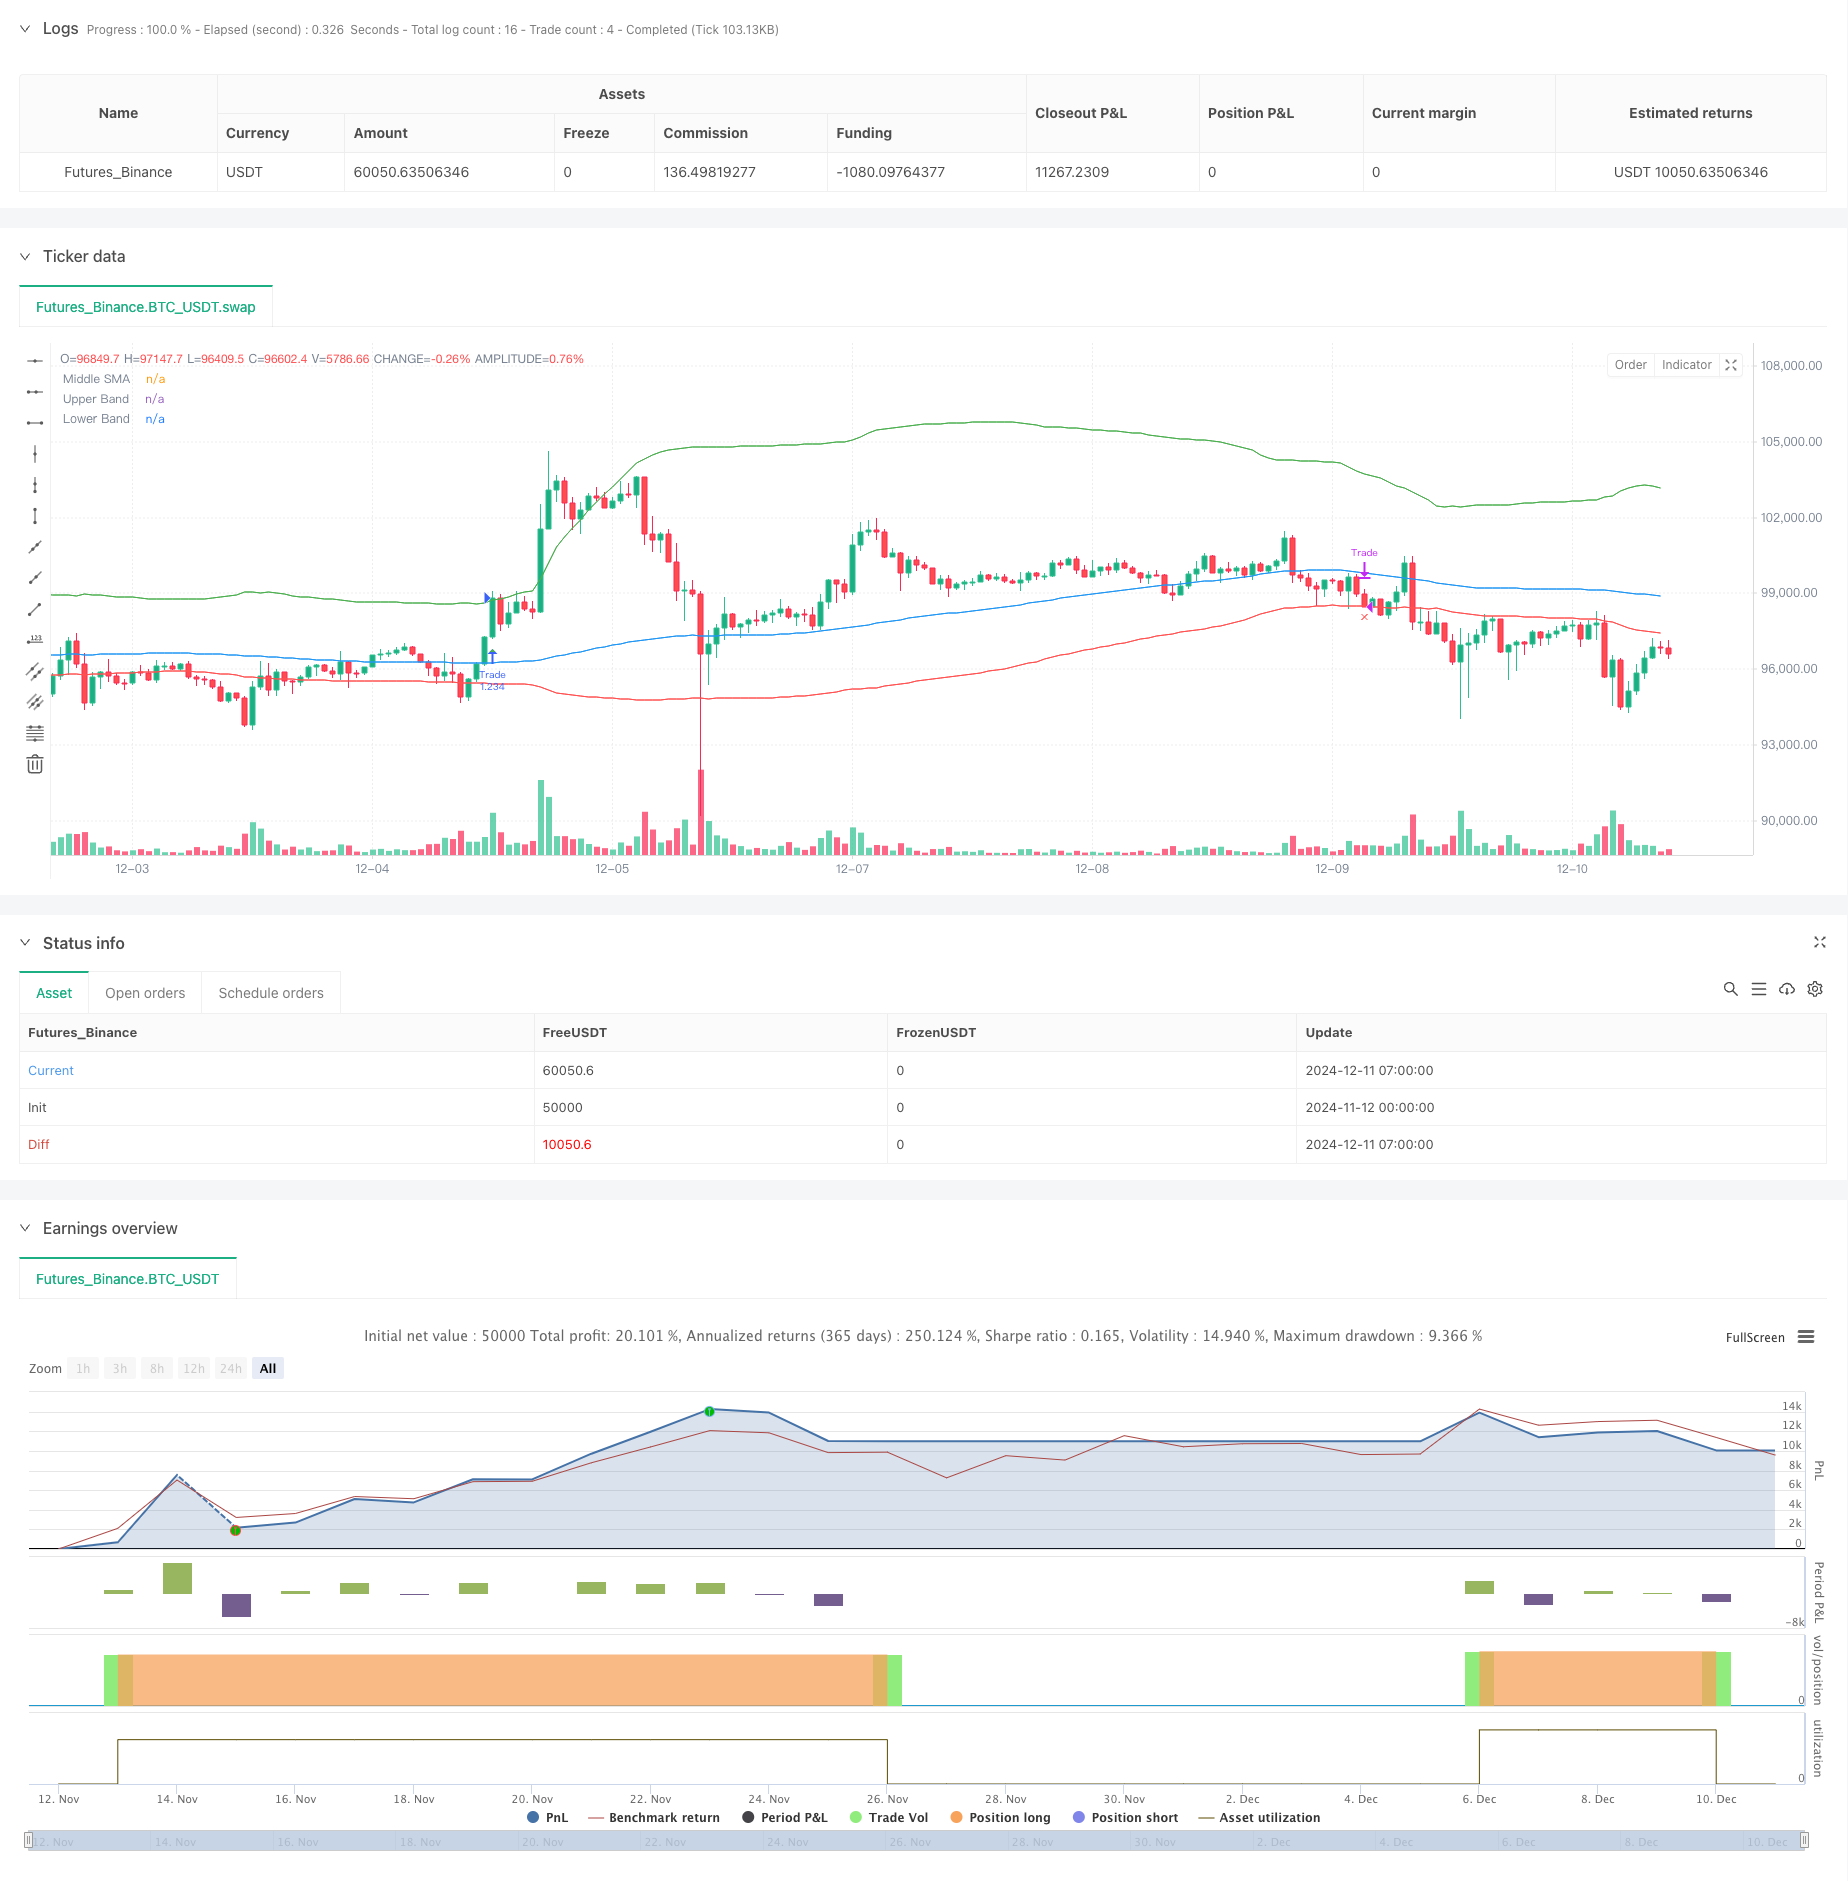
[trans]
概述
本策略是一个基于布林带突破的量化交易策略,采用了3倍标准差的上轨和1倍标准差的下轨,同时结合了100日移动平均线作为中轨。该策略主要通过检测价格突破上轨来捕捉长期趋势,并使用下轨作为止损信号。策略的核心思想是在强势突破时入场,在价格跌破下轨时及时止损,从而实现风险可控的趋势跟踪。
策略原理
策略的核心原理是基于布林带的统计学特性。上轨采用3倍标准差,这意味着在正态分布假设下,价格突破上轨的概率仅为0.15%,因此当出现突破时,往往预示着显著的趋势形成。中轨采用100日移动平均线,这个周期足够长,能够有效过滤短期市场噪音。下轨采用1倍标准差,作为止损线,这个设置相对保守,有助于及时止损。策略在价格突破上轨时发出做多信号,在价格跌破下轨时平仓出场。
策略优势
- 趋势把握能力强:通过3倍标准差的设置,能够有效捕捉重要的趋势突破机会。
- 风险控制合理:采用1倍标准差作为止损线,在风险控制上较为保守。
- 参数可调性强:上下轨的标准差倍数和移动平均线周期都可以根据不同市场特征进行调整。
- 系统性强:策略逻辑清晰,回测功能完善,可以准确统计交易表现。
- 适应性广:可以应用于股票市场和加密货币市场等多个领域。
策略风险
- 假突破风险:市场可能出现短期突破后的快速回落,导致虚假信号。
- 回撤较大:在剧烈波动的市场中可能出现较大回撤。
- 滞后性风险:100日均线具有一定滞后性,可能错过一些快速行情。
- 市场环境依赖:在震荡市场中可能频繁进出,产生过多交易成本。
策略优化方向
- 引入成交量确认:可以添加成交量突破确认机制,提高信号可靠性。
- 优化止损机制:可以考虑引入追踪止损或ATR动态止损,提高止损的灵活性。
- 增加趋势过滤:可以添加长期趋势判断指标,只在主趋势方向交易。
- 优化仓位管理:可以根据突破强度动态调整仓位大小。
- 添加时间过滤:可以避开一些特定的市场时段进行交易。
总结
这是一个设计合理、逻辑清晰的趋势跟踪策略。通过布林带的统计学特性和移动平均线的趋势跟踪特性,能够有效捕捉市场的重要突破机会。虽然存在一定的回撤风险,但通过合理的止损设置和风险控制,仍然具有较好的实用价值。进一步优化空间主要在于信号确认、止损机制和仓位管理等方面。 ||
Overview
This strategy is a quantitative trading system based on Bollinger Bands breakout, utilizing 3 standard deviations for the upper band and 1 standard deviation for the lower band, combined with a 100-day moving average as the middle band. The strategy primarily captures long-term trends by detecting price breakouts above the upper band and uses the lower band as a stop-loss signal. The core concept is to enter positions during strong breakouts and exit when prices fall below the lower band, achieving controlled risk trend following.
Strategy Principles
The core principle is based on the statistical properties of Bollinger Bands. The upper band uses 3 standard deviations, meaning under normal distribution assumptions, the probability of price breaking above this level is only 0.15%, suggesting significant trend formation when breakouts occur. The middle band uses a 100-day moving average, a period long enough to effectively filter short-term market noise. The lower band uses 1 standard deviation as a stop-loss line, a relatively conservative setting that helps with timely exit. The strategy generates long signals when price breaks above the upper band and exits when price falls below the lower band.
Strategy Advantages
- Strong trend capture capability: The 3 standard deviation setting effectively captures significant trend breakout opportunities.
- Reasonable risk control: Using 1 standard deviation as the stop-loss line provides conservative risk management.
- High parameter adaptability: The standard deviation multipliers and moving average period can be adjusted for different market characteristics.
- Systematic approach: Clear strategy logic with comprehensive backtesting capabilities for accurate performance tracking.
- Wide applicability: Can be applied to various markets including stocks and cryptocurrencies.
Strategy Risks
- False breakout risk: Markets may show short-term breakouts followed by quick reversals, leading to false signals.
- Significant drawdowns: Large drawdowns may occur in highly volatile markets.
- Lag risk: The 100-day moving average has inherent lag, potentially missing some rapid market moves.
- Market environment dependency: May generate excessive trades in ranging markets, leading to high transaction costs.
Strategy Optimization Directions
- Incorporate volume confirmation: Add volume breakout confirmation mechanism to improve signal reliability.
- Optimize stop-loss mechanism: Consider implementing trailing stops or ATR-based dynamic stops for more flexible exit management.
- Add trend filters: Incorporate long-term trend identification indicators to trade only in the primary trend direction.
- Improve position management: Dynamically adjust position sizes based on breakout strength.
- Add time filters: Avoid trading during specific market periods.
Summary
This is a well-designed trend following strategy with clear logic. Through the statistical properties of Bollinger Bands and the trend-following characteristics of moving averages, it effectively captures significant market breakout opportunities. While there are drawdown risks, the strategy maintains practical value through reasonable stop-loss settings and risk control. Further optimization potential lies in signal confirmation, stop-loss mechanisms, and position management aspects.[/trans]
Source (PineScript)
/*backtest
start: 2024-11-12 00:00:00
end: 2024-12-11 08:00:00
period: 1h
basePeriod: 1h
exchanges: [{"eid":"Futures_Binance","currency":"BTC_USDT"}]
*/

// This Pine Script™ code is subject to the terms of the Mozilla Public License 2.0 at https://mozilla.org/MPL/2.0/
// © MounirTrades007

// @version=6
strategy("Bollinger Bands", overlay=true, initial_capital=100000, default_qty_type=strategy.percent_of_equity, default_qty_value=200)

// Get user input
var g_bb        = "Bollinger Band Settings"
upperBandSD     = input.float(title="Upper Band Std Dev", defval=3.0, tooltip="Upper band's standard deviation multiplier", group=g_bb)
lowerBandSD     = input.float(title="Lower Band Std Dev", defval=1.0, tooltip="Lower band's standard deviation multiplier", group=g_bb)
maPeriod        = input.int(title="Middle Band MA Length", defval=100, tooltip="Middle band's SMA period length", group=g_bb)
var g_tester    = "Backtester Settings"
drawTester      = input.bool(title="Draw Backtester", defval=true, group=g_tester, tooltip="Turn on/off inbuilt backtester display")

// Get Bollinger Bands
[bbIgnore1, bbHigh, bbIgnore2] = ta.bb(close, maPeriod, upperBandSD)
[bbMid, bbIgnore3, bbLow]      = ta.bb(close, maPeriod, lowerBandSD)

// Prepare trade persistent variables
drawEntry   = false
drawExit    = false

// Detect bollinger breakout
if close > bbHigh and barstate.isconfirmed and strategy.position_size == 0
    drawEntry := true
    strategy.entry(id="Trade", direction=strategy.long)
    alert("Bollinger Breakout Detected for " + syminfo.ticker, alert.freq_once_per_bar_close)

// Detect bollinger sell signal
if close < bbLow and barstate.isconfirmed and strategy.position_size != 0
    drawExit := true
    strategy.close(id="Trade")
    alert("Bollinger Exit detected for " + syminfo.ticker, alert.freq_once_per_bar_close)

// Draw bollinger bands
plot(bbMid, color=color.blue, title="Middle SMA")
plot(bbHigh, color=color.green, title="Upper Band")
plot(bbLow, color=color.red, title="Lower Band")

// Draw signals
plotshape(drawEntry, style=shape.triangleup, color=color.green, location=location.belowbar, size=size.normal, title="Buy Signal")
plotshape(drawExit, style=shape.xcross, color=color.red, location=location.belowbar, size=size.normal, title="Sell Signal")

// // =============================================================================
// // START BACKTEST CODE
// // =============================================================================

// // Prepare stats table
// var table testTable = table.new(position.top_right, 2, 2, border_width=1)
// f_fillCell(_table, _column, _row, _title, _value, _bgcolor, _txtcolor) =>
//     _cellText = _title + "\n" + _value
//     table.cell(_table, _column, _row, _cellText, bgcolor=_bgcolor, text_color=_txtcolor)

// // Draw stats table
// var bgcolor = color.black
// if barstate.islastconfirmedhistory
//     if drawTester
//         dollarReturn = strategy.equity - strategy.initial_capital
//         f_fillCell(testTable, 0, 0, "Total Trades:", str.tostring(strategy.closedtrades), bgcolor, color.white)
//         f_fillCell(testTable, 0, 1, "Win Rate:", str.tostring(strategy.wintrades / strategy.closedtrades * 100, "##.##") + "%", bgcolor, color.white)
//         f_fillCell(testTable, 1, 0, "Equity:", "$" + str.tostring(strategy.equity, "###,###.##"), bgcolor, color.white)
//         f_fillCell(testTable, 1, 1, "Return:", str.tostring((strategy.netprofit / strategy.initial_capital) * 100, "##.##") + "%", dollarReturn > 0 ? color.green : color.red, color.white)

// // =============================================================================
// // END BACKTEST CODE
// // =============================================================================
Detail
https://www.fmz.com/strategy/474971
Last Modified
2024-12-13 11:20:13