
13 KiB
Name
一目均衡图趋势跟踪与支撑阻力策略-Ichimoku-Kinko-Hyo-Trend-Following-and-Support-Resistance-Strategy
Author
ChaoZhang
Strategy Description
[trans]
概述
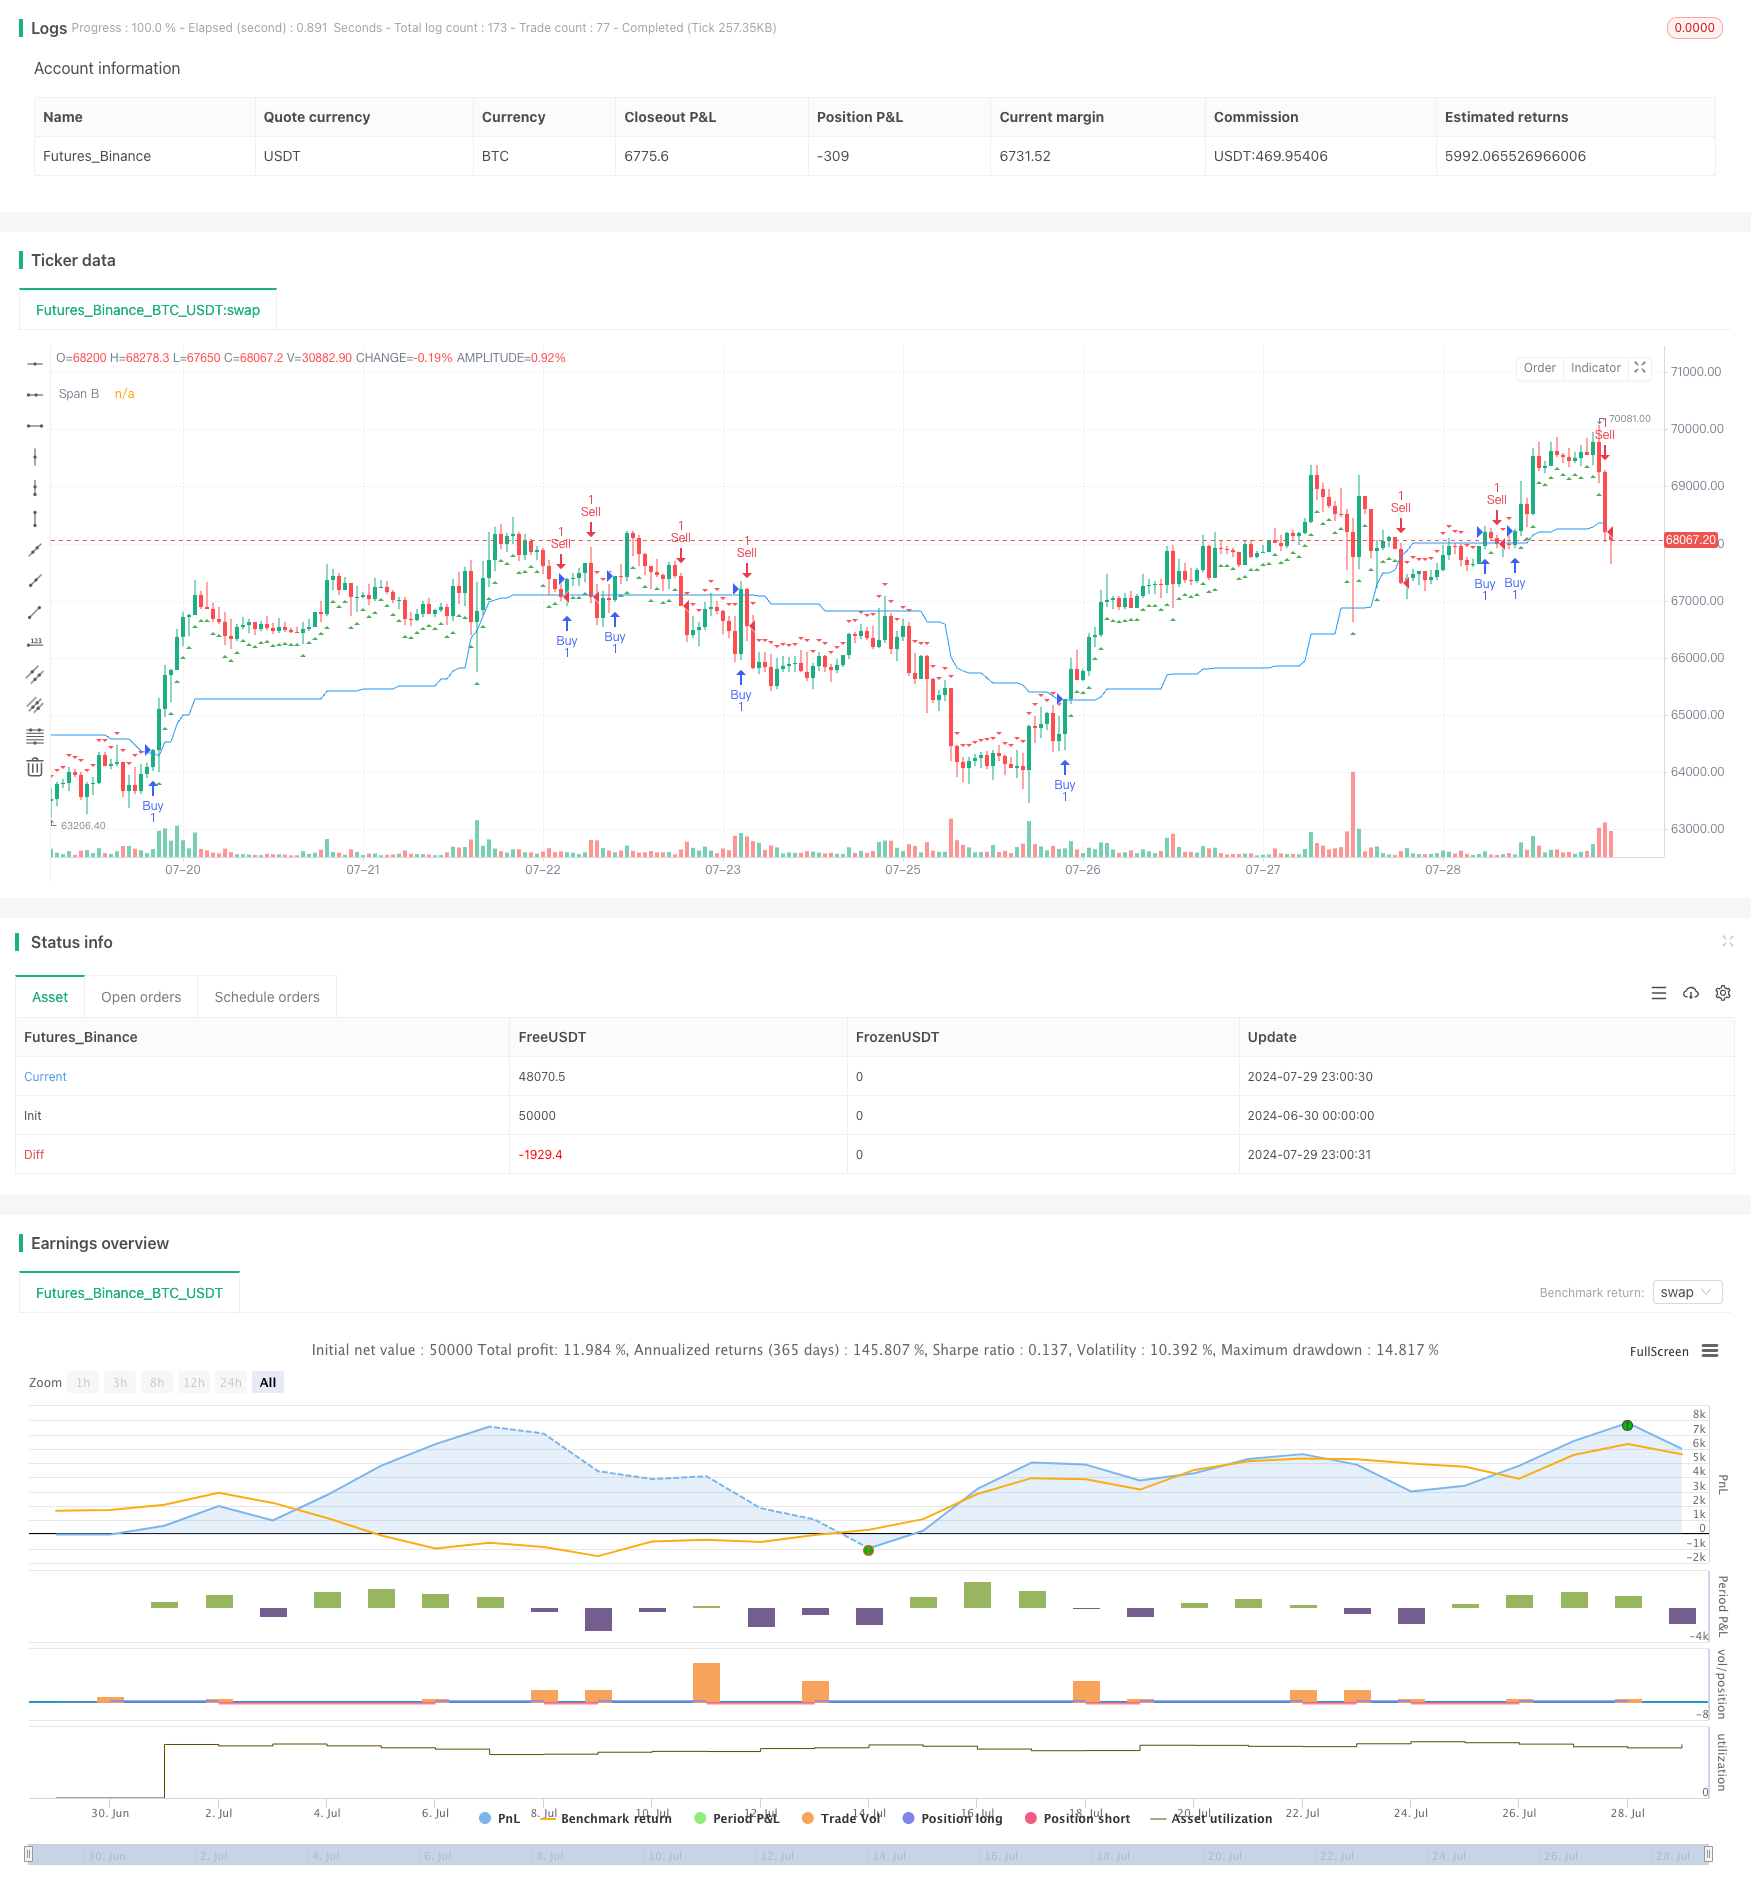
本策略基于一目均衡图(Ichimoku Kinko Hyo)技术指标,特别利用其中的Span B线来进行交易决策。策略的核心思想是当价格位于Span B线上方时买入,当价格跌破Span B线时卖出。这种方法充分利用了一目均衡图在识别市场趋势和支撑/阻力水平方面的优势。
策略采用了52周期作为Span B线的计算基础,这一设置旨在捕捉中长期的市场equilibrium。通过观察价格与Span B线的相对位置,交易者可以判断当前市场是否处于上升趋势或下降趋势,从而做出相应的交易决策。
策略原理
策略的核心逻辑如下:
-
Span B线计算:使用52个周期内的最高价和最低价的平均值来计算Span B线。这一设置旨在反映较长期的市场平衡状态。
-
买入信号:当收盘价突破Span B线上方时,生成买入信号。这表明市场可能正在进入上升趋势。
-
卖出信号:当收盘价跌破Span B线下方时,生成卖出信号。这可能预示着下降趋势的开始。
-
交易执行:策略在检测到买入信号时开仓做多,在检测到卖出信号时开仓做空。
-
可视化:策略在图表上绘制了Span B线,并用绿色三角形标记买入信号,红色三角形标记卖出信号,以便交易者直观地判断市场状况和交易时机。
策略优势
-
趋势跟踪:该策略本质上是一种趋势跟踪策略,有助于捕捉主要的市场走势。通过跟随价格相对于Span B线的位置变化,交易者可以在趋势初期进场,并在趋势反转时及时出场。
-
简洁性:相比完整的一目均衡图系统,本策略仅关注Span B线,大大简化了决策过程,使得策略更容易理解和实施。这种简化不仅降低了策略的复杂度,也减少了过度拟合的风险。
-
灵活性:策略的参数(如Span B的计算周期)可以根据不同的市场和时间框架进行调整。这种灵活性使得策略可以适应各种交易品种和市场环境。
-
客观性:基于明确的数学计算和规则,策略消除了主观判断的影响,有助于保持交易的一致性和纪律性。
-
支撑与阻力识别:Span B线不仅用于生成交易信号,还可以作为动态的支撑和阻力水平。这为交易者提供了额外的市场结构洞察。
策略风险
-
假突破:在横盘市场中,价格可能频繁穿越Span B线,导致过多的虚假信号。这可能引发频繁交易,增加交易成本并降低策略的整体表现。
-
滞后性:由于Span B线基于52个周期的回溯计算,它可能在快速变化的市场中反应较慢。这种滞后性可能导致错过重要的入场或出场时机。
-
确认不足:仅依赖Span B线可能不够全面。缺乏其他技术指标或基本面分析的确认,可能增加误判的风险。
-
市场条件敏感性:策略在强趋势市场中表现较好,但在震荡市场或突发事件影响下可能表现不佳。
-
过度依赖单一指标:仅使用Span B线作为决策依据,可能忽视其他重要的市场信息,增加策略的脆弱性。
策略优化方向
-
信号过滤:引入额外的条件来过滤交易信号,例如结合成交量确认或其他技术指标。这可以通过添加如RSI或MACD等指标来实现,以提高信号的可靠性。
-
动态参数调整:实现Span B计算周期的动态调整,以适应不同的市场波动状况。可以考虑使用自适应算法,根据市场波动率自动调整参数。
-
多时间框架分析:结合更长和更短的时间框架,以获得更全面的市场视角。例如,可以在日线上使用该策略,同时参考周线趋势作为额外的过滤条件。
-
止损和止盈优化:引入动态的止损和止盈机制,例如基于ATR(Average True Range)的止损设置,或者使用移动止损来保护利润。
-
市场状态分类:开发一个市场状态分类系统,在不同的市场环境(如趋势市场、震荡市场)中采用不同的交易规则。
-
机器学习整合:利用机器学习算法优化参数选择和信号生成过程,提高策略的自适应能力和性能。
总结
基于一目均衡图Span B线的趋势跟踪与支撑阻力策略为交易者提供了一种简单而有效的方法来捕捉市场趋势并识别关键的支撑和阻力水平。通过观察价格与Span B线的相对位置,交易者可以做出明确的买入和卖出决策。
策略的优势在于其简洁性、客观性和对趋势的敏感性,这使得它特别适合初学者和寻求简化交易系统的经验丰富的交易者。然而,像所有交易策略一样,它也面临着假突破、滞后性和过度依赖单一指标等风险。
为了提高策略的稳健性和适应性,建议交易者考虑引入额外的过滤条件、优化参数设置、结合多时间框架分析,以及实现动态的风险管理机制。通过这些优化,策略可以更好地适应不同的市场环境,提高盈利能力并降低风险。
最终,成功应用这一策略需要交易者深入理解一目均衡图的原理,持续监测和评估策略表现,并根据市场变化灵活调整。通过不断学习和优化,交易者可以将这一简单而强大的工具转化为可靠的交易系统。
||
Overview
This strategy is based on the Ichimoku Kinko Hyo technical indicator, specifically utilizing its Span B line for trading decisions. The core idea is to buy when the price is above the Span B line and sell when it falls below. This approach leverages the Ichimoku's strengths in identifying market trends and support/resistance levels.
The strategy uses a 52-period calculation for the Span B line, aiming to capture medium to long-term market equilibrium. By observing the price's position relative to the Span B line, traders can determine whether the market is in an uptrend or downtrend and make trading decisions accordingly.
Strategy Principles
The core logic of the strategy is as follows:
-
Span B Calculation: The Span B line is calculated using the average of the highest high and lowest low over the past 52 periods. This setting is designed to reflect longer-term market equilibrium.
-
Buy Signal: A buy signal is generated when the closing price crosses above the Span B line. This suggests that the market may be entering an uptrend.
-
Sell Signal: A sell signal is generated when the closing price crosses below the Span B line. This may indicate the beginning of a downtrend.
-
Trade Execution: The strategy opens a long position when a buy signal is detected and a short position when a sell signal is detected.
-
Visualization: The strategy plots the Span B line on the chart and marks buy signals with green triangles and sell signals with red triangles, allowing traders to visually assess market conditions and trading opportunities.
Strategy Advantages
-
Trend Following: This strategy is inherently trend-following, helping to capture major market moves. By following the price's position relative to the Span B line, traders can enter trends early and exit when trends reverse.
-
Simplicity: Compared to the full Ichimoku system, this strategy focuses only on the Span B line, greatly simplifying the decision-making process. This simplification not only reduces strategy complexity but also minimizes the risk of overfitting.
-
Flexibility: The strategy's parameters (such as the calculation period for Span B) can be adjusted for different markets and timeframes. This flexibility allows the strategy to adapt to various trading instruments and market environments.
-
Objectivity: Based on clear mathematical calculations and rules, the strategy eliminates the impact of subjective judgment, helping to maintain consistency and discipline in trading.
-
Support and Resistance Identification: The Span B line serves not only to generate trading signals but also as a dynamic support and resistance level. This provides traders with additional insights into market structure.
Strategy Risks
-
False Breakouts: In ranging markets, price may frequently cross the Span B line, leading to excessive false signals. This can result in frequent trading, increasing transaction costs and reducing overall strategy performance.
-
Lag: As the Span B line is calculated based on a 52-period lookback, it may be slow to react in rapidly changing markets. This lag can cause missed entry or exit opportunities.
-
Lack of Confirmation: Relying solely on the Span B line may not be comprehensive enough. The absence of confirmation from other technical indicators or fundamental analysis may increase the risk of misjudgment.
-
Market Condition Sensitivity: The strategy may perform well in strong trend markets but could struggle in choppy markets or during sudden event-driven price moves.
-
Over-reliance on a Single Indicator: Using only the Span B line for decision-making may ignore other important market information, increasing the strategy's vulnerability.
Strategy Optimization Directions
-
Signal Filtering: Introduce additional conditions to filter trading signals, such as volume confirmation or other technical indicators. This can be achieved by adding indicators like RSI or MACD to improve signal reliability.
-
Dynamic Parameter Adjustment: Implement dynamic adjustment of the Span B calculation period to adapt to different market volatility conditions. Consider using adaptive algorithms to automatically adjust parameters based on market volatility.
-
Multi-Timeframe Analysis: Incorporate longer and shorter timeframes to gain a more comprehensive market perspective. For example, use the strategy on daily charts while referencing weekly trends as an additional filter.
-
Stop Loss and Take Profit Optimization: Introduce dynamic stop loss and take profit mechanisms, such as ATR (Average True Range) based stop losses or trailing stops to protect profits.
-
Market State Classification: Develop a market state classification system to apply different trading rules in various market environments (e.g., trending markets, ranging markets).
-
Machine Learning Integration: Utilize machine learning algorithms to optimize parameter selection and signal generation processes, enhancing the strategy's adaptability and performance.
Conclusion
The Ichimoku Kinko Hyo Trend Following and Support Resistance Strategy based on the Span B line offers traders a simple yet effective method to capture market trends and identify key support and resistance levels. By observing the price's position relative to the Span B line, traders can make clear buy and sell decisions.
The strategy's strengths lie in its simplicity, objectivity, and sensitivity to trends, making it particularly suitable for beginners and experienced traders seeking to simplify their trading systems. However, like all trading strategies, it faces risks such as false breakouts, lag, and over-reliance on a single indicator.
To enhance the strategy's robustness and adaptability, traders are advised to consider introducing additional filtering conditions, optimizing parameter settings, incorporating multi-timeframe analysis, and implementing dynamic risk management mechanisms. Through these optimizations, the strategy can better adapt to different market environments, improve profitability, and reduce risk.
Ultimately, successful application of this strategy requires traders to deeply understand the principles of Ichimoku Kinko Hyo, continuously monitor and evaluate strategy performance, and flexibly adjust according to market changes. Through ongoing learning and optimization, traders can transform this simple yet powerful tool into a reliable trading system.
[/trans]
Source (PineScript)
/*backtest
start: 2024-06-30 00:00:00
end: 2024-07-30 00:00:00
period: 1h
basePeriod: 15m
exchanges: [{"eid":"Futures_Binance","currency":"BTC_USDT"}]
*/

//@version=5
strategy("Ichimoku-based Strategy", overlay=true)

// Ichimoku 参数
conversionPeriods = input(9, "Conversion Line Periods")
basePeriods = input(26, "Base Line Periods")
laggingSpan2Periods = input(52, "Lagging Span 2 Periods")
displacement = input(26, "Displacement")

// 计算一目均衡表的组件
donchian(len) => math.avg(ta.lowest(len), ta.highest(len))
conversionLine = donchian(conversionPeriods)
baseLine = donchian(basePeriods)
leadLine1 = math.avg(conversionLine, baseLine)
leadLine2 = donchian(laggingSpan2Periods)

// 获取当前收盘价
currentClose = close

// 生成买卖信号
buySignal = currentClose > leadLine2
sellSignal = currentClose < leadLine2

// 执行交易
if (buySignal)
    strategy.entry("Buy", strategy.long)
if (sellSignal)
    strategy.entry("Sell", strategy.short)

// 绘制买卖信号
plotshape(buySignal, title="Buy Signal", location=location.belowbar, color=color.green, style=shape.triangleup, size=size.small)
plotshape(sellSignal, title="Sell Signal", location=location.abovebar, color=color.red, style=shape.triangledown, size=size.small)

// 显示一目均衡表的主要线条
plot(leadLine2, color=color.blue, title="Span B")
Detail
https://www.fmz.com/strategy/458269
Last Modified
2024-07-31 14:25:48