
9.3 KiB
Name
一云穿月双星吸金策略Ichimoku-Kumo-Twist-Gold-Absorbing-Strategy
Author
ChaoZhang
Strategy Description
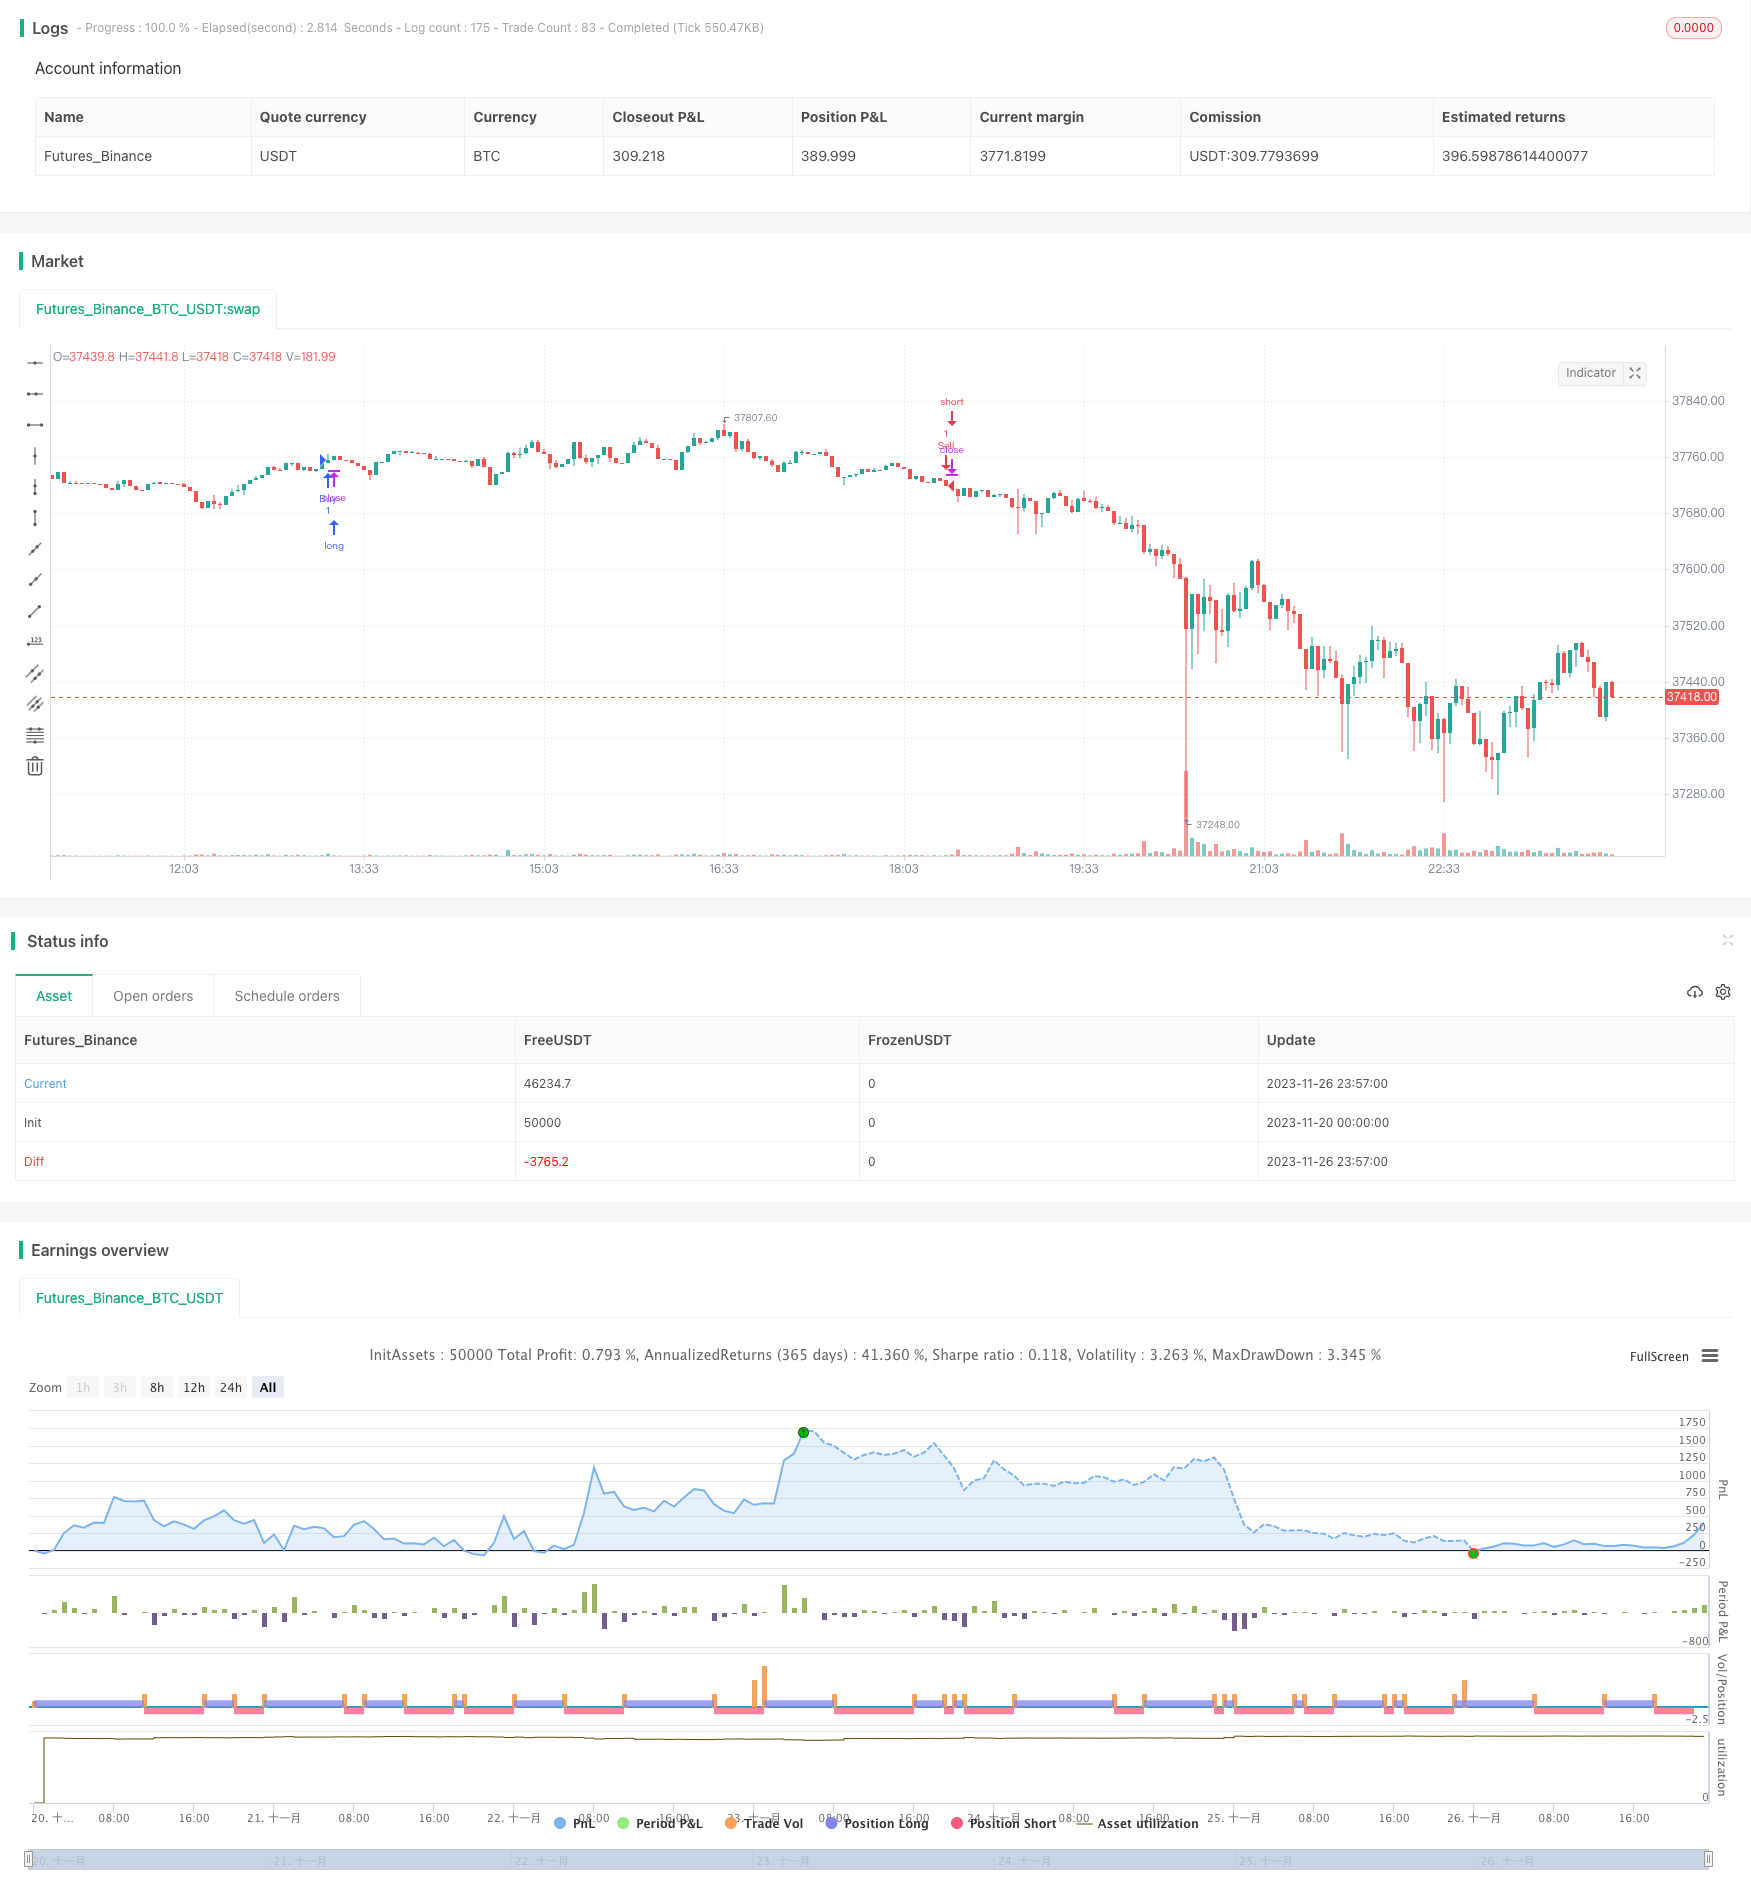 [trans]
概述
一云穿月双星吸金策略是一种结合市场技术分析指标一云和范围过滤的量化交易策略。该策略利用一云指标判断市场趋势和重要支持、阻力位,以及K线形态来产生交易信号。同时,结合范围过滤来控制交易频率和风险。
策略原理
该策略主要基于一云指标和K线形态来判断市场走势。一云指标包含前转线、基准线和云线,它们的交叉关系可以判断市场趋势;同时云线可作为支持和阻力位。该策略通过设置不同参数组合来调整一云线的灵敏度。另外,策略里通过形态识别,在前转线上穿基准线时产生买入信号,下穿时产生卖出信号。
此外,策略还设置了日期范围过滤,只有在指定的日期范围内才会进行交易,这可以控制策略的交易频率。同时,止损设置也可以降低风险,当价格向不利方向运行时 stoploss 选项将停止损失。
优势分析
- 利用一云指标判断市场走势,指标参数可调整灵敏度
- K线形态识别,交易信号明确
- 设置日期范围过滤,可控制交易频率
- 止损设置,可以及时止损,降低风险
风险分析
- 一云指标存在滞后,可能错过快速变化的趋势
- 日期范围过滤可能错过部分交易机会
- 止损设置不当可能扩大损失
可以通过调整一云指标参数、优化日期范围、修正止损点等方法来改善和控制风险。
优化方向
- 可以测试不同的参数组合,选择最佳一云指标配置
- 可以结合其他指标判断,避免一云指标滞后的问题
- 可以通过回测优化日期范围设置
- 可以设置条件式动态滑点止损
总结
一云穿月双星吸金策略综合运用一云指标、K线识别、范围过滤等方法判断市场走势,可以较清晰地把握趋势方向。通过参数调整、风险控制等手段,可以获得较好的策略效果。但仍需注意一云指标滞后问题,并进行持续的优化调整。
||
Overview
The Ichimoku Kumo Twist Gold-Absorbing Strategy is a quantitative trading strategy that combines the Ichimoku market technical indicator and range filtering. It utilizes the Ichimoku indicator to determine market trends and important support and resistance levels, together with candlestick patterns to generate trading signals. Meanwhile, range filtering helps to control the trading frequency and risk.
Strategy Principle
The strategy is primarily based on the Ichimoku indicator and candlestick patterns to judge market trends. The Ichimoku contains the conversion line, base line and cloud lines, their crossover relationships indicate market trends. The cloud lines also act as support and resistance levels. The strategy sets up different parameter combinations to adjust the sensitivity of the Ichimoku lines. In addition, the strategy identifies patterns and generates buy signals when the conversion line crosses above the base line, and sell signals when crossing below.
Furthermore, the strategy has date range filters set up, so that it only trades within specified date ranges. This controls the trading frequency. Also, the stop loss setting helps to reduce risk by stopping the loss when price runs in an unfavorable direction.
Advantage Analysis
- Utilize Ichimoku indicator to judge market trends, parameters adjustable for sensitivity
- Clear trading signals from candlestick pattern recognition
- Date range filter controls trading frequency
- Stop loss setting for timely stop loss to reduce risk
Risk Analysis
- Ichimoku lagging may miss fast changing trends
- Date range filter may miss some trading chances
- Improper stop loss setting may expand losses
Methods like adjusting Ichimoku parameters, optimizing date range, amending stop loss points can improve and control risks.
Optimization Directions
- Test different parameter combinations to find optimal Ichimoku configuration
- Combine with other indicators to avoid Ichimoku lagging issues
- Backtest to optimize date range settings
- Set conditional dynamic trailing stop loss
Summary
The Ichimoku Kumo Twist Gold-Absorbing Strategy integrates the Ichimoku indicator, candlestick pattern recognition, range filtering to determine market trends. It can grasp trend directions quite clearly. Through means like parameter tuning, risk control etc, good strategy performance can be achieved. But the Ichimoku lagging problem should be noted, and continuous optimization adjustments made.
[/trans]
Strategy Arguments
| Argument | Default | Description |
|---|---|---|
| v_input_1 | 0 | Scaling: Linear |
| v_input_2 | 0 | Presets: Cpt 20 60 120 30 |
| v_input_3 | true | Drop first N candles |
| v_input_4 | false | Show Clouds |
| v_input_5 | true | Stop Loss |
| v_input_6 | 10 | From Month |
| v_input_7 | 3 | From Day |
| v_input_8 | 2017 | From Year |
| v_input_9 | true | To Month |
| v_input_10 | true | To Day |
| v_input_11 | 9999 | To Year |
Source (PineScript)
/*backtest
start: 2023-11-20 00:00:00
end: 2023-11-27 00:00:00
period: 3m
basePeriod: 1m
exchanges: [{"eid":"Futures_Binance","currency":"BTC_USDT"}]
*/

//@version=3
strategy(title="Ichimoku Kumo Twist Strategy (Presets)", shorttitle="Kumo Twist Strategy", overlay=true)

xlowest_(src, len) =>
    x = src
    for i = 1 to len - 1
        v = src[i]
        if (na(v))
            break
        x := min(x, v)
    x

xlowest(src, len) =>
    na(src[len]) ? xlowest_(src, len) : lowest(src, len)

xhighest_(src, len) =>
    x = src
    for i = 1 to len - 1
        v = src[i]
        if (na(v))
            break
        x := max(x, v)
    x

xhighest(src, len) =>
    na(src[len]) ? xhighest_(src, len) : highest(src, len)

dropn(src, n) =>
    na(src[n]) ? na : src

ichiConversionPeriods(presets) =>
    if presets == "Cpt 20 60 120 30"
        20
    else
        if presets == "Cpt 10 30 60 30"
            10
        else
            if presets == "Std 18 52 104 26"
                18
            else
                9

ichiBasePeriods(presets) =>
    if presets == "Cpt 20 60 120 30"
        60
    else
        if presets == "Cpt 10 30 60 30"
            30
        else
            if presets == "Std 18 52 104 26"
                52
            else
                26

ichiLaggingSpan2Periods(presets) =>
    if presets == "Cpt 20 60 120 30"
        120
    else
        if presets == "Cpt 10 30 60 30"
            60
        else
            if presets == "Std 18 52 104 26"
                104
            else
                52

ichiDisplacement(presets) =>
    if presets == "Cpt 20 60 120 30"
        30
    else
        if presets == "Cpt 10 30 60 30"
            30
        else
            if presets == "Std 18 52 104 26"
                26
            else
                26

scaling = input(title="Scaling", options=["Linear", "Log"], defval="Linear")
presets = input(title="Presets", options=["Cpt 20 60 120 30", "Cpt 10 30 60 30", "Std 18 52 104 26", "Std 9 26 52 26"], defval="Cpt 20 60 120 30")
dropCandles = input(1, minval=0, title="Drop first N candles")
showClouds = input(false, "Show Clouds")
stoploss = input(true, title="Stop Loss")

conversionPeriods = ichiConversionPeriods(presets)
basePeriods = ichiBasePeriods(presets)
laggingSpan2Periods = ichiLaggingSpan2Periods(presets)
displacement = ichiDisplacement(presets)
logScaling = scaling == "Log"

lows = dropn(low, dropCandles)
highs = dropn(high, dropCandles)

lowsp = logScaling ? log(lows) : lows
highsp = logScaling ? log(highs) : highs

donchian(len) =>
    avg(xlowest(lowsp, len), xhighest(highsp, len))

conversionLine = donchian(conversionPeriods)
baseLine = donchian(basePeriods)
leadLine1 = avg(conversionLine, baseLine)
leadLine2 = donchian(laggingSpan2Periods)

// === BACKTEST RANGE ===
FromMonth = input(defval = 10, title = "From Month", minval = 1)
FromDay   = input(defval = 3, title = "From Day", minval = 1)
FromYear  = input(defval = 2017, title = "From Year", minval = 2014)
ToMonth   = input(defval = 1, title = "To Month", minval = 1)
ToDay     = input(defval = 1, title = "To Day", minval = 1)
ToYear    = input(defval = 9999, title = "To Year", minval = 2014)

golong = crossover(leadLine1, leadLine2)
goshort = crossunder(leadLine1, leadLine2)

strategy.entry("Buy", strategy.long, when=(golong and (time > timestamp(FromYear, FromMonth, FromDay, 00, 00)) and (time < timestamp(ToYear, ToMonth, ToDay, 23, 59))))
strategy.entry("Sell", strategy.short, when=(goshort and (time > timestamp(FromYear, FromMonth, FromDay, 00, 00)) and (time < timestamp(ToYear, ToMonth, ToDay, 23, 59))))

conversionLinep = logScaling ? exp(conversionLine) : conversionLine
baseLinep = logScaling ? exp(baseLine) : baseLine
leadLine1p = logScaling ? exp(leadLine1) : leadLine1
leadLine2p = logScaling ? exp(leadLine2) : leadLine2

plot(showClouds ? conversionLinep : na, color=#0496ff, title="Conversion Line")
plot(showClouds ? baseLinep : na, color=#991515, title="Base Line")

p1 = plot(showClouds ? leadLine1p : na, offset = displacement, color=green, title="Lead 1")
p2 = plot(showClouds ? leadLine2p : na, offset = displacement, color=red, title="Lead 2")
fill(p1, p2, color = showClouds ? (leadLine1p > leadLine2p ? green : red) : na)
Detail
https://www.fmz.com/strategy/433574
Last Modified
2023-11-28 16:12:09