228 lines
8.8 KiB
Markdown
228 lines
8.8 KiB
Markdown

|
|
||
|
|
> Name
|
||
|
|
|
||
|
|
突破交易策略Breakout-Trading-Strategy
|
||
|
|
|
||
|
|
> Author
|
||
|
|
|
||
|
|
ChaoZhang
|
||
|
|
|
||
|
|
> Strategy Description
|
||
|
|
|
||
|
|
|
||
|
|
[trans]
|
||
|
|
|
||
|
|
## 概述
|
||
|
|
|
||
|
|
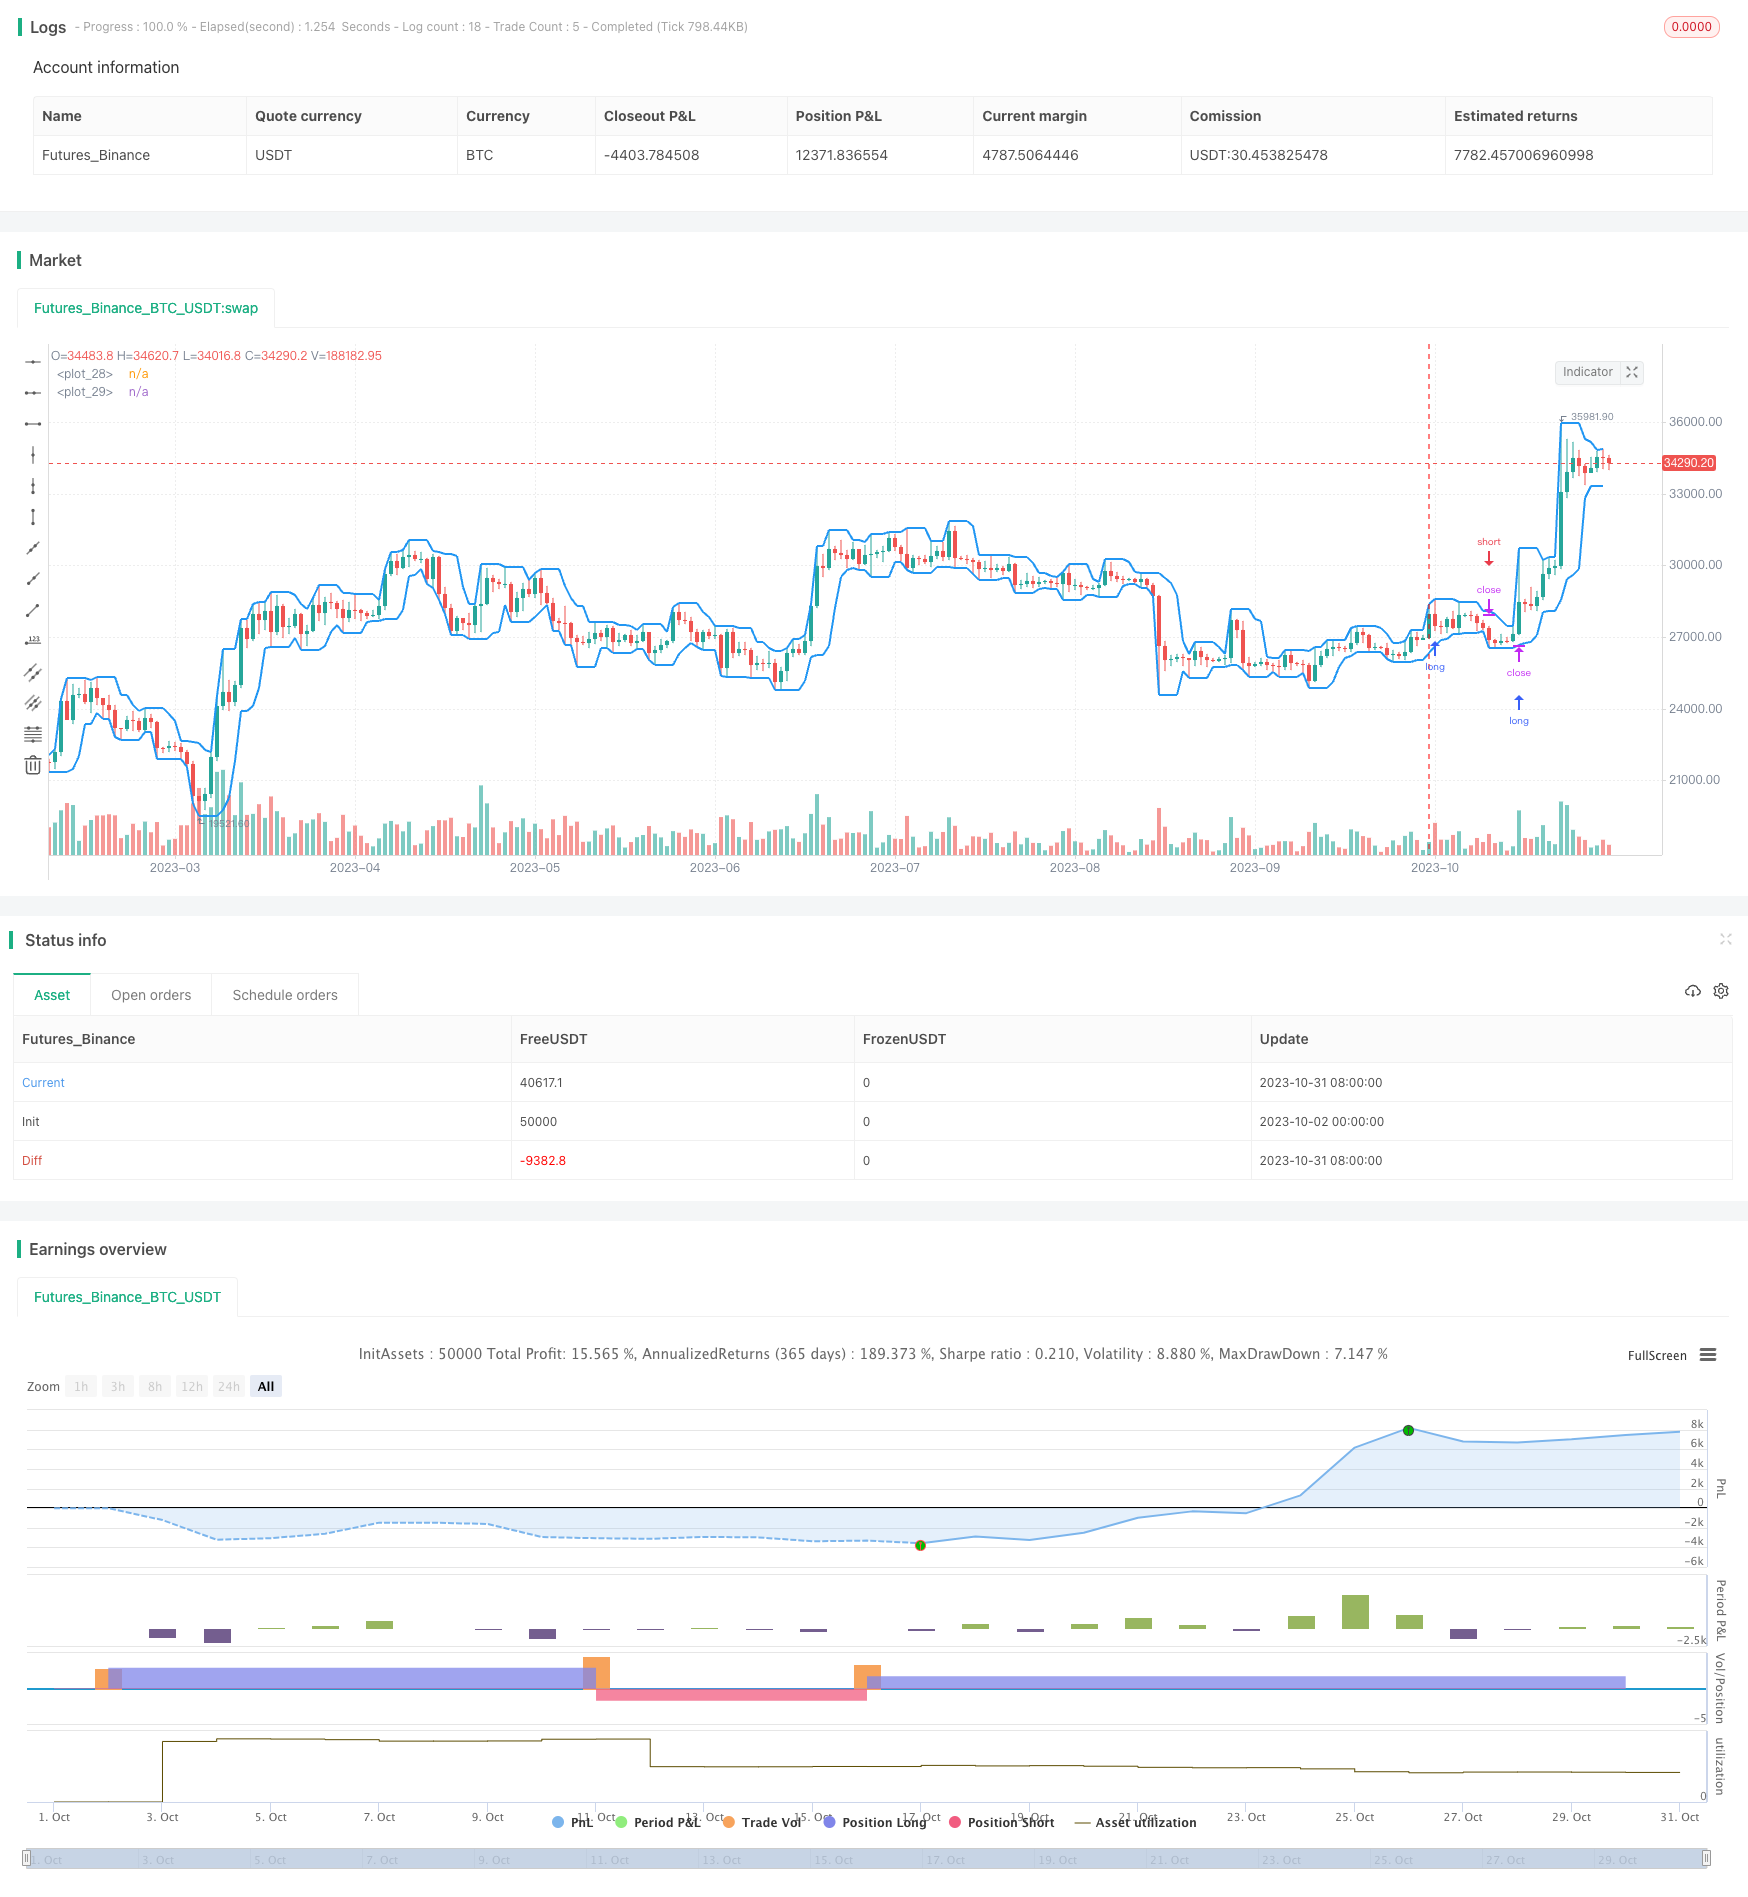
该策略基于突破理论,通过比较最高价和最低价的移动平均,判断趋势是否反转,以发现潜在的突破点,在突破点发生时进行交易。策略简单直接,适用于跟踪剧烈行情变化的标的。
|
||
|
|
|
||
|
|
## 策略原理
|
||
|
|
|
||
|
|
该策略首先根据用户设置计算出一定周期内的最高价和最低价的移动平均,最高价移动平均线代表上轨,最低价移动平均线代表下轨。当价格突破上轨时,表明价格出现上涨趋势,该策略将开仓做多;当价格跌破下轨时,表明价格出现下跌趋势,该策略将开仓做空。用户可以设置只做多或只做空。
|
||
|
|
|
||
|
|
该策略还提供了可选的止损止盈设置。做多时,止损点为上轨;做空时,止损点为下轨。这可以减小亏损。用户也可以选择以突破点作为止损点,即做多止损点为下轨,做空止损点为上轨,这可以获得更大盈利空间。
|
||
|
|
|
||
|
|
## 策略优势
|
||
|
|
|
||
|
|
该策略具有以下优势:
|
||
|
|
|
||
|
|
1. 策略思路简单直接,易于理解和实现。
|
||
|
|
|
||
|
|
2. 可以快速捕捉价格趋势的转折点,及时调整仓位。
|
||
|
|
|
||
|
|
3. 提供了可选的止损止盈方式,可以根据个人风险偏好进行设置。
|
||
|
|
|
||
|
|
4. 交易信号生成明确,不会出现频繁的假信号。
|
||
|
|
|
||
|
|
5. 可配置的参数较少,易于使用。
|
||
|
|
|
||
|
|
6. 可灵活配置只做多或只做空。
|
||
|
|
|
||
|
|
## 策略风险
|
||
|
|
|
||
|
|
该策略也存在一些风险:
|
||
|
|
|
||
|
|
1. 突破信号可能是假突破,无法持续。
|
||
|
|
|
||
|
|
2. 突破周期设置不当可能错过较长线的趋势。
|
||
|
|
|
||
|
|
3. 突破时没有考虑交易量,可能导致追高杀跌。
|
||
|
|
|
||
|
|
4. 存在一定的滞后,可能错过行情较好的部分。
|
||
|
|
|
||
|
|
5. 行情剧烈波动时,止损点有被突破的风险。
|
||
|
|
|
||
|
|
6. 仅基于突破点进行交易,收益具有不确定性。
|
||
|
|
|
||
|
|
## 策略优化
|
||
|
|
|
||
|
|
该策略可以从以下几个方面进行优化:
|
||
|
|
|
||
|
|
1. 结合交易量指标,避免虚假突破。例如突破时交易量放大,表示突破可能真实有效。
|
||
|
|
|
||
|
|
2. 优化移动平均的周期参数,使其能够匹配不同周期段的趋势变化。也可以尝试不同类型的移动平均。
|
||
|
|
|
||
|
|
3. 可以设置回调幅度,在突破点发生后再进一步确认,避免假突破。
|
||
|
|
|
||
|
|
4. 可以在突破 basis 上加入 Bollinger 通道等指数移动平均线工具,获得更多方向指示。
|
||
|
|
|
||
|
|
5. 可以结合 RSI、MACD 等其他INDICATOR,获取更多辅助交易信号,提高决策的准确性。
|
||
|
|
|
||
|
|
6. 优化止损止盈策略,使其更好地适应行情波动,同时控制风险。
|
||
|
|
|
||
|
|
## 总结
|
||
|
|
|
||
|
|
该突破交易策略整体思路清晰易懂,通过跟踪价格突破上下轨来判断进出场时机。策略优化空间较大,可通过整合更多指标信息和参数优化来强化策略效果。在熟悉该策略基本思路后,根据自身需要调整的参数,可获得较好的交易效果。
|
||
|
|
|
||
|
|
||
|
||
|
|
|
||
|
|
## Overview
|
||
|
|
|
||
|
|
This strategy is based on the breakout theory, comparing the moving averages of highest and lowest prices to determine if the trend is reversing, in order to find potential breakout points and trade when breakout happens. The strategy is simple and straightforward, suitable for tracking symbols with drastic price changes.
|
||
|
|
|
||
|
|
## Strategy Logic
|
||
|
|
|
||
|
|
This strategy first calculates the moving averages of highest and lowest prices within a user-defined period. The highest price moving average represents the upper band, and the lowest price moving average represents the lower band. When price breaks through the upper band, it signals an uptrend, and the strategy will open long position. When price breaks through the lower band, it signals a downtrend, and the strategy will open short position. Users can configure to only long or only short.
|
||
|
|
|
||
|
|
The strategy also provides optional stop loss and take profit settings. When long, the stop loss is set at upper band; when short, stop loss is set at lower band. This reduces losses. Users can also choose to set stop loss at the breakout point, i.e. when long, stop loss is lower band, and when short, stop loss is upper band. This allows more profit potential.
|
||
|
|
|
||
|
|
## Advantages
|
||
|
|
|
||
|
|
The advantages of this strategy are:
|
||
|
|
|
||
|
|
1. The logic is simple and straightforward, easy to understand and implement.
|
||
|
|
|
||
|
|
2. It can quickly capture trend reversal points and adjust positions accordingly.
|
||
|
|
|
||
|
|
3. It provides optional stop loss and take profit settings to fit personal risk preference.
|
||
|
|
|
||
|
|
4. The trading signals are clear, without too many false signals.
|
||
|
|
|
||
|
|
5. There are few configurable parameters, easy to use.
|
||
|
|
|
||
|
|
6. Flexibility to configure long only or short only.
|
||
|
|
|
||
|
|
## Risks
|
||
|
|
|
||
|
|
The risks of this strategy include:
|
||
|
|
|
||
|
|
1. Breakout signal may be false breakout and cannot sustain.
|
||
|
|
|
||
|
|
2. Improper breakout period setting may miss longer term trends.
|
||
|
|
|
||
|
|
3. It does not consider volume on breakout, may cause chasing highs and killing lows.
|
||
|
|
|
||
|
|
4. There is certain lag, may miss good portion of the move.
|
||
|
|
|
||
|
|
5. In volatile market, stop loss may get hit.
|
||
|
|
|
||
|
|
6. Relies solely on breakout for trading, profit is uncertain.
|
||
|
|
|
||
|
|
## Enhancements
|
||
|
|
|
||
|
|
The strategy can be enhanced in the following aspects:
|
||
|
|
|
||
|
|
1. Incorporate volume indicator to avoid false breakouts. For example, enlarged volume on breakout signals validity.
|
||
|
|
|
||
|
|
2. Optimize moving average period parameter to match trend changes in different cycle. Also try different moving average types.
|
||
|
|
|
||
|
|
3. Set a pullback threshold after breakout for further confirmation to avoid false breakout.
|
||
|
|
|
||
|
|
4. Add Bollinger Bands etc. on top of breakout basis for more directional guidance.
|
||
|
|
|
||
|
|
5. Incorporate other INDICATORs like RSI, MACD for additional trading signals and improve accuracy.
|
||
|
|
|
||
|
|
6. Optimize stop loss and take profit strategies to better cope with market fluctuation while controlling risk.
|
||
|
|
|
||
|
|
## Summary
|
||
|
|
|
||
|
|
The breakout trading strategy has a clear logic of tracking price breakout of upper and lower bands for entry and exit. There is large room for enhancement, by incorporating more indicator information and optimizing parameters to strengthen the strategy. After getting familiar with the basic logic, traders can customize parameters based on their needs and obtain good trading results.
|
||
|
|
|
||
|
|
[/trans]
|
||
|
|
|
||
|
|
> Strategy Arguments
|
||
|
|
|
||
|
|
|
||
|
|
|
||
|
|
|Argument|Default|Description|
|
||
|
|
|----|----|----|
|
||
|
|
|v_input_1|true|Long|
|
||
|
|
|v_input_2|true|Short|
|
||
|
|
|v_input_3|100|Capital, %|
|
||
|
|
|v_input_4|4|Length|
|
||
|
|
|v_input_5|false|Body mode|
|
||
|
|
|v_input_6|false|Revers|
|
||
|
|
|v_input_7|true|Show Lines?|
|
||
|
|
|v_input_8|1900|From Year|
|
||
|
|
|v_input_9|2100|To Year|
|
||
|
|
|v_input_10|true|From Month|
|
||
|
|
|v_input_11|12|To Month|
|
||
|
|
|v_input_12|true|From day|
|
||
|
|
|v_input_13|31|To day|
|
||
|
|
|
||
|
|
|
||
|
|
> Source (PineScript)
|
||
|
|
|
||
|
|
``` javascript
|
||
|
|
/*backtest
|
||
|
|
start: 2023-10-02 00:00:00
|
||
|
|
end: 2023-11-01 00:00:00
|
||
|
|
period: 1d
|
||
|
|
basePeriod: 1h
|
||
|
|
exchanges: [{"eid":"Futures_Binance","currency":"BTC_USDT"}]
|
||
|
|
*/
|
||
|
|
|
||
|
|
//Noro
|
||
|
|
//2018
|
||
|
|
|
||
|
|
//@version=3
|
||
|
|
strategy(title = "Noro's Brakeout Strategy v2.0", shorttitle = "Brakeout str 2.0", overlay = true, default_qty_type = strategy.percent_of_equity, default_qty_value = 100, pyramiding = 0)
|
||
|
|
|
||
|
|
//Settings
|
||
|
|
needlong = input(true, defval = true, title = "Long")
|
||
|
|
needshort = input(true, defval = true, title = "Short")
|
||
|
|
capital = input(100, defval = 100, minval = 1, maxval = 10000, title = "Capital, %")
|
||
|
|
len = input(4, defval = 4, minval = 1, maxval = 1000, title = "Length")
|
||
|
|
bod = input(false, defval = false, title = "Body mode")
|
||
|
|
rev = input(false, defval = false, title = "Revers")
|
||
|
|
showlines = input(true, defval = true, title = "Show Lines?")
|
||
|
|
fromyear = input(1900, defval = 1900, minval = 1900, maxval = 2100, title = "From Year")
|
||
|
|
toyear = input(2100, defval = 2100, minval = 1900, maxval = 2100, title = "To Year")
|
||
|
|
frommonth = input(01, defval = 01, minval = 01, maxval = 12, title = "From Month")
|
||
|
|
tomonth = input(12, defval = 12, minval = 01, maxval = 12, title = "To Month")
|
||
|
|
fromday = input(01, defval = 01, minval = 01, maxval = 31, title = "From day")
|
||
|
|
today = input(31, defval = 31, minval = 01, maxval = 31, title = "To day")
|
||
|
|
|
||
|
|
//Extremums
|
||
|
|
min = bod ? min(open, close) : low
|
||
|
|
max = bod ? max(open, close) : high
|
||
|
|
upex = highest(max, len) + syminfo.mintick * 10
|
||
|
|
dnex = lowest(min, len) - syminfo.mintick * 10
|
||
|
|
col = showlines ? blue : na
|
||
|
|
plot(upex, color = col, linewidth = 2)
|
||
|
|
plot(dnex, color = col, linewidth = 2)
|
||
|
|
|
||
|
|
//Trading
|
||
|
|
lot = 0.0
|
||
|
|
lot := strategy.position_size != strategy.position_size[1] ? strategy.equity / close * capital / 100 : lot[1]
|
||
|
|
|
||
|
|
if (not na(close[len])) and rev == false
|
||
|
|
strategy.entry("Long", strategy.long, needlong == false ? 0 : lot, stop = upex)
|
||
|
|
strategy.entry("Short", strategy.short, needshort == false ? 0 : lot, stop = dnex)
|
||
|
|
|
||
|
|
if (not na(close[len])) and rev == true
|
||
|
|
strategy.entry("Long", strategy.long, needlong == false ? 0 : lot, limit = dnex)
|
||
|
|
strategy.entry("Short", strategy.short, needshort == false ? 0 : lot, limit = upex)
|
||
|
|
|
||
|
|
if time > timestamp(toyear, tomonth, today, 23, 59)
|
||
|
|
strategy.close_all()
|
||
|
|
```
|
||
|
|
|
||
|
|
> Detail
|
||
|
|
|
||
|
|
https://www.fmz.com/strategy/430883
|
||
|
|
|
||
|
|
> Last Modified
|
||
|
|
|
||
|
|
2023-11-02 16:40:26
|