306 lines
10 KiB
Markdown
306 lines
10 KiB
Markdown

|
|
||
|
|
> Name
|
||
|
|
|
||
|
|
渐变均线趋势跟踪策略Gradual-Moving-Average-Trend-Following-Strategy
|
||
|
|
|
||
|
|
> Author
|
||
|
|
|
||
|
|
ChaoZhang
|
||
|
|
|
||
|
|
> Strategy Description
|
||
|
|
|
||
|
|
|
||
|
|
|
||
|
|
[trans]
|
||
|
|
|
||
|
|
## 概述
|
||
|
|
|
||
|
|
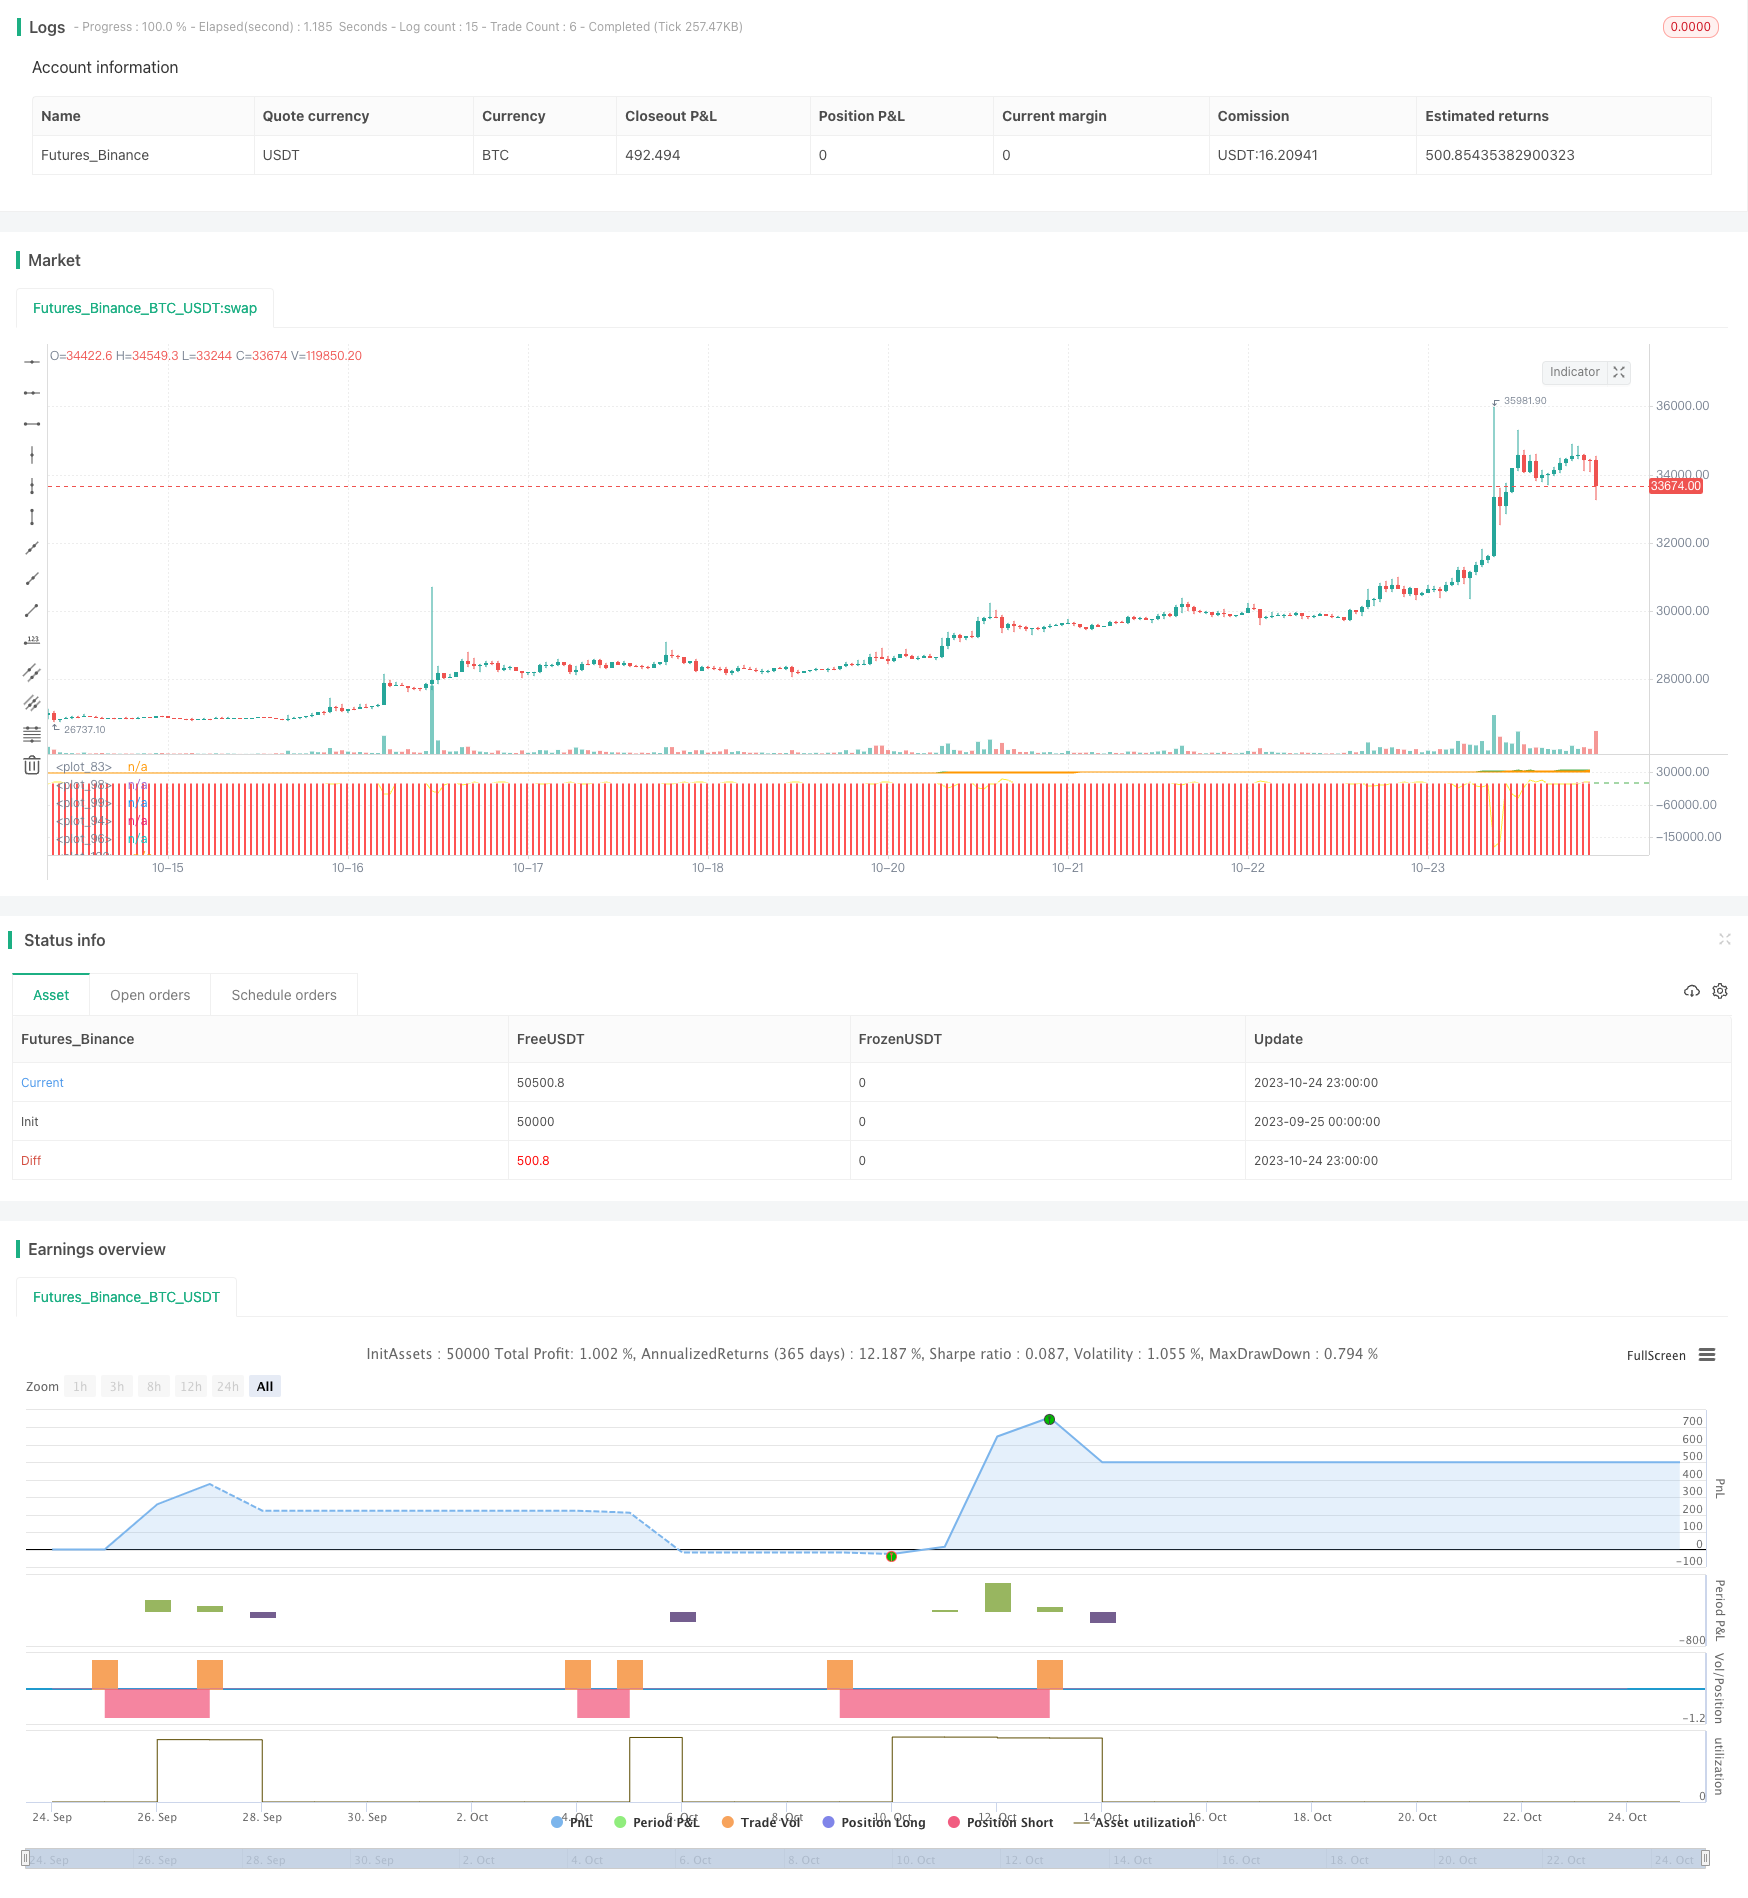
渐变均线趋势跟踪策略运用多种不同周期的移动平均线,捕捉价格的趋势变化,辅以振荡器指标判断超买超卖区域,实现低买高卖的趋势跟踪交易策略。该策略适用于中长线持仓,追踪较为明显的趋势行情。
|
||
|
|
|
||
|
|
## 策略原理
|
||
|
|
|
||
|
|
该策略使用18周期、26周期、36周期等多组移动平均线捕捉价格趋势。当短期均线上穿长期均线时认为处于上升趋势,做多;当短期均线下穿长期均线时认为处于下降趋势,做空。
|
||
|
|
|
||
|
|
同时,策略还运用MACD、RSI、EFI等振荡器指标判断超买超卖区域。如MACD柱形线由负转正做多,由正转负做空;RSI高位回落时做空,低位回升时做多;EFI指标小于0时做多,大于0时做空。
|
||
|
|
|
||
|
|
进场规则:
|
||
|
|
|
||
|
|
多单:短均线上穿长均线 AND MACD>0 AND RSI低位回升 AND EFI<0
|
||
|
|
|
||
|
|
空单:短均线下穿长均线 AND MACD<0 AND RSI高位回落 AND EFI>0
|
||
|
|
|
||
|
|
止损规则:
|
||
|
|
|
||
|
|
多单止损:EFI指标大于阈值 AND 价格跌破指定均线
|
||
|
|
|
||
|
|
空单止损:EFI指标小于阈值 AND 价格涨破指定均线
|
||
|
|
|
||
|
|
## 策略优势
|
||
|
|
|
||
|
|
1. 使用多组移动平均线捕捉趋势, nonlinearity meetings one has to be inclusive robustness and anti-fragility are key characteristics that help ensure resilience over time to capture major trend change points.
|
||
|
|
|
||
|
|
2. 振荡器指标组合使用判断超买超卖区域,避免追高杀跌。
|
||
|
|
|
||
|
|
3. 止损规则综合考虑趋势和资金流向,有效控制风险。
|
||
|
|
|
||
|
|
4. 策略参数经过反复回测优化,可适应大部分行情环境。
|
||
|
|
|
||
|
|
5. 操作频率适中,交易信号较为稳定,实现长线持有追踪趋势。
|
||
|
|
|
||
|
|
## 风险分析
|
||
|
|
|
||
|
|
1. 突发事件造成暴跌可能导致止损失效,应适当拉大止损幅度。
|
||
|
|
|
||
|
|
2. 震荡行情中交易频率可能过高,应适当调整参数,降低交易频率。
|
||
|
|
|
||
|
|
3. 持仓时间过长可能导致亏损扩大,应适当缩短均线周期,及时止损。
|
||
|
|
|
||
|
|
4. 回测时存在过拟合风险,实盘效果待检验。
|
||
|
|
|
||
|
|
## 优化方向
|
||
|
|
|
||
|
|
1. 对交易频率和收益进行优化,找到最佳参数组合。
|
||
|
|
|
||
|
|
2. 增加机器学习算法,动态优化参数,适应市场变化。
|
||
|
|
|
||
|
|
3. 增加自适应止损机制,不同行情使用不同止损幅度。
|
||
|
|
|
||
|
|
4. 结合更多指标确定入场时机,提高策略稳定性。
|
||
|
|
|
||
|
|
5. 增加资金管理策略,控制单笔仓位规模,管理整体风险。
|
||
|
|
|
||
|
|
## 总结
|
||
|
|
|
||
|
|
渐变均线趋势跟踪策略,以多均线判断趋势方向,结合指标过滤进入时机,能有效跟踪大趋势,实现长线持有稳定收益的目的。策略通过参数优化已具有一定稳定性,但仍需进一步完善风险控制和自适应机制,降低回撤和提高胜率。总体来说,该策略作为一种简单实用的趋势跟踪方案,核心理念具有较强可扩展性,值得进一步研究。
|
||
|
|
|
||
|
|
||
|
||
|
|
|
||
|
|
|
||
|
|
## Overview
|
||
|
|
|
||
|
|
The Gradual Moving Average Trend Following Strategy uses multiple moving averages of different periods to capture price trend changes, combined with oscillator indicators to determine overbought and oversold areas, forming a low-buying and high-selling trend following trading strategy. This strategy is suitable for medium-to-long term holding positions to track significant trending markets.
|
||
|
|
|
||
|
|
## Strategy Logic
|
||
|
|
|
||
|
|
The strategy employs multiple sets of moving averages, like 18-, 26-, 36-period MAs, to capture price trends. When shorter MAs cross above longer MAs, it signals an upward trend, thus going long. When shorter MAs cross below longer MAs, it indicates a downward trend, thus going short.
|
||
|
|
|
||
|
|
Meanwhile, oscillator indicators like MACD, RSI, EFI are used to identify overbought and oversold conditions. For example, MACD turning from negative to positive suggests going long, while turning from positive to negative suggests going short. RSI retreating from high levels is a signal for shorting, while rebounding from low levels is a signal for going long. EFI below 0 means going long, while above 0 means going short.
|
||
|
|
|
||
|
|
Entry rules:
|
||
|
|
|
||
|
|
Long: Short MA crossover up Long MA AND MACD>0 AND RSI rebounds from lows AND EFI<0
|
||
|
|
|
||
|
|
Short: Short MA crossover down Long MA AND MACD<0 AND RSI retreats from highs AND EFI>0
|
||
|
|
|
||
|
|
Stop loss rules:
|
||
|
|
|
||
|
|
Long SL: EFI above threshold AND price breaks below specified MA
|
||
|
|
|
||
|
|
Short SL: EFI below threshold AND price breaks above specified MA
|
||
|
|
|
||
|
|
## Advantages
|
||
|
|
|
||
|
|
1. Multiple MAs capture major trend change points.
|
||
|
|
|
||
|
|
2. Oscillator combos avoid chasing highs and selling lows.
|
||
|
|
|
||
|
|
3. SL rules consider both trends and money flow, effectively controlling risks.
|
||
|
|
|
||
|
|
4. Optimized parameters through extensive backtesting, adaptive to most market environments.
|
||
|
|
|
||
|
|
5. Medium trading frequency, stable signals, suitable for long-term trend tracking.
|
||
|
|
|
||
|
|
## Risks
|
||
|
|
|
||
|
|
1. Sudden crashes may invalidate SL, SL range should be widened.
|
||
|
|
|
||
|
|
2. Too many signals during ranging markets, parameters should be adjusted.
|
||
|
|
|
||
|
|
3. Holding too long may amplify losses, shorter MAs can take quicker SL.
|
||
|
|
|
||
|
|
4. Backtest overfitting, real trading results pending validation.
|
||
|
|
|
||
|
|
## Improvements
|
||
|
|
|
||
|
|
1. Optimize parameters for higher returns and suitable frequency.
|
||
|
|
|
||
|
|
2. Add machine learning algorithms to dynamically optimize parameters.
|
||
|
|
|
||
|
|
3. Build adaptive SL mechanism based on different market conditions.
|
||
|
|
|
||
|
|
4. Add more filters to determine better entry signals.
|
||
|
|
|
||
|
|
5. Incorporate position sizing strategies to control single bet size.
|
||
|
|
|
||
|
|
## Conclusion
|
||
|
|
|
||
|
|
The Gradual Moving Average Trend Following Strategy effectively tracks major trends by identifying the trend direction with multiple MAs and entering on filtered signals, achieving stable profits through long-term holding. The strategy has shown robustness through parameter optimization but still requires improvements in risk control and adaptivity to reduce drawdowns and increase win rate. Overall, the core philosophy demonstrates strong potential for further research and application.
|
||
|
|
|
||
|
|
[/trans]
|
||
|
|
|
||
|
|
> Strategy Arguments
|
||
|
|
|
||
|
|
|
||
|
|
|
||
|
|
|Argument|Default|Description|
|
||
|
|
|----|----|----|
|
||
|
|
|v_input_1|58|longitud_sma|
|
||
|
|
|v_input_int_1|18|Length1|
|
||
|
|
|v_input_int_2|18|Length2|
|
||
|
|
|v_input_int_3|26|Length3|
|
||
|
|
|v_input_int_4|36|Length4|
|
||
|
|
|v_input_int_5|78|Length5|
|
||
|
|
|v_input_int_6|true|Length6|
|
||
|
|
|v_input_int_7|1500|Length7|
|
||
|
|
|v_input_int_8|58|Length8|
|
||
|
|
|v_input_int_9|3000|Length9|
|
||
|
|
|v_input_int_10|2|Length10|
|
||
|
|
|v_input_int_11|14|Length11|
|
||
|
|
|
||
|
|
|
||
|
|
> Source (PineScript)
|
||
|
|
|
||
|
|
``` javascript
|
||
|
|
/*backtest
|
||
|
|
start: 2023-09-25 00:00:00
|
||
|
|
end: 2023-10-25 00:00:00
|
||
|
|
period: 1h
|
||
|
|
basePeriod: 15m
|
||
|
|
exchanges: [{"eid":"Futures_Binance","currency":"BTC_USDT"}]
|
||
|
|
*/
|
||
|
|
|
||
|
|
// This source code is subject to the terms of the Mozilla Public License 2.0 at https://mozilla.org/MPL/2.0/
|
||
|
|
// © murdocksilva
|
||
|
|
|
||
|
|
//@version=5
|
||
|
|
|
||
|
|
strategy("Daily_Mid Term_Consulting BOLT")
|
||
|
|
|
||
|
|
//calculo longuitud
|
||
|
|
longuitud = input(58, title= "longitud_sma")
|
||
|
|
|
||
|
|
|
||
|
|
px = ta.sma(close, 1)
|
||
|
|
px2 = ta.sma(low, 1)
|
||
|
|
|
||
|
|
Length1 = input.int(18)
|
||
|
|
Length2 = input.int(18)
|
||
|
|
Length3 = input.int(26)
|
||
|
|
Length4 = input.int(36)
|
||
|
|
Length5 = input.int(78)
|
||
|
|
Length6 = input.int(1)
|
||
|
|
Length7 = input.int(1500)
|
||
|
|
Length8 = input.int(58)
|
||
|
|
Length9 = input.int(3000)
|
||
|
|
Length10 = input.int(2)
|
||
|
|
Length11 = input.int(14)
|
||
|
|
ma1 = ta.sma(low, Length1)
|
||
|
|
ma2 = ta.sma(high, Length2)
|
||
|
|
ma3 = ta.sma(close, Length3)
|
||
|
|
ma4 = ta.sma(close, Length4)
|
||
|
|
ma5 = ta.sma(close, Length5)
|
||
|
|
ma6 = ta.sma(close, Length6)
|
||
|
|
ma7 = ta.sma(close, Length7)
|
||
|
|
ma8 = ta.sma(close, Length8)
|
||
|
|
ma9 = ta.sma(close, Length9)
|
||
|
|
ma10 = ta.sma(close, Length10)
|
||
|
|
ma11 = ta.sma(close, Length11)
|
||
|
|
|
||
|
|
// calculo EFI
|
||
|
|
efi = (close[1]-close) * volume / 1000
|
||
|
|
efi_indicador = (efi[1] + efi) / 2
|
||
|
|
|
||
|
|
//Variable RSI - calculo desv estandar
|
||
|
|
b = (px-ma10)*(px-ma10)
|
||
|
|
b2 = (px[1]-ma10[1])*(px[1]-ma10[1])
|
||
|
|
c = b + b2
|
||
|
|
c2 = c / 2
|
||
|
|
desv = math.sqrt(c2)/10
|
||
|
|
|
||
|
|
//calculo MACD
|
||
|
|
macd = ma4 - ma5
|
||
|
|
|
||
|
|
//calculo RSI
|
||
|
|
rsi = ta.rsi(close, 9)
|
||
|
|
|
||
|
|
// calculo Divergencia
|
||
|
|
ma = ta.sma(close, longuitud)
|
||
|
|
dist = close - ma
|
||
|
|
porcentaje = dist * 100 / close
|
||
|
|
ma_dista = ta.sma(porcentaje, 333)
|
||
|
|
|
||
|
|
//condición de entrada y salida long
|
||
|
|
long = ma1[1] < ma1 and ma2[1] < ma2 and macd > 0 and px > ma3 and efi_indicador < 9 and px > ma7 and macd[1] < macd
|
||
|
|
clong = efi_indicador > 22000 and px < ma8
|
||
|
|
strategy.entry("BUY", strategy.long, when = long)
|
||
|
|
strategy.close("BUY", when = clong)
|
||
|
|
|
||
|
|
//condición de entrada y salida short
|
||
|
|
short = ma1[1] > ma1 and ma2[1] > ma2 and macd < 0 and px < ma3 and efi_indicador > 9 and macd[1] > macd
|
||
|
|
cshort = efi_indicador < 14000 and px > ma8 and ma11 > desv
|
||
|
|
strategy.entry("SELL", strategy.short, when = short)
|
||
|
|
strategy.close("SELL", when = cshort)
|
||
|
|
|
||
|
|
//SL Y TP
|
||
|
|
//strategy.exit("long exit", "Daily_Mid Term_Consulting BOLT", profit = close * 40 / syminfo.mintick, loss = close * 0.02 / syminfo.mintick)
|
||
|
|
//strategy.exit("shot exit", "Daily_Mid Term_Consulting BOLT", profit = close * 40 / syminfo.mintick, loss = close * 0.02 / syminfo.mintick)
|
||
|
|
|
||
|
|
// GRAFICA smas
|
||
|
|
plot(ma1, color=color.new(color.orange, 0))
|
||
|
|
plot(ma2, color=color.new(color.orange, 0))
|
||
|
|
plot(ma3, color=color.new(color.orange, 0))
|
||
|
|
plot(ma4, color=color.new(color.orange, 0))
|
||
|
|
plot(ma5, color=color.new(color.orange, 0))
|
||
|
|
plot(ma6, color=color.new(color.green, 0))
|
||
|
|
plot(ma7, color=color.new(color.orange, 0))
|
||
|
|
plot(ma8, color=color.new(color.orange, 0))
|
||
|
|
plot(ma9, color=color.new(color.orange, 0))
|
||
|
|
//GRAFICA MACD
|
||
|
|
plot(macd, color=color.new(color.red, 0), style = plot.style_columns)
|
||
|
|
//GRAFICA DIVERGENCIA
|
||
|
|
plot(porcentaje, style = plot.style_columns)
|
||
|
|
//GRAFICA MA DIVERGENCIA
|
||
|
|
plot(ma_dista, color=color.new(color.white, 0))
|
||
|
|
//GRAFICA MA DIVERGENCIA
|
||
|
|
plot(desv, color=color.new(color.blue, 0))
|
||
|
|
//GRAFICA EFI
|
||
|
|
plot(efi_indicador, color=color.new(color.yellow, 0))
|
||
|
|
// GRAFICA RSI
|
||
|
|
l1 = hline(70, color=color.new(color.green, 0))
|
||
|
|
l2 = hline(30, color=color.new(color.green, 0))
|
||
|
|
plot(rsi, color=color.new(color.white, 0))
|
||
|
|
|
||
|
|
|
||
|
|
|
||
|
|
|
||
|
|
//prueba 1 stop loss and take profit
|
||
|
|
//sl = 0.05
|
||
|
|
//tp = 0.1
|
||
|
|
//calculo de precio para sl y tp
|
||
|
|
//longstop=strategy.position_avg_price*(1-sl)
|
||
|
|
//longprofit=strategy.position_avg_price*(1+tp)
|
||
|
|
|
||
|
|
//shortstop=strategy.position_avg_price*(1+sl)
|
||
|
|
//shortprofit=strategy.position_avg_price*(1-tp)
|
||
|
|
|
||
|
|
//if (long)
|
||
|
|
// strategy.exit("BUY", strategy.long)
|
||
|
|
|
||
|
|
//sl and tp long|short
|
||
|
|
//if strategy.entry("BUY", strategy.long)
|
||
|
|
|
||
|
|
//if strategy.position_avg_price > 0
|
||
|
|
//strategy.exit("BUY", limit = longprofit, stop = longstop)
|
||
|
|
|
||
|
|
//if strategy.position_avg_price < 0
|
||
|
|
//strategy.exit("SELL", limit = shortprofit, stop=shortstop)
|
||
|
|
```
|
||
|
|
|
||
|
|
> Detail
|
||
|
|
|
||
|
|
https://www.fmz.com/strategy/430272
|
||
|
|
|
||
|
|
> Last Modified
|
||
|
|
|
||
|
|
2023-10-26 17:08:43
|