324 lines
13 KiB
Markdown
324 lines
13 KiB
Markdown

|
|
|||
|
|
> Name
|
|||
|
|
|
|||
|
|
基于移动平均线和超级趋势的跟踪止损策略Trend-Following-Strategy-with-Moving-Averages-and-SuperTrend
|
|||
|
|
|
|||
|
|
> Author
|
|||
|
|
|
|||
|
|
ChaoZhang
|
|||
|
|
|
|||
|
|
> Strategy Description
|
|||
|
|
|
|||
|
|
|
|||
|
|
|
|||
|
|
[trans]
|
|||
|
|
|
|||
|
|
## 概述
|
|||
|
|
|
|||
|
|
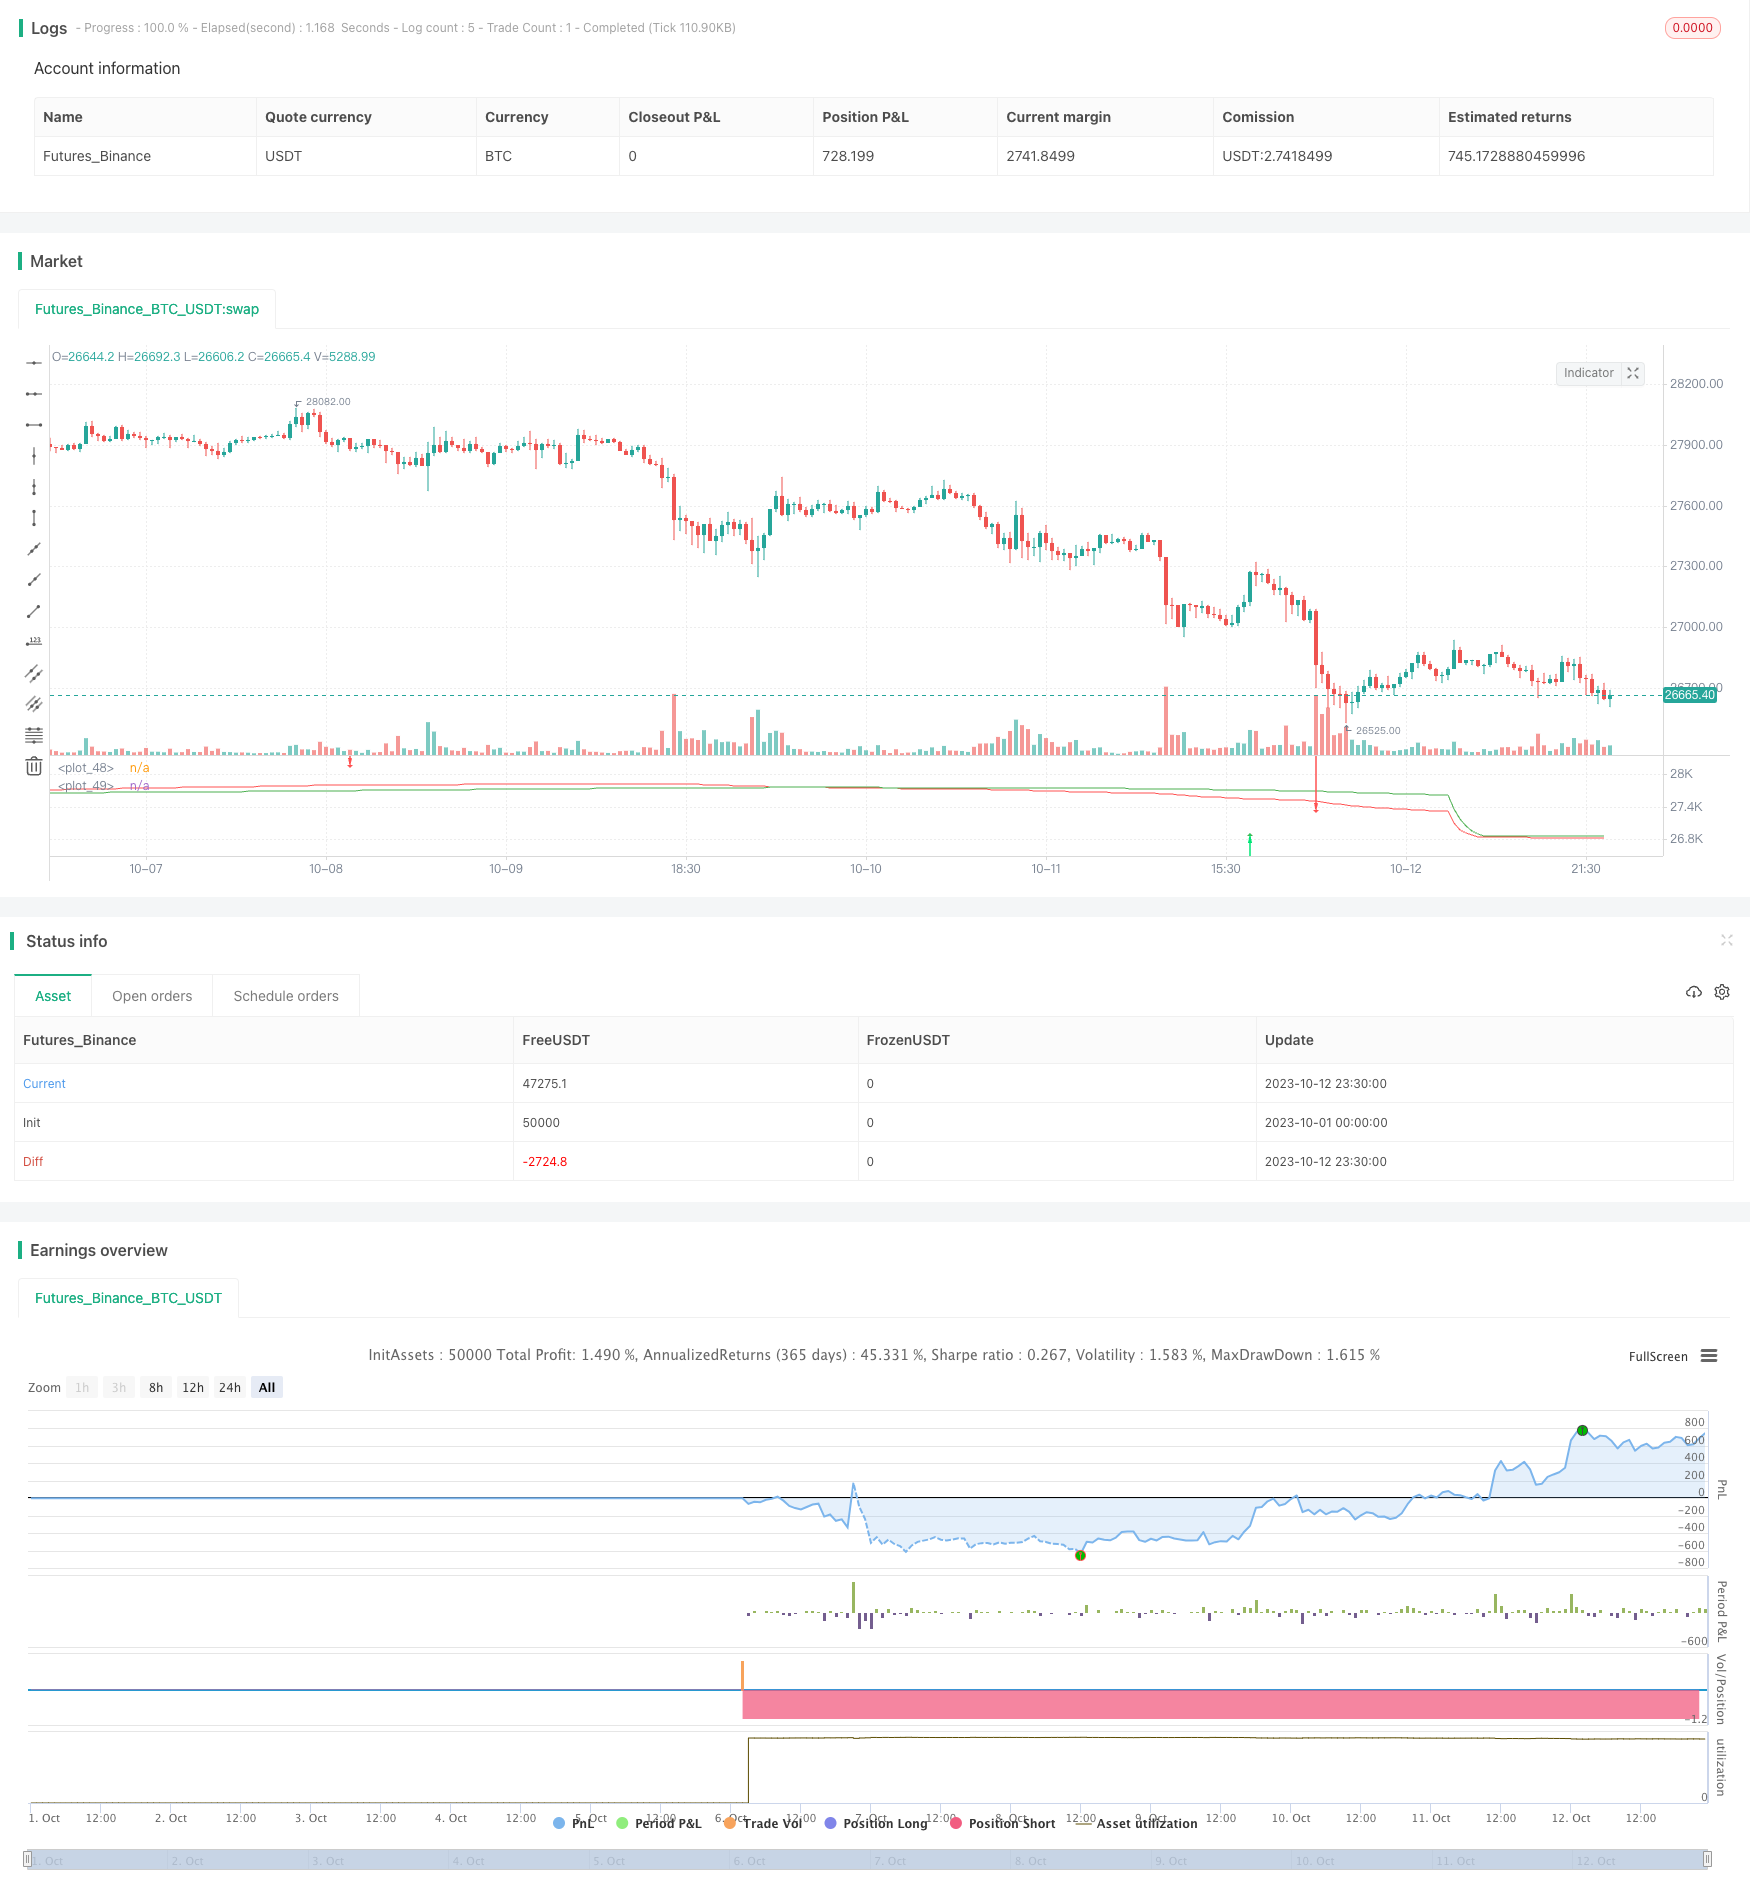
该策略融合了移动平均线指标和超级趋势指标,实现了一个具有跟踪止损功能的趋势跟随策略。策略充分利用了移动平均线的趋势判断能力以及超级趋势的止损功能,可以有效地跟踪趋势,同时控制风险。
|
|||
|
|
|
|||
|
|
## 策略原理
|
|||
|
|
|
|||
|
|
该策略使用两条FRAMA均线进行买卖信号判断,并结合超级趋势指标进行过滤。
|
|||
|
|
|
|||
|
|
具体来说,当快线上穿慢线时产生买入信号,当快线下穿慢线时产生卖出信号。为了避免出现假断裂,策略增加了超级趋势指标过滤条件,只有当超级趋势指标同向时才会进行交易。
|
|||
|
|
|
|||
|
|
在持仓管理上,策略采用超级趋势指标的变向作为止损退出信号。当超级趋势指标发生反转时,进行止损退出。
|
|||
|
|
|
|||
|
|
另外,策略还设置了可选的跟踪止损功能。在实现一定盈利后,可以开启跟踪止损来锁定利润。
|
|||
|
|
|
|||
|
|
## 优势分析
|
|||
|
|
|
|||
|
|
- 利用移动平均线判断趋势方向,能够有效滤除市场噪音,精确判断趋势
|
|||
|
|
- 结合超级趋势指标过滤,避免出现假突破的错误交易
|
|||
|
|
- 超级趋势指标的变向作为止损点,可以快速止损,有效控制风险
|
|||
|
|
- 可选的跟踪止损功能,可以实现盈利的最大化
|
|||
|
|
|
|||
|
|
## 风险分析
|
|||
|
|
|
|||
|
|
- 作为趋势跟踪策略,在趋势震荡时容易被套,需要注意控制位置规模
|
|||
|
|
- 移动平均线存在滞后性,可能导致入场过早或过晚
|
|||
|
|
- 超级趋势指标参数设置不当可能导致止损过于激进或保守
|
|||
|
|
- 启用跟踪止损时需要注意合理设置跟踪幅度,避免过于激进止损
|
|||
|
|
|
|||
|
|
可通过调整移动平均线参数,优化超级趋势指标设置,合理使用跟踪止损来降低这些风险。
|
|||
|
|
|
|||
|
|
## 优化方向
|
|||
|
|
|
|||
|
|
该策略可以从以下几个方面进行优化:
|
|||
|
|
|
|||
|
|
1. 优化移动平均线参数,寻找最佳参数组合
|
|||
|
|
|
|||
|
|
可以测试不同周期参数的组合,找到平滑效果和灵敏度的最佳平衡。
|
|||
|
|
|
|||
|
|
2. 自定义超级趋势指标参数
|
|||
|
|
|
|||
|
|
可以测试不同ATR周期和倍数参数,优化止损效果。
|
|||
|
|
|
|||
|
|
3. 增加其它指标过滤
|
|||
|
|
|
|||
|
|
可以测试增加商品通道指标、波动率指标等来进一步过滤信号。
|
|||
|
|
|
|||
|
|
4. 优化跟踪止损参数
|
|||
|
|
|
|||
|
|
可以测试不同的跟踪止损幅度,找到最大化盈利和风险控制的最佳参数。
|
|||
|
|
|
|||
|
|
5. 结合其它止损策略
|
|||
|
|
|
|||
|
|
可以测试与一般止损、震荡止损、机动止损等策略的组合使用。
|
|||
|
|
|
|||
|
|
## 总结
|
|||
|
|
|
|||
|
|
该策略整合了移动平均线的趋势判断和超级趋势的止损管理,形成一个较为完整的具有跟踪止损功能的趋势跟随策略。通过参数优化和风险管理,可以进一步增强策略的稳定性和盈利能力。策略适合有一定基础的量化交易者使用。
|
|||
|
|
|
|||
|
|
||
|
|||
|
|
|
|||
|
|
## Overview
|
|||
|
|
|
|||
|
|
This strategy combines Moving Average indicators and SuperTrend indicator to implement a trend following strategy with trailing stop loss. It takes full advantage of Moving Averages’ trend judging capability and SuperTrend’s stop loss function to effectively track trends and control risks.
|
|||
|
|
|
|||
|
|
## Strategy Logic
|
|||
|
|
|
|||
|
|
The strategy uses two FRAMA moving averages for trading signals and SuperTrend indicator for filtering.
|
|||
|
|
|
|||
|
|
Specifically, when the fast line crosses above the slow line, a buy signal is generated. When the fast line crosses below the slow line, a sell signal is generated. To avoid false breaks, the strategy adds a filter requiring SuperTrend indicator to align. Trades are only taken when SuperTrend agrees with signal direction.
|
|||
|
|
|
|||
|
|
For position management, the strategy uses SuperTrend direction change as a stop loss signal. When SuperTrend reverses direction, the position will be stopped out.
|
|||
|
|
|
|||
|
|
In addition, trailing stop loss can be enabled as an option. After certain profit target is reached, trailing stop can be used to lock in profits.
|
|||
|
|
|
|||
|
|
## Advantage Analysis
|
|||
|
|
|
|||
|
|
- Utilizes Moving Averages to determine trend direction, able to filter out market noise and precisely judge trends
|
|||
|
|
- Combining with SuperTrend filter avoids wrong trades from false breakouts
|
|||
|
|
- SuperTrend direction change acts as stop loss point, allowing quick stop loss and effective risk control
|
|||
|
|
- Optional trailing stop loss can maximize profits
|
|||
|
|
|
|||
|
|
## Risk Analysis
|
|||
|
|
|
|||
|
|
- As a trend following strategy, it’s vulnerable to whipsaws in ranging markets. Position sizing needs to be controlled.
|
|||
|
|
- Moving Averages have lagging effect, may cause premature or late entry
|
|||
|
|
- Improper SuperTrend parameters may lead to too aggressive or too conservative stop loss
|
|||
|
|
- When enabling trailing stop, trailing width needs to be set properly to avoid overactive stop loss
|
|||
|
|
|
|||
|
|
These risks can be reduced by adjusting Moving Average parameters, optimizing SuperTrend settings, and using trailing stop loss appropriately.
|
|||
|
|
|
|||
|
|
## Optimization Directions
|
|||
|
|
|
|||
|
|
The strategy can be optimized in the following aspects:
|
|||
|
|
|
|||
|
|
1. Optimize Moving Average parameters to find best parameter combination
|
|||
|
|
|
|||
|
|
Different period combinations can be tested to find the optimal balance of smoothness and sensitivity.
|
|||
|
|
|
|||
|
|
2. Customize SuperTrend parameters
|
|||
|
|
|
|||
|
|
Different ATR periods and multipliers can be tested to optimize stop loss effect.
|
|||
|
|
|
|||
|
|
3. Add other indicator filters
|
|||
|
|
|
|||
|
|
Additional filters like Donchian Channel, Volatility indicator can be tested.
|
|||
|
|
|
|||
|
|
4. Optimize trailing stop parameters
|
|||
|
|
|
|||
|
|
Different trailing widths can be tested to maximize profit and control risk.
|
|||
|
|
|
|||
|
|
5. Combine with other stop loss strategies
|
|||
|
|
|
|||
|
|
Combinations with fixed stop, volatility stop, adaptive stop can be tested.
|
|||
|
|
|
|||
|
|
## Conclusion
|
|||
|
|
|
|||
|
|
The strategy integrates Moving Averages’ trend analysis and SuperTrend’s stop management into a complete trend following strategy with trailing stop loss. Further enhancements on risk management and parameter optimization can improve its stability and profitability. It is suitable for quantitative traders with some experience.
|
|||
|
|
|
|||
|
|
[/trans]
|
|||
|
|
|
|||
|
|
> Strategy Arguments
|
|||
|
|
|
|||
|
|
|
|||
|
|
|
|||
|
|
|Argument|Default|Description|
|
|||
|
|
|----|----|----|
|
|||
|
|
|v_input_1_close|0|MA FRAMA Source: close|high|low|open|hl2|hlc3|hlcc4|ohlc4|
|
|||
|
|
|v_input_2|12|MA FRAMA Length|
|
|||
|
|
|v_input_3|1W|Resolution|
|
|||
|
|
|v_input_4|true|* Fractal Adjusted (FRAMA) Only - FC|
|
|||
|
|
|v_input_5|200|* Fractal Adjusted (FRAMA) Only - SC|
|
|||
|
|
|v_input_6|false|Use supertrend for enter|
|
|||
|
|
|v_input_7|false|Use supertrend for exit|
|
|||
|
|
|v_input_8|3|Factor|
|
|||
|
|
|v_input_9|7|Pd|
|
|||
|
|
|v_input_10|false|Take Profit Points|
|
|||
|
|
|v_input_11|false|Stop Loss Points|
|
|||
|
|
|v_input_12|false|Trailing Stop Loss Points|
|
|||
|
|
|v_input_13|false|Trailing Stop Loss Offset Points|
|
|||
|
|
|v_input_14|false|Custom Backtesting Dates|
|
|||
|
|
|v_input_15|2020|Backtest Start Year|
|
|||
|
|
|v_input_16|true|Backtest Start Month|
|
|||
|
|
|v_input_17|true|Backtest Start Day|
|
|||
|
|
|v_input_18|false|Backtest Start Hour|
|
|||
|
|
|v_input_19|2020|Backtest Stop Year|
|
|||
|
|
|v_input_20|12|Backtest Stop Month|
|
|||
|
|
|v_input_21|31|Backtest Stop Day|
|
|||
|
|
|v_input_22|23|Backtest Stop Hour|
|
|||
|
|
|
|||
|
|
|
|||
|
|
> Source (PineScript)
|
|||
|
|
|
|||
|
|
``` javascript
|
|||
|
|
/*backtest
|
|||
|
|
start: 2023-10-01 00:00:00
|
|||
|
|
end: 2023-10-13 00:00:00
|
|||
|
|
period: 30m
|
|||
|
|
basePeriod: 15m
|
|||
|
|
exchanges: [{"eid":"Futures_Binance","currency":"BTC_USDT"}]
|
|||
|
|
*/
|
|||
|
|
|
|||
|
|
// This source code is subject to the terms of the Mozilla Public License 2.0 at https://mozilla.org/MPL/2.0/
|
|||
|
|
// © 03.freeman
|
|||
|
|
|
|||
|
|
//@version=4
|
|||
|
|
// strategy("FRAMA strategy", overlay=true,precision=6, initial_capital=1000,calc_on_every_tick=true, pyramiding=0, default_qty_type=strategy.fixed, default_qty_value=10000, currency=currency.EUR)
|
|||
|
|
ma_src = input(title="MA FRAMA Source", type=input.source, defval=close)
|
|||
|
|
ma_frama_len = input(title="MA FRAMA Length", type=input.integer, defval=12)
|
|||
|
|
res = input(title="Resolution", type=input.resolution, defval="1W")
|
|||
|
|
frama_FC = input(defval=1,minval=1, title="* Fractal Adjusted (FRAMA) Only - FC")
|
|||
|
|
frama_SC = input(defval=200,minval=1, title="* Fractal Adjusted (FRAMA) Only - SC")
|
|||
|
|
High = security(syminfo.tickerid, res, high)
|
|||
|
|
Low = security(syminfo.tickerid, res, low)
|
|||
|
|
source = security(syminfo.tickerid, res, ma_src)
|
|||
|
|
enterRule = input(false,title = "Use supertrend for enter")
|
|||
|
|
exitRule = input(false,title = "Use supertrend for exit")
|
|||
|
|
|
|||
|
|
ma(src, len) =>
|
|||
|
|
float result = 0
|
|||
|
|
int len1 = len/2
|
|||
|
|
e = 2.7182818284590452353602874713527
|
|||
|
|
w = log(2/(frama_SC+1)) / log(e) // Natural logarithm (ln(2/(SC+1))) workaround
|
|||
|
|
H1 = highest(High,len1)
|
|||
|
|
L1 = lowest(Low,len1)
|
|||
|
|
N1 = (H1-L1)/len1
|
|||
|
|
H2_ = highest(High,len1)
|
|||
|
|
H2 = H2_[len1]
|
|||
|
|
L2_ = lowest(Low,len1)
|
|||
|
|
L2 = L2_[len1]
|
|||
|
|
N2 = (H2-L2)/len1
|
|||
|
|
H3 = highest(High,len)
|
|||
|
|
L3 = lowest(Low,len)
|
|||
|
|
N3 = (H3-L3)/len
|
|||
|
|
dimen1 = (log(N1+N2)-log(N3))/log(2)
|
|||
|
|
dimen = iff(N1>0 and N2>0 and N3>0,dimen1,nz(dimen1[1]))
|
|||
|
|
alpha1 = exp(w*(dimen-1))
|
|||
|
|
oldalpha = alpha1>1?1:(alpha1<0.01?0.01:alpha1)
|
|||
|
|
oldN = (2-oldalpha)/oldalpha
|
|||
|
|
N = (((frama_SC-frama_FC)*(oldN-1))/(frama_SC-1))+frama_FC
|
|||
|
|
alpha_ = 2/(N+1)
|
|||
|
|
alpha = alpha_<2/(frama_SC+1)?2/(frama_SC+1):(alpha_>1?1:alpha_)
|
|||
|
|
frama = 0.0
|
|||
|
|
frama :=(1-alpha)*nz(frama[1]) + alpha*src
|
|||
|
|
result := frama
|
|||
|
|
result
|
|||
|
|
|
|||
|
|
frama = ma(sma(source,1),ma_frama_len)
|
|||
|
|
signal = ma(frama,ma_frama_len)
|
|||
|
|
plot(frama, color=color.red)
|
|||
|
|
plot(signal, color=color.green)
|
|||
|
|
|
|||
|
|
|
|||
|
|
longCondition = crossover(frama,signal)
|
|||
|
|
shortCondition = crossunder(frama,signal)
|
|||
|
|
|
|||
|
|
Factor=input(3, minval=1,maxval = 100)
|
|||
|
|
Pd=input(7, minval=1,maxval = 100)
|
|||
|
|
|
|||
|
|
|
|||
|
|
Up=hl2-(Factor*atr(Pd))
|
|||
|
|
Dn=hl2+(Factor*atr(Pd))
|
|||
|
|
|
|||
|
|
TrendUp = 0.0
|
|||
|
|
TrendDown = 0.0
|
|||
|
|
Trend = 0.0
|
|||
|
|
Tsl = 0.0
|
|||
|
|
TrendUp :=close[1]>TrendUp[1]? max(Up,TrendUp[1]) : Up
|
|||
|
|
TrendDown :=close[1]<TrendDown[1]? min(Dn,TrendDown[1]) : Dn
|
|||
|
|
|
|||
|
|
Trend := close > TrendDown[1] ? 1: close< TrendUp[1]? -1: nz(Trend[1],1)
|
|||
|
|
Tsl := Trend==1? TrendUp: TrendDown
|
|||
|
|
|
|||
|
|
linecolor = Trend == 1 ? color.green : color.red
|
|||
|
|
|
|||
|
|
//plot(Tsl, color = linecolor , style = plot.style_line , linewidth = 2,title = "SuperTrend")
|
|||
|
|
|
|||
|
|
plotshape(cross(close,Tsl) and close>Tsl , "Up Arrow", shape.triangleup,location.belowbar,color.green,0,0)
|
|||
|
|
plotshape(cross(Tsl,close) and close<Tsl , "Down Arrow", shape.triangledown , location.abovebar, color.red,0,0)
|
|||
|
|
|
|||
|
|
plotarrow(Trend == 1 and Trend[1] == -1 ? Trend : na, title="Up Entry Arrow", colorup=color.lime, maxheight=60, minheight=50, transp=0)
|
|||
|
|
plotarrow(Trend == -1 and Trend[1] == 1 ? Trend : na, title="Down Entry Arrow", colordown=color.red, maxheight=60, minheight=50, transp=0)
|
|||
|
|
|
|||
|
|
|
|||
|
|
// Strategy: (Thanks to JayRogers)
|
|||
|
|
// === STRATEGY RELATED INPUTS ===
|
|||
|
|
//tradeInvert = input(defval = false, title = "Invert Trade Direction?")
|
|||
|
|
// the risk management inputs
|
|||
|
|
inpTakeProfit = input(defval = 0, title = "Take Profit Points", minval = 0)
|
|||
|
|
inpStopLoss = input(defval = 0, title = "Stop Loss Points", minval = 0)
|
|||
|
|
inpTrailStop = input(defval = 0, title = "Trailing Stop Loss Points", minval = 0)
|
|||
|
|
inpTrailOffset = input(defval = 0, title = "Trailing Stop Loss Offset Points", minval = 0)
|
|||
|
|
|
|||
|
|
// === RISK MANAGEMENT VALUE PREP ===
|
|||
|
|
// if an input is less than 1, assuming not wanted so we assign 'na' value to disable it.
|
|||
|
|
useTakeProfit = inpTakeProfit >= 1 ? inpTakeProfit : na
|
|||
|
|
useStopLoss = inpStopLoss >= 1 ? inpStopLoss : na
|
|||
|
|
useTrailStop = inpTrailStop >= 1 ? inpTrailStop : na
|
|||
|
|
useTrailOffset = inpTrailOffset >= 1 ? inpTrailOffset : na
|
|||
|
|
|
|||
|
|
// === STRATEGY - LONG POSITION EXECUTION ===
|
|||
|
|
enterLong() => enterRule? (longCondition and Trend ==1):longCondition // functions can be used to wrap up and work out complex conditions
|
|||
|
|
exitLong() => exitRule and Trend == -1
|
|||
|
|
|
|||
|
|
strategy.entry(id = "Buy", long = true, when = enterLong() ) // use function or simple condition to decide when to get in
|
|||
|
|
strategy.close(id = "Buy", when = exitLong() ) // ...and when to get out
|
|||
|
|
|
|||
|
|
// === STRATEGY - SHORT POSITION EXECUTION ===
|
|||
|
|
enterShort() => enterRule? (shortCondition and Trend ==-1):shortCondition
|
|||
|
|
exitShort() => exitRule and Trend == 1
|
|||
|
|
|
|||
|
|
strategy.entry(id = "Sell", long = false, when = enterShort())
|
|||
|
|
strategy.close(id = "Sell", when = exitShort() )
|
|||
|
|
|
|||
|
|
// === STRATEGY RISK MANAGEMENT EXECUTION ===
|
|||
|
|
// finally, make use of all the earlier values we got prepped
|
|||
|
|
strategy.exit("Exit Buy", from_entry = "Buy", profit = useTakeProfit, loss = useStopLoss, trail_points = useTrailStop, trail_offset = useTrailOffset)
|
|||
|
|
strategy.exit("Exit Sell", from_entry = "Sell", profit = useTakeProfit, loss = useStopLoss, trail_points = useTrailStop, trail_offset = useTrailOffset)
|
|||
|
|
|
|||
|
|
// === Backtesting Dates === thanks to Trost
|
|||
|
|
|
|||
|
|
testPeriodSwitch = input(false, "Custom Backtesting Dates")
|
|||
|
|
testStartYear = input(2020, "Backtest Start Year")
|
|||
|
|
testStartMonth = input(1, "Backtest Start Month")
|
|||
|
|
testStartDay = input(1, "Backtest Start Day")
|
|||
|
|
testStartHour = input(0, "Backtest Start Hour")
|
|||
|
|
testPeriodStart = timestamp(testStartYear,testStartMonth,testStartDay,testStartHour,0)
|
|||
|
|
testStopYear = input(2020, "Backtest Stop Year")
|
|||
|
|
testStopMonth = input(12, "Backtest Stop Month")
|
|||
|
|
testStopDay = input(31, "Backtest Stop Day")
|
|||
|
|
testStopHour = input(23, "Backtest Stop Hour")
|
|||
|
|
testPeriodStop = timestamp(testStopYear,testStopMonth,testStopDay,testStopHour,0)
|
|||
|
|
testPeriod() =>
|
|||
|
|
time >= testPeriodStart and time <= testPeriodStop ? true : false
|
|||
|
|
isPeriod = true
|
|||
|
|
// === /END
|
|||
|
|
|
|||
|
|
if not isPeriod
|
|||
|
|
strategy.cancel_all()
|
|||
|
|
strategy.close_all()
|
|||
|
|
```
|
|||
|
|
|
|||
|
|
> Detail
|
|||
|
|
|
|||
|
|
https://www.fmz.com/strategy/429778
|
|||
|
|
|
|||
|
|
> Last Modified
|
|||
|
|
|
|||
|
|
2023-10-20 16:50:01
|