189 lines
7.2 KiB
Markdown
189 lines
7.2 KiB
Markdown

|
|
||
|
|
> Name
|
||
|
|
|
||
|
|
唐奇安通道带跟踪止损策略Donchian-Channel-With-Trailing-Stop-Loss-Strategy
|
||
|
|
|
||
|
|
> Author
|
||
|
|
|
||
|
|
ChaoZhang
|
||
|
|
|
||
|
|
> Strategy Description
|
||
|
|
|
||
|
|
|
||
|
|
|
||
|
|
[trans]
|
||
|
|
|
||
|
|
## 概述
|
||
|
|
|
||
|
|
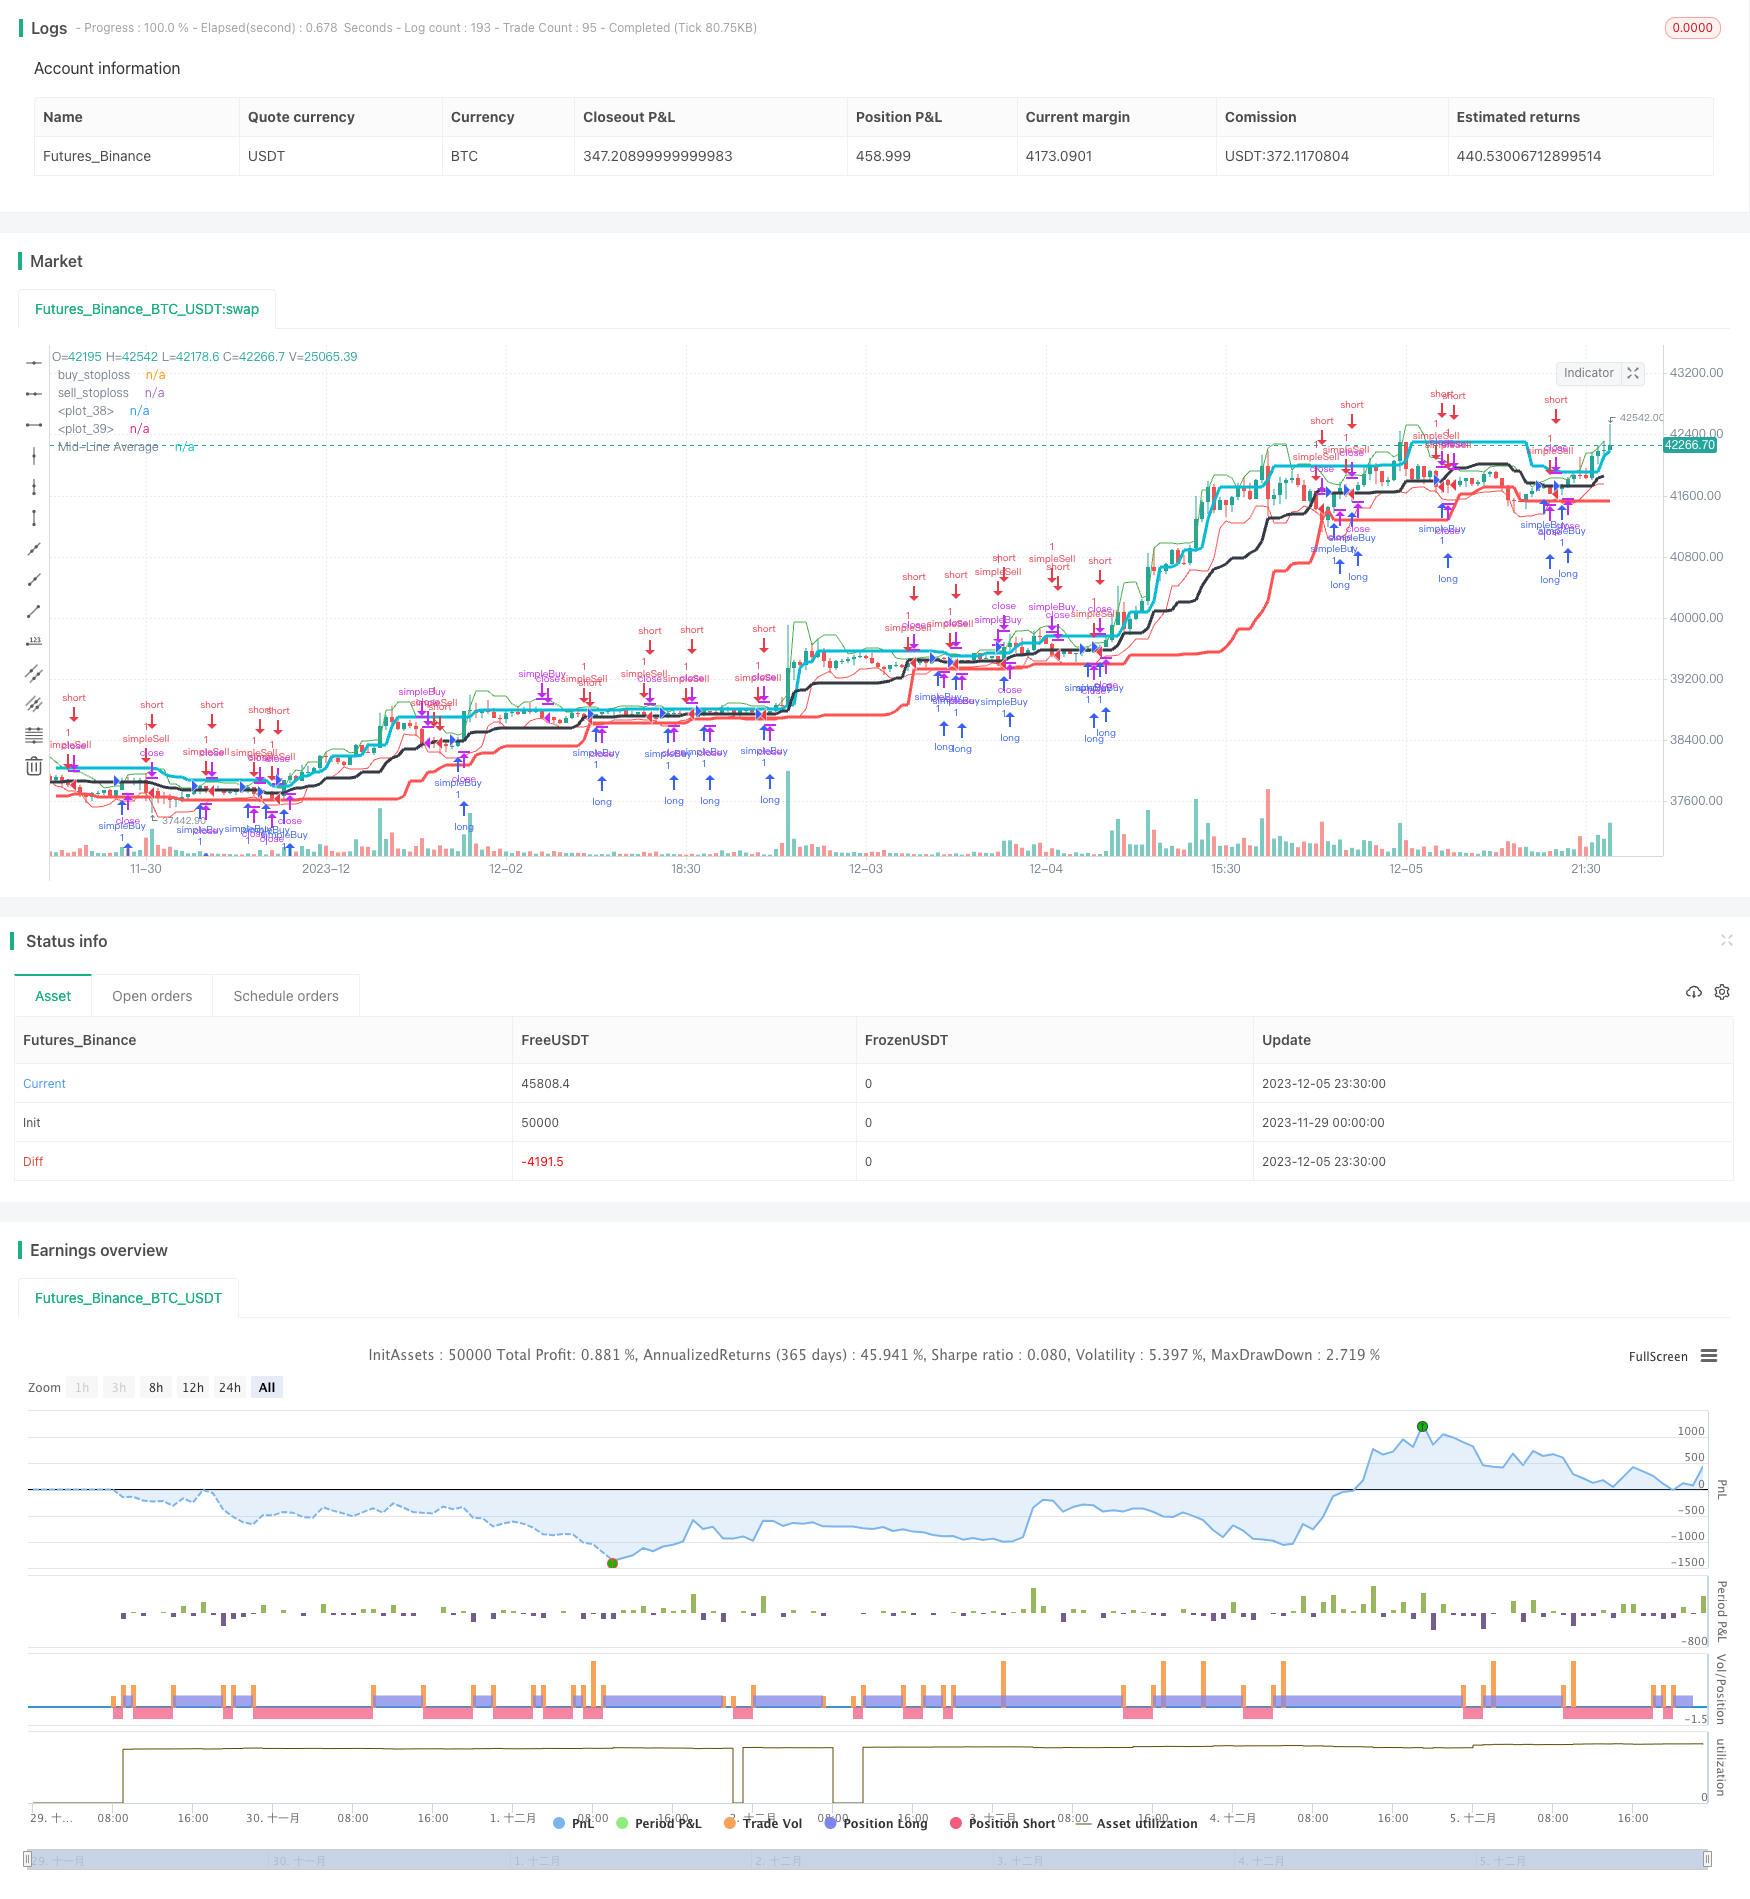
该策略是基于唐奇安通道指标的趋势跟随策略,结合ATR指标的动态止损来锁定利润,属于趋势跟随类策略。
|
||
|
|
|
||
|
|
## 策略原理
|
||
|
|
|
||
|
|
该策略使用长度为20周期的唐奇安通道指标,通道中线为最高价和最低价的平均值。当价格上穿通道中线时做多,当价格下穿通道中线时做空。平仓条件是价格触碰动态止损线,止损线的计算是最近3根K线的最低价减去ATR指标值的三分之一作为做多止损,最近3根K线的最高价加上ATR指标值的三分之一作为做空止损。
|
||
|
|
|
||
|
|
## 优势分析
|
||
|
|
|
||
|
|
该策略主要具有以下优势:
|
||
|
|
|
||
|
|
1. 使用唐奇安通道判断市场趋势方向,能够有效捕捉趋势
|
||
|
|
2. 结合ATR动态跟踪止损,可以在保证盈利的同时有效控制风险
|
||
|
|
3. 计算止损线时加入ATR因子,将市场波动性考虑进去,止损更加合理
|
||
|
|
4. 止损线的计算方式比较稳定可靠,避免止损过于接近,减少止损被追究的概率
|
||
|
|
|
||
|
|
## 风险分析
|
||
|
|
|
||
|
|
该策略主要存在以下风险:
|
||
|
|
|
||
|
|
1. 唐奇安通道具有一定的滞后性,可能错过短线机会
|
||
|
|
2. ATR参数设置不当可能导致止损过于宽松或过于接近
|
||
|
|
3. 趋势判断机制相对简单,在盘整市场中可能出现较多错误信号
|
||
|
|
4. 缺乏有效的支持阻力判断机制,进入市场的时机选择可能不当
|
||
|
|
|
||
|
|
## 优化方向
|
||
|
|
|
||
|
|
该策略可以从以下几个方面进行优化:
|
||
|
|
|
||
|
|
1. 增加其他指标判断,避免在没有明确趋势的市场中频繁交易
|
||
|
|
2. 增加支持阻力位判断,优化入场时机
|
||
|
|
3. 尝试其他动态止损计算方式,进一步优化止损策略
|
||
|
|
4. 测试不同唐奇安通道周期参数对策略效果的影响
|
||
|
|
5. 加入交易量或增量等过滤条件,减少误入错信号
|
||
|
|
|
||
|
|
## 总结
|
||
|
|
|
||
|
|
该策略整体来说属于简单实用型趋势跟随策略,通过唐奇安通道判断趋势方向,并使用动态止损来锁定利润,可有效跟踪趋势capturing。策略实用性较强,但可进一步通过多种方式进行优化,使策略在更复杂的市场环境中仍能保持稳定收益。
|
||
|
|
|
||
|
|
||
|
||
|
|
|
||
|
|
|
||
|
|
## Overview
|
||
|
|
|
||
|
|
This is a trend following strategy based on the Donchian Channel indicator, combined with dynamic stop loss based on the ATR indicator to lock in profits. It belongs to the trend following strategy category.
|
||
|
|
|
||
|
|
## Strategy Logic
|
||
|
|
|
||
|
|
The strategy uses a 20-period Donchian Channel, where the channel midline is the average of the highest high and lowest low. It goes long when price crosses above the channel midline and goes short when price crosses below the midline. The exit rule is when price touches the dynamic stop loss line, which is calculated as the lowest low of the recent 3 bars minus one third of the ATR value for long positions, and highest high of recent 3 bars plus one third of the ATR value for short positions.
|
||
|
|
|
||
|
|
## Advantage Analysis
|
||
|
|
|
||
|
|
The main advantages of this strategy are:
|
||
|
|
|
||
|
|
1. Donchian Channel is effective in identifying market trend directions and catching trends.
|
||
|
|
2. The dynamic trailing stop loss based on ATR locks in profits while controlling risks.
|
||
|
|
3. Incorporating ATR factor into stop loss calculation takes market volatility into consideration, making the stop more reasonable.
|
||
|
|
4. The stop loss calculation method is stable and reliable, avoiding stops being too close and getting stopped out prematurely.
|
||
|
|
|
||
|
|
## Risk Analysis
|
||
|
|
|
||
|
|
The main risks of this strategy include:
|
||
|
|
|
||
|
|
1. Donchian Channel has some lagging effect, which may miss short-term opportunities.
|
||
|
|
2. Improper ATR parameter setting may lead to stop loss being too wide or too close.
|
||
|
|
3. Trend determination mechanism is relatively simple, which may generate more false signals during market consolidations.
|
||
|
|
4. Lack of effective support/resistance judgment, resulting in improper market entry timing.
|
||
|
|
|
||
|
|
## Optimization Directions
|
||
|
|
|
||
|
|
Some optimization directions for this strategy:
|
||
|
|
|
||
|
|
1. Add other indicators to avoid frequent trading when there is no clear trend.
|
||
|
|
2. Add support/resistance judgment to optimize entry timing.
|
||
|
|
3. Test other dynamic stop loss calculation methods to further optimize the stop loss strategy.
|
||
|
|
4. Test the effects of different Donchian Channel period parameters on strategy performance.
|
||
|
|
5. Add filters on volume or increments to reduce false signals.
|
||
|
|
|
||
|
|
## Conclusion
|
||
|
|
|
||
|
|
In summary, this is a simple and practical trend following strategy. It identifies trend direction via Donchian Channel and locks in profits with dynamic trailing stop loss, which can effectively follow trends. The strategy is quite practical to use, but can be further optimized in various ways for better performance in more complex market environments.
|
||
|
|
|
||
|
|
[/trans]
|
||
|
|
|
||
|
|
> Strategy Arguments
|
||
|
|
|
||
|
|
|
||
|
|
|
||
|
|
|Argument|Default|Description|
|
||
|
|
|----|----|----|
|
||
|
|
|v_input_1|20|ATR Length:|
|
||
|
|
|v_input_2|2017|Backtest Start Year|
|
||
|
|
|v_input_3|true|Backtest Start Month|
|
||
|
|
|v_input_4|true|Backtest Start Day|
|
||
|
|
|v_input_5|2018|Backtest Start Year|
|
||
|
|
|v_input_6|12|testEndMonth|
|
||
|
|
|v_input_7|31|Backtest Start Day|
|
||
|
|
|v_input_8|20|Period|
|
||
|
|
|
||
|
|
|
||
|
|
> Source (PineScript)
|
||
|
|
|
||
|
|
``` javascript
|
||
|
|
/*backtest
|
||
|
|
start: 2023-11-29 00:00:00
|
||
|
|
end: 2023-12-06 00:00:00
|
||
|
|
period: 30m
|
||
|
|
basePeriod: 15m
|
||
|
|
exchanges: [{"eid":"Futures_Binance","currency":"BTC_USDT"}]
|
||
|
|
*/
|
||
|
|
|
||
|
|
//@version=4
|
||
|
|
strategy(title = "dc", overlay = true)
|
||
|
|
atrLength = input(title="ATR Length:", defval=20, minval=1)
|
||
|
|
|
||
|
|
testStartYear = input(2017, "Backtest Start Year")
|
||
|
|
testStartMonth = input(1, "Backtest Start Month")
|
||
|
|
testStartDay = input(1, "Backtest Start Day")
|
||
|
|
testPeriodStart = timestamp(testStartYear,testStartMonth,testStartDay,0,0)
|
||
|
|
|
||
|
|
testEndYear = input(2018, "Backtest Start Year")
|
||
|
|
testEndMonth = input(12)
|
||
|
|
testEndDay = input(31, "Backtest Start Day")
|
||
|
|
testPeriodEnd = timestamp(testEndYear,testEndMonth,testEndDay,0,0)
|
||
|
|
|
||
|
|
|
||
|
|
testPeriod() =>
|
||
|
|
true
|
||
|
|
//time >= testPeriodStart ? true : false
|
||
|
|
|
||
|
|
dcPeriod = input(20, "Period")
|
||
|
|
|
||
|
|
dcUpper = highest(close, dcPeriod)[1]
|
||
|
|
dcLower = lowest(close, dcPeriod)[1]
|
||
|
|
dcAverage = (dcUpper + dcLower) / 2
|
||
|
|
atrValue=atr(atrLength)
|
||
|
|
|
||
|
|
|
||
|
|
useTakeProfit = na
|
||
|
|
useStopLoss = na
|
||
|
|
useTrailStop = na
|
||
|
|
useTrailOffset = na
|
||
|
|
//@version=1
|
||
|
|
Buy_stop = lowest(low[1],3) - atr(20)[1] / 3
|
||
|
|
plot(Buy_stop, color=red, title="buy_stoploss")
|
||
|
|
Sell_stop = highest(high[1],3) + atr(20)[1] / 3
|
||
|
|
plot(Sell_stop, color=green, title="sell_stoploss")
|
||
|
|
|
||
|
|
plot(dcLower, style=line, linewidth=3, color=red, offset=1)
|
||
|
|
plot(dcUpper, style=line, linewidth=3, color=aqua, offset=1)
|
||
|
|
|
||
|
|
plot(dcAverage, color=black, style=line, linewidth=3, title="Mid-Line Average")
|
||
|
|
|
||
|
|
strategy.entry("simpleBuy", strategy.long, when=(close > dcAverage) and cross(close,dcAverage))
|
||
|
|
strategy.close("simpleBuy",when= ( close< Buy_stop))
|
||
|
|
|
||
|
|
strategy.entry("simpleSell", strategy.short,when=(close < dcAverage) and cross(close,dcAverage) )
|
||
|
|
strategy.close("simpleSell",when=( close > Sell_stop))
|
||
|
|
|
||
|
|
//strategy.exit("Exit simpleBuy", from_entry = "simpleBuy", profit = useTakeProfit, loss = useStopLoss, trail_points = useTrailStop, trail_offset = useTrailOffset)
|
||
|
|
//strategy.exit("Exit simpleSell", from_entry = "simpleSell", profit = useTakeProfit, loss = useStopLoss, trail_points = useTrailStop, trail_offset = useTrailOffset)
|
||
|
|
|
||
|
|
|
||
|
|
```
|
||
|
|
|
||
|
|
> Detail
|
||
|
|
|
||
|
|
https://www.fmz.com/strategy/434585
|
||
|
|
|
||
|
|
> Last Modified
|
||
|
|
|
||
|
|
2023-12-07 16:53:10
|