293 lines
10 KiB
Markdown
293 lines
10 KiB
Markdown

|
|
||
|
|
> Name
|
||
|
|
|
||
|
|
双均线RSI指标组合反转策略Dual-Moving-Average-RSI-Indicator-Combination-Reversal-Strategy
|
||
|
|
|
||
|
|
> Author
|
||
|
|
|
||
|
|
ChaoZhang
|
||
|
|
|
||
|
|
> Strategy Description
|
||
|
|
|
||
|
|
|
||
|
|
[trans]
|
||
|
|
|
||
|
|
|
||
|
|
## 概述
|
||
|
|
|
||
|
|
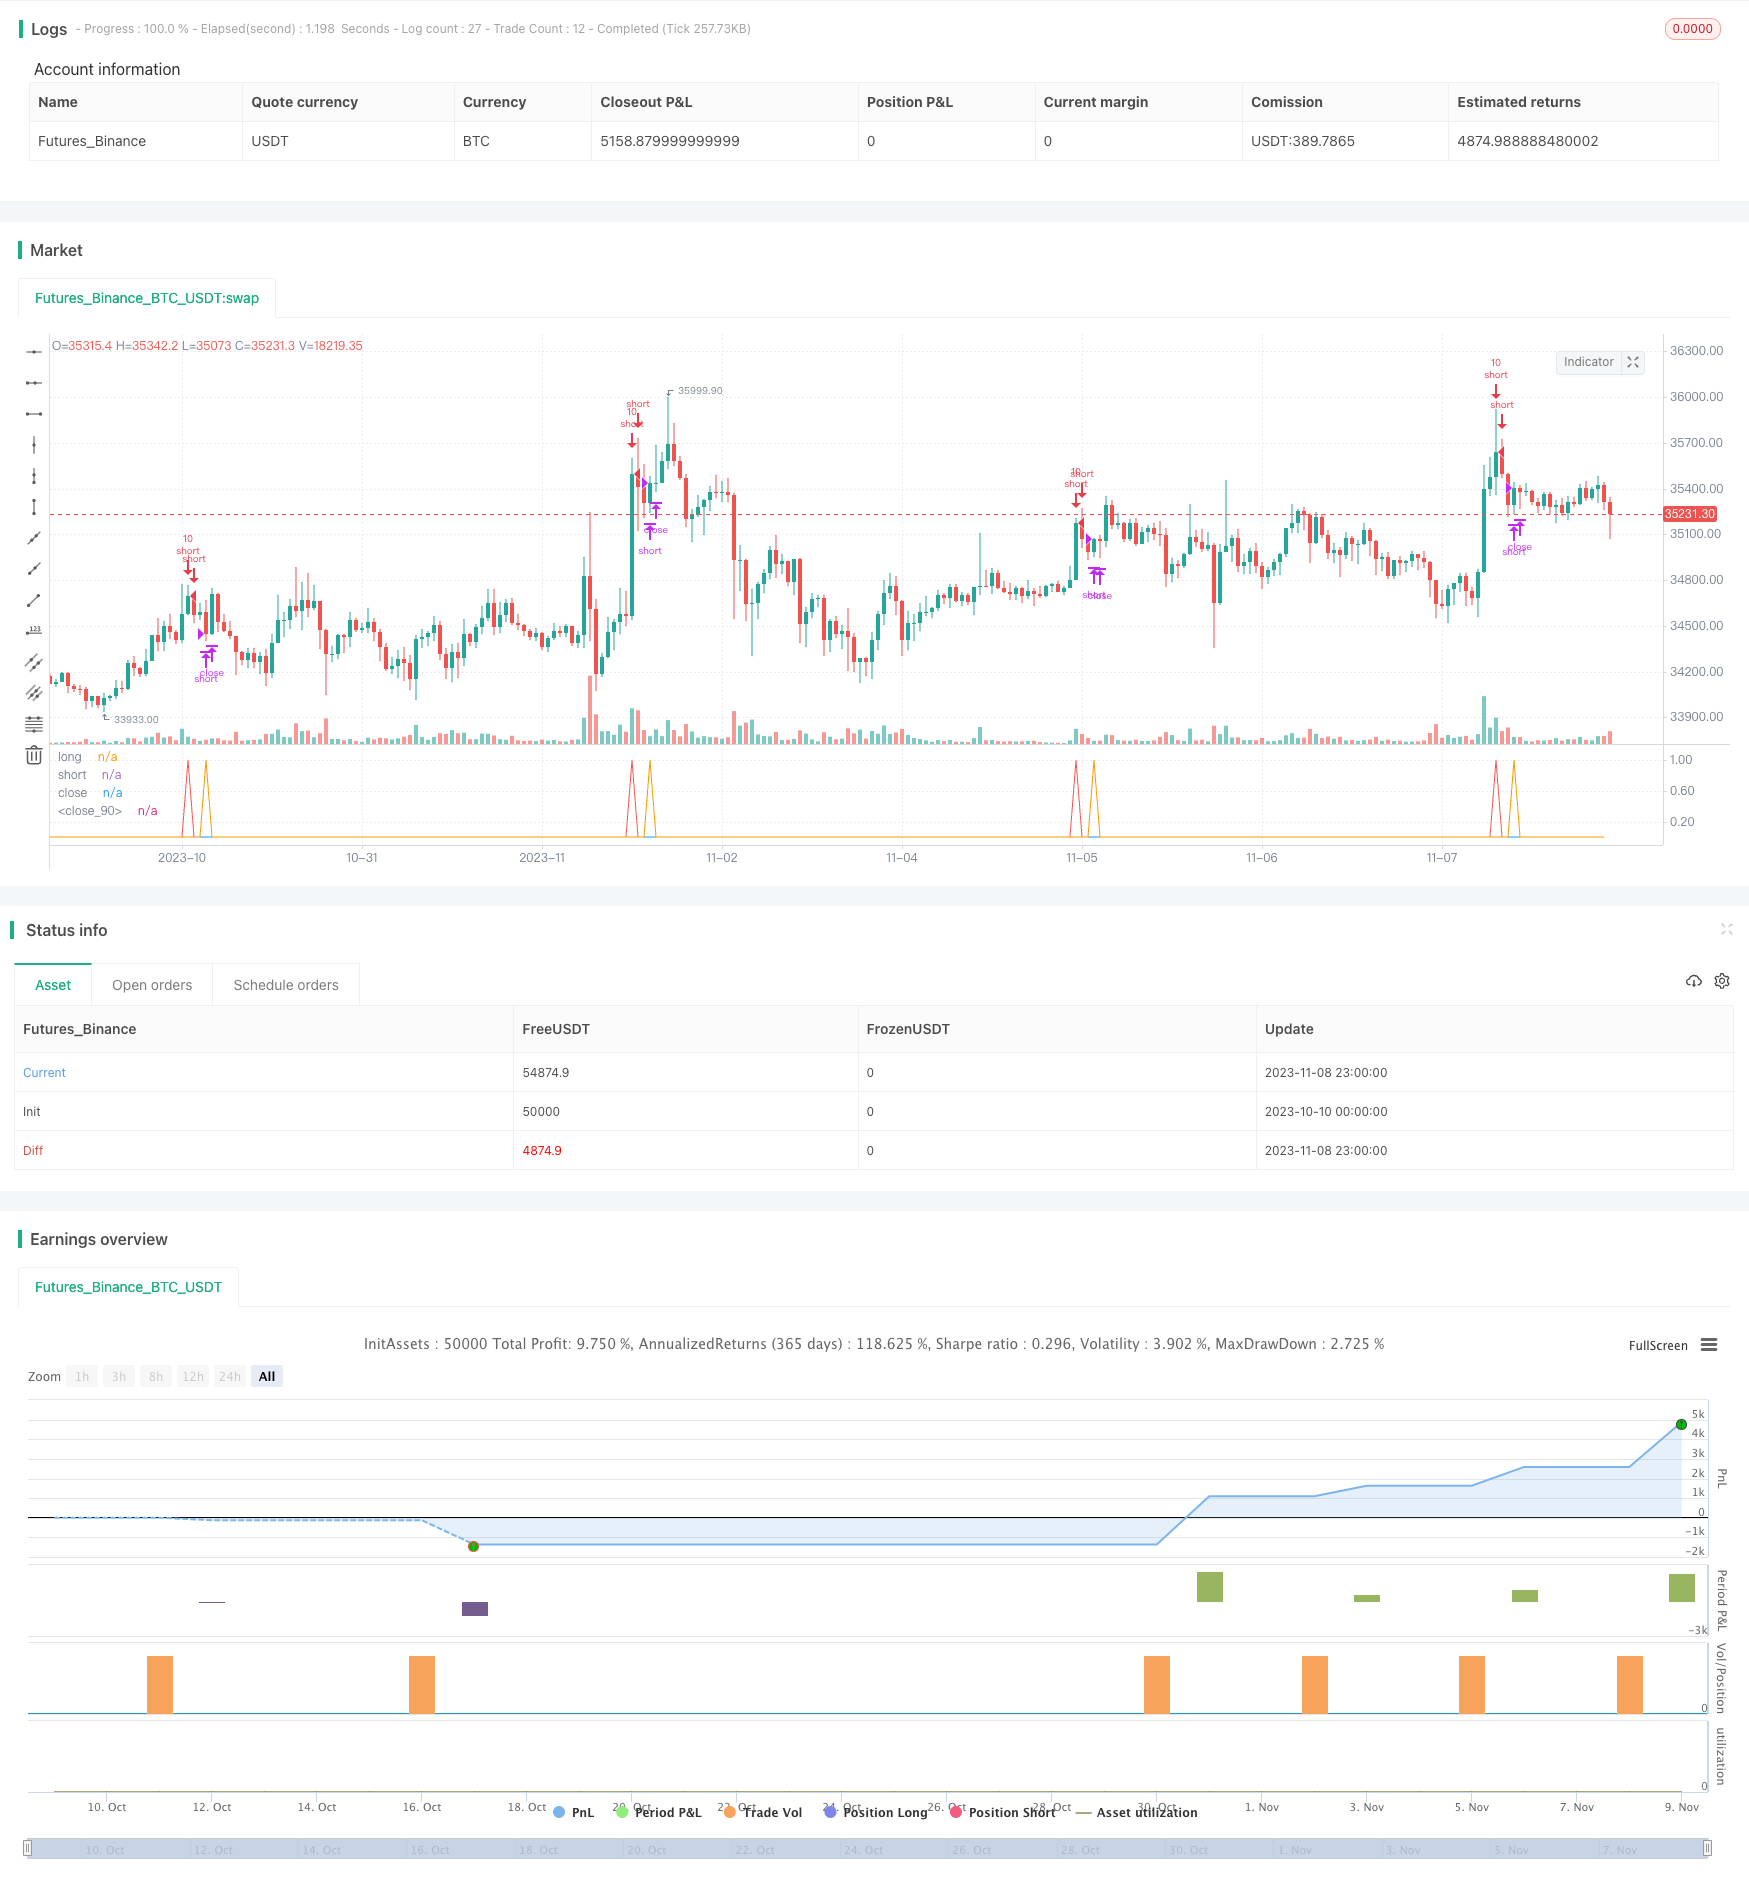
本策略通过组合使用双均线、相对强弱指标(RSI)以及抛物线指标(PSAR),实现对价格反转点的判断,在反转点发生时进行买入和卖出操作,属于反转交易策略。
|
||
|
|
|
||
|
|
## 原理
|
||
|
|
|
||
|
|
本策略主要通过以下技术指标判断价格反转点:
|
||
|
|
|
||
|
|
1. 双均线: 计算快速移动均线(MA快线)和慢速移动均线(MA慢线)。当快线上穿慢线时,判断为多头市场,做多;当快线下穿慢线时,判断为空头市场,做空。
|
||
|
|
|
||
|
|
2. RSI指标:RSI通过计算一段时间内的平均收盘涨幅和平均收盘跌幅,来判断超买超卖状况。RSI大于70时为超买区,小于30时为超卖区。
|
||
|
|
|
||
|
|
3. PSAR指标:抛物线SAR指标判断趋势的方向。SAR点下方为多头市场,上方为空头市场。
|
||
|
|
|
||
|
|
4. ADX指标:ADX通过计算价格变动的方向性强度,判断趋势的力度。ADX值大于20表示趋势行情,小于20表示盘整。
|
||
|
|
|
||
|
|
根据以上指标判断买入和卖出信号的逻辑如下:
|
||
|
|
|
||
|
|
买入信号:快线上穿慢线,RSI小于30(超卖区),SAR点在价格上方,ADX大于20,发出买入信号。
|
||
|
|
|
||
|
|
卖出信号:快线下穿慢线,RSI大于70(超买区),SAR点在价格下方,ADX大于20,发出卖出信号。
|
||
|
|
|
||
|
|
当发生买入和卖出信号时,分别以10%的仓位建立多仓和空仓。当反转信号失效时,及时止损平仓。
|
||
|
|
|
||
|
|
## 优势
|
||
|
|
|
||
|
|
- 使用双均线判断大趋势方向,又加入RSI和SAR等指标滤除错误信号,可以比较准确地判断反转点。
|
||
|
|
|
||
|
|
- 采用多种指标组合判断,避免单一技术指标造成的错误信号。
|
||
|
|
|
||
|
|
- 设置止损条件,可以有效控制风险。
|
||
|
|
|
||
|
|
- 策略操作简单清晰,容易实施。
|
||
|
|
|
||
|
|
- 该策略对市场涨跌都有应对方案,可适用于不同行情。
|
||
|
|
|
||
|
|
## 风险及解决
|
||
|
|
|
||
|
|
- 双均线生成空头信号时,行情可能出现假破,需要结合其他指标进行判断。可适当拉长均线周期,或加入布林带指标判断突破的真伪。
|
||
|
|
|
||
|
|
- RSI指标因参数设置不当可能产生错误信号。应适当调整RSI参数,同时加入其他指标确认RSI信号。
|
||
|
|
|
||
|
|
- ADX值低于20时,应暂停交易,避免无方向性市场的反转交易。或适当降低ADX的周期参数。
|
||
|
|
|
||
|
|
- SetStringry止损点设置过小,可能造成无谓止损。应根据市场波动程度合理设置止损点。
|
||
|
|
|
||
|
|
- 交易频率可能过高,可适当调整双均线周期,降低交易频率。
|
||
|
|
|
||
|
|
## 优化方向
|
||
|
|
|
||
|
|
- 测试不同长度周期的均线组合,寻找最佳参数。
|
||
|
|
|
||
|
|
- 测试RSI的不同参数设置,优化超买超卖判断。
|
||
|
|
|
||
|
|
- 尝试加入其他指标,如布林带、KDJ等,丰富买卖信号的判断逻辑。
|
||
|
|
|
||
|
|
- 根据不同品种和市场情况设置动态止损机制。
|
||
|
|
|
||
|
|
- 添加仓位管理策略,让盈利能更好地跟踪趋势。
|
||
|
|
|
||
|
|
- 测试不同ADX参数,找到最佳判定趋势力度的数值。
|
||
|
|
|
||
|
|
- 加入自动止损模块,让策略可以自动止损。
|
||
|
|
|
||
|
|
## 总结
|
||
|
|
|
||
|
|
本策略通过双均线判断大方向,结合RSI、SAR等指标进行反转信号过滤,在优化参数设定后,可以有效判断价格反转点,从而在反转前后捕捉趋势。在实盘中应注意控制风险,合理设置止损条件,并继续优化参数,使策略更稳定和利润更高。总体来说,该策略交叉指标结合使用,思路清晰易操作,属于一种可靠的反转交易策略。
|
||
|
|
|
||
|
|
||
|
||
|
|
|
||
|
|
## Overview
|
||
|
|
|
||
|
|
This strategy combines dual moving average, relative strength index (RSI) and parabolic SAR (PSAR) to identify price reversal points and make buy and sell decisions accordingly. It belongs to reversal trading strategies.
|
||
|
|
|
||
|
|
## Principles
|
||
|
|
|
||
|
|
The strategy mainly uses the following technical indicators to determine price reversal points:
|
||
|
|
|
||
|
|
1. Dual Moving Average: Calculate fast moving average (MA fast line) and slow moving average (MA slow line). When the fast line crosses above the slow line, it indicates a bull market and goes long. When the fast line crosses below the slow line, it indicates a bear market and goes short.
|
||
|
|
|
||
|
|
2. RSI Indicator: RSI judges overbought and oversold conditions by calculating the average closing gain and average closing loss over a period of time. RSI above 70 indicates overbought zone and below 30 indicates oversold zone.
|
||
|
|
|
||
|
|
3. PSAR Indicator: Parabolic SAR indicates the trend direction. SAR points below price indicate bull market and above price indicate bear market.
|
||
|
|
|
||
|
|
4. ADX Indicator: ADX measures the strength of a trend by calculating the directional movement. ADX above 20 signals a trending market and below 20 signals consolidation.
|
||
|
|
|
||
|
|
The logic for buy and sell signals is as follows:
|
||
|
|
|
||
|
|
Buy Signal: Fast MA crosses above slow MA, RSI below 30 (oversold), SAR points above price, ADX above 20.
|
||
|
|
|
||
|
|
Sell Signal: Fast MA crosses below slow MA, RSI above 70 (overbought), SAR points below price, ADX above 20.
|
||
|
|
|
||
|
|
When buy or sell signal occurs, take a position with 10% of equity respectively. Close position timely when reversal signal fails.
|
||
|
|
|
||
|
|
## Advantages
|
||
|
|
|
||
|
|
- Dual MAs determine major trend direction, with RSI and SAR filtering false signals, which can accurately identify reversal points.
|
||
|
|
|
||
|
|
- Combining multiple indicators prevents wrong signals from a single indicator.
|
||
|
|
|
||
|
|
- Stop loss avoids excessive risks.
|
||
|
|
|
||
|
|
- Simple and clear logic makes it easy to implement.
|
||
|
|
|
||
|
|
- It works for both uptrend and downtrend.
|
||
|
|
|
||
|
|
## Risks and Solutions
|
||
|
|
|
||
|
|
- Dual MAs may have false breakout. Consider longer MA periods or adding Bollinger Bands to confirm true breakout.
|
||
|
|
|
||
|
|
- RSI may generate wrong signals if not properly set. Fine tune RSI parameters and add other indicators to confirm RSI signals.
|
||
|
|
|
||
|
|
- Suspend trading when ADX is below 20 to avoid reversal trading in directionless markets. Or shorten ADX period.
|
||
|
|
|
||
|
|
- SetStringry stop loss may cause unnecessary loss. Set reasonable stop loss based on market volatility.
|
||
|
|
|
||
|
|
- High trading frequency. Adjust MA periods to lower trading frequency.
|
||
|
|
|
||
|
|
## Improvement
|
||
|
|
|
||
|
|
- Test different MA periods to find the optimal combination.
|
||
|
|
|
||
|
|
- Test different RSI parameters for better overbought/oversold judgement.
|
||
|
|
|
||
|
|
- Add other indicators like Bollinger Bands, KDJ to enrich logic.
|
||
|
|
|
||
|
|
- Set dynamic stop loss based on different products and markets.
|
||
|
|
|
||
|
|
- Add position sizing to better follow trends.
|
||
|
|
|
||
|
|
- Test different ADX parameters to find the best value to determine trend strength.
|
||
|
|
|
||
|
|
- Add auto stop loss function.
|
||
|
|
|
||
|
|
## Conclusion
|
||
|
|
|
||
|
|
This strategy identifies major trend direction using dual MAs, and uses RSI, SAR for additional signal filtering. It can effectively determine reversal points after parameter optimization, and catch trends around reversals. In practice, risk management by proper stop loss, and ongoing parameter optimization are important. Overall, the strategy combines indicators with clear logic and easy operation, making it a reliable reversal trading strategy.
|
||
|
|
|
||
|
|
[/trans]
|
||
|
|
|
||
|
|
> Strategy Arguments
|
||
|
|
|
||
|
|
|
||
|
|
|
||
|
|
|Argument|Default|Description|
|
||
|
|
|----|----|----|
|
||
|
|
|v_input_1|0.02|start|
|
||
|
|
|v_input_2|0.02|increment|
|
||
|
|
|v_input_3|0.2|maximum|
|
||
|
|
|v_input_4|30|ADX Smoothing|
|
||
|
|
|v_input_5|30|DI Length|
|
||
|
|
|v_input_6|50|length|
|
||
|
|
|v_input_7|0.5|Mult Factor|
|
||
|
|
|v_input_8|0.1|alertLevel|
|
||
|
|
|v_input_9|0.75|impulseLevel|
|
||
|
|
|v_input_10|false|showRange|
|
||
|
|
|
||
|
|
|
||
|
|
> Source (PineScript)
|
||
|
|
|
||
|
|
``` javascript
|
||
|
|
/*backtest
|
||
|
|
start: 2023-10-10 00:00:00
|
||
|
|
end: 2023-11-09 00:00:00
|
||
|
|
period: 1h
|
||
|
|
basePeriod: 15m
|
||
|
|
exchanges: [{"eid":"Futures_Binance","currency":"BTC_USDT"}]
|
||
|
|
*/
|
||
|
|
|
||
|
|
//@version=2
|
||
|
|
//Based on Senpai BO 3
|
||
|
|
strategy(title="Senpai_Strat_3", shorttitle="Senpai_Strat_3", overlay=false, default_qty_type=strategy.percent_of_equity, default_qty_value=100)
|
||
|
|
src = close
|
||
|
|
|
||
|
|
//psar
|
||
|
|
start = input(0.02)
|
||
|
|
increment = input(0.02)
|
||
|
|
maximum = input(0.2)
|
||
|
|
psar = sar(start, increment, maximum)
|
||
|
|
|
||
|
|
|
||
|
|
//ADX Init
|
||
|
|
adxlen = input(30, title="ADX Smoothing")
|
||
|
|
dilen = input(30, title="DI Length")
|
||
|
|
dirmov(len) =>
|
||
|
|
up = change(high)
|
||
|
|
down = -change(low)
|
||
|
|
truerange = rma(tr, len)
|
||
|
|
plus = fixnan(100 * rma(up > down and up > 0 ? up : 0, len) / truerange)
|
||
|
|
minus = fixnan(100 * rma(down > up and down > 0 ? down : 0, len) / truerange)
|
||
|
|
[plus, minus]
|
||
|
|
|
||
|
|
adx(dilen, adxlen) =>
|
||
|
|
[plus, minus] = dirmov(dilen)
|
||
|
|
sum = plus + minus
|
||
|
|
adx = 100 * rma(abs(plus - minus) / (sum == 0 ? 1 : sum), adxlen)
|
||
|
|
[adx, plus, minus]
|
||
|
|
|
||
|
|
[sig, up, down] = adx(dilen, adxlen)
|
||
|
|
|
||
|
|
|
||
|
|
// BB Init
|
||
|
|
source = close
|
||
|
|
length = input(50, minval=1)
|
||
|
|
mult = input(0.5, title="Mult Factor", minval=0.001, maxval=50)
|
||
|
|
alertLevel=input(0.1)
|
||
|
|
impulseLevel=input(0.75)
|
||
|
|
showRange = input(false, type=bool)
|
||
|
|
|
||
|
|
|
||
|
|
//RSI CODE
|
||
|
|
up1 = rma(max(change(src), 0), 14)
|
||
|
|
down1 = rma(-min(change(src), 0), 14)
|
||
|
|
rsi = down1 == 0 ? 100 : up == 0 ? 0 : 100 - (100 / (1 + up1 / down1))
|
||
|
|
|
||
|
|
|
||
|
|
//BB CODE
|
||
|
|
basis = sma(source, length)
|
||
|
|
dev = mult * stdev(source, length)
|
||
|
|
upper = basis + dev
|
||
|
|
lower = basis - dev
|
||
|
|
bbr = source>upper?(((source-upper)/(upper-lower))/10): source<lower?(((source-lower)/(upper-lower))/10) : 0.05
|
||
|
|
bbi = bbr - nz(bbr[1])
|
||
|
|
|
||
|
|
//////////////////// Algo
|
||
|
|
|
||
|
|
//if (rsi>50 and n1>n2)
|
||
|
|
//strategy.exit("Close", "Short")
|
||
|
|
// strategy.entry("Long", strategy.long)
|
||
|
|
//if (rsi<50 and n2>n1)
|
||
|
|
//strategy.exit("Close", "Long")
|
||
|
|
// strategy.entry("Short", strategy.short)
|
||
|
|
|
||
|
|
//col = ma30 > ma50 > ma200 and rsi <=53?lime: ma50 < ma200 and rsi >= 60?red : silver
|
||
|
|
//short1 = sig<18.5 and high>=upper and rsi>=70 and psar<close = 100%
|
||
|
|
//long1 = sig<18.5 and low<=lower and rsi<=30 and psar>close = 100%
|
||
|
|
short1 = sig<18.5 and high>=upper and rsi>=70 and psar<close
|
||
|
|
long1 = sig<18.5 and low<=lower and rsi<=30 and psar>close
|
||
|
|
|
||
|
|
//Entry
|
||
|
|
|
||
|
|
long = long1[1] == 0 and long1 == 1
|
||
|
|
short = short1[1] == 0 and short1 == 1
|
||
|
|
longclose = long[3] == 1
|
||
|
|
shortclose = short[3] == 1
|
||
|
|
strategy.entry("short", strategy.short,qty = 10, when=short)
|
||
|
|
strategy.entry("long", strategy.long,qty=10, when=long)
|
||
|
|
strategy.close("long",when=longclose)
|
||
|
|
strategy.close("short",when=shortclose)
|
||
|
|
|
||
|
|
|
||
|
|
|
||
|
|
/////////////////////
|
||
|
|
///PLOT
|
||
|
|
|
||
|
|
plot(long,"long",color=green,linewidth=1)
|
||
|
|
plot(short,"short",color=red,linewidth=1)
|
||
|
|
plot(longclose,"close",color=blue,linewidth=1)
|
||
|
|
plot(shortclose,"close",color=orange,linewidth=1)
|
||
|
|
|
||
|
|
|
||
|
|
//plot(short,"short",color=red,linewidth=1)
|
||
|
|
//
|
||
|
|
|
||
|
|
//strategy.exit(id="long",qty = 100000,when=longclose)
|
||
|
|
//strategy.exit(id="short",qty = 100000,when=shortclose)
|
||
|
|
|
||
|
|
//strategy.exit(id="Stop", profit = 20, loss = 100)
|
||
|
|
```
|
||
|
|
|
||
|
|
> Detail
|
||
|
|
|
||
|
|
https://www.fmz.com/strategy/431693
|
||
|
|
|
||
|
|
> Last Modified
|
||
|
|
|
||
|
|
2023-11-10 18:01:09
|