133 lines
8.0 KiB
Markdown
133 lines
8.0 KiB
Markdown

|
|
||
|
|
> Name
|
||
|
|
|
||
|
|
SUPERTREND趋势追踪型多头止盈止损策略SUPERTREND-Trend-following-Long-Position-with-Stop-loss-and-Take-profit-Strategy
|
||
|
|
|
||
|
|
> Author
|
||
|
|
|
||
|
|
ChaoZhang
|
||
|
|
|
||
|
|
> Strategy Description
|
||
|
|
|
||
|
|
|
||
|
|
|
||
|
|
[trans]
|
||
|
|
#### 概述
|
||
|
|
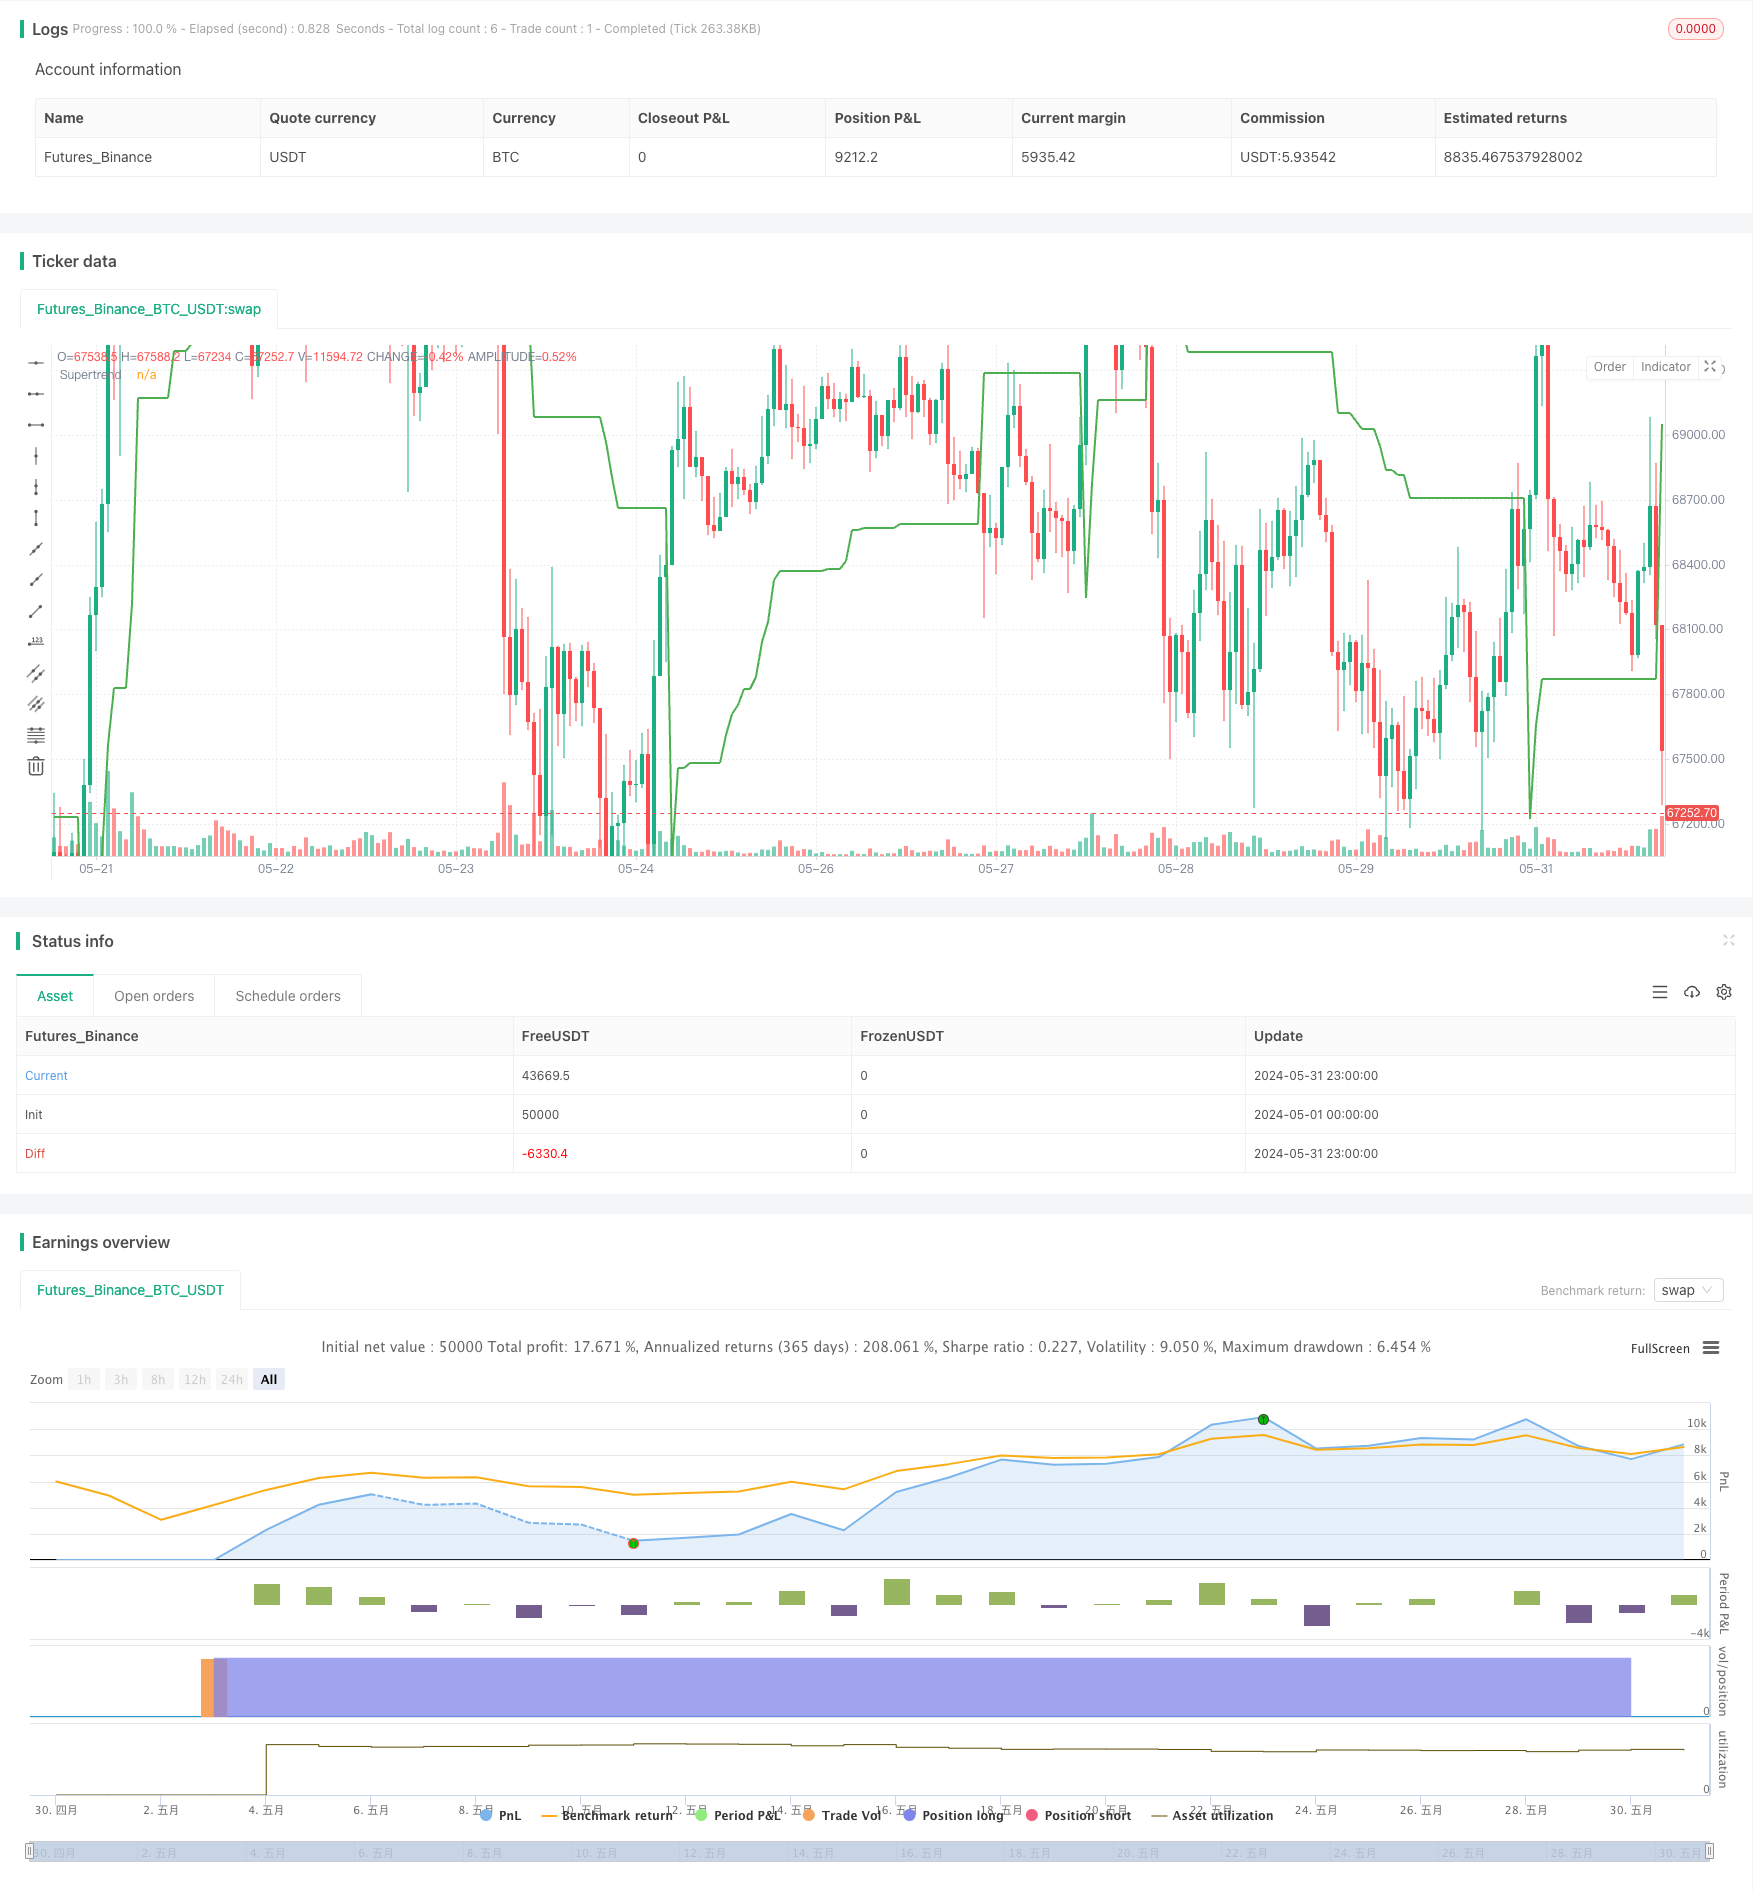
这个策略使用Supertrend指标来确定交易的入场和出场时机。Supertrend是一个趋势跟踪指标,它结合了动态支撑阻力和价格突破的概念。该策略旨在捕捉强劲的上升趋势,同时严格控制风险,并以1:5的风险回报比进行交易。当价格突破Supertrend上轨时开仓做多,并根据预设的风险回报比设置止损和止盈价格。一旦价格跌破Supertrend下轨,策略就会平掉多头仓位。
|
||
|
|
|
||
|
|
#### 策略原理
|
||
|
|
1. 计算Supertrend指标的上轨和下轨。Supertrend使用ATR(平均真实波幅)和因子来计算动态支撑位和阻力位。
|
||
|
|
2. 检查多头开仓条件:当收盘价突破Supertrend上轨时,开仓做多。
|
||
|
|
3. 计算止损和止盈价格:基于当前收盘价和预设的风险回报比(如1:5),计算止损价和止盈价。
|
||
|
|
4. 提交多头订单:以计算出的止损价和止盈价,开仓做多。
|
||
|
|
5. 检查多头平仓条件:当收盘价跌破Supertrend下轨时,平掉多头仓位。
|
||
|
|
|
||
|
|
#### 优势分析
|
||
|
|
1. 趋势跟踪:Supertrend指标可以有效地捕捉强劲的趋势,帮助策略在上升趋势中获利。
|
||
|
|
2. 动态止损:通过使用ATR计算动态支撑位和阻力位,Supertrend为策略提供了动态止损位,以控制风险。
|
||
|
|
3. 风险回报控制:该策略允许用户预设风险回报比(如1:5),以控制每笔交易的风险和潜在回报。
|
||
|
|
4. 简单易用:策略逻辑清晰,易于理解和实现。
|
||
|
|
|
||
|
|
#### 风险分析
|
||
|
|
1. 趋势反转:在突然的趋势反转中,该策略可能会遭受损失,因为它依赖于趋势持续性。
|
||
|
|
2. 参数敏感性:策略的表现可能对Supertrend的参数(如ATR因子和ATR长度)敏感。不恰当的参数可能导致虚假信号。
|
||
|
|
3. 缺乏波动性:在波动性低的市场环境中,该策略可能效果不佳,因为价格可能在上轨和下轨间波动,导致频繁的交易和手续费损失。
|
||
|
|
|
||
|
|
#### 优化方向
|
||
|
|
1. 动态参数优化:实施参数优化程序,以根据不同的市场状况动态调整Supertrend参数。这可以提高策略的适应性和鲁棒性。
|
||
|
|
2. 结合其他指标:结合其他技术指标,如RSI或MACD,以确认趋势强度并过滤虚假信号。
|
||
|
|
3. 市场环境适应:开发逻辑以识别不同的市场状况(如趋势、震荡),并相应地调整策略参数或禁用策略。
|
||
|
|
4. 资金管理优化:优化头寸规模和风险管理规则,以提高策略的风险调整后回报。
|
||
|
|
|
||
|
|
#### 总结
|
||
|
|
该策略利用Supertrend指标来跟踪强劲的上升趋势,同时严格控制风险。它提供了一个简单而有效的框架,可以捕捉趋势性机会。然而,策略可能面临趋势反转和参数敏感性等风险。通过动态参数优化、结合其他指标、适应市场环境和优化资金管理,可以进一步改进该策略。总体而言,这个Supertrend策略为趋势追踪交易提供了一个坚实的基础。
|
||
|
|
|
||
|
|
||
|
||
|
|
|
||
|
|
#### Overview
|
||
|
|
This strategy utilizes the Supertrend indicator to determine entry and exit points for trades. Supertrend is a trend-following indicator that combines the concepts of dynamic support/resistance and price breakouts. The strategy aims to capture strong uptrends while strictly controlling risk, and it trades with a 1:5 risk-reward ratio. When the price breaks above the Supertrend upper band, it enters a long position and sets a stop-loss and take-profit price based on the predefined risk-reward ratio. Once the price breaks below the Supertrend lower band, the strategy closes the long position.
|
||
|
|
|
||
|
|
#### Strategy Principles
|
||
|
|
1. Calculate the upper and lower bands of the Supertrend indicator. Supertrend uses ATR (Average True Range) and a factor to calculate dynamic support and resistance levels.
|
||
|
|
2. Check for long entry conditions: When the closing price breaks above the Supertrend upper band, enter a long position.
|
||
|
|
3. Calculate stop-loss and take-profit prices: Based on the current closing price and the predefined risk-reward ratio (e.g., 1:5), calculate the stop-loss and take-profit prices.
|
||
|
|
4. Submit a long order: Open a long position with the calculated stop-loss and take-profit prices.
|
||
|
|
5. Check for long exit conditions: When the closing price breaks below the Supertrend lower band, close the long position.
|
||
|
|
|
||
|
|
#### Advantage Analysis
|
||
|
|
1. Trend-following: The Supertrend indicator can effectively capture strong trends, helping the strategy profit from uptrends.
|
||
|
|
2. Dynamic stop-loss: By using ATR to calculate dynamic support and resistance levels, Supertrend provides a dynamic stop-loss for the strategy to control risk.
|
||
|
|
3. Risk-reward control: The strategy allows users to predefine a risk-reward ratio (e.g., 1:5) to control the risk and potential reward for each trade.
|
||
|
|
4. Simplicity: The strategy logic is straightforward and easy to understand and implement.
|
||
|
|
|
||
|
|
#### Risk Analysis
|
||
|
|
1. Trend reversals: In sudden trend reversals, the strategy may suffer losses as it relies on the continuity of the trend.
|
||
|
|
2. Parameter sensitivity: The strategy's performance may be sensitive to the parameters of the Supertrend, such as the ATR factor and ATR length. Inappropriate parameters may lead to false signals.
|
||
|
|
3. Lack of volatility: In low volatility market conditions, the strategy may underperform as prices may oscillate between the upper and lower bands, leading to frequent trades and losses due to slippage and commissions.
|
||
|
|
|
||
|
|
#### Optimization Directions
|
||
|
|
1. Dynamic parameter optimization: Implement a parameter optimization routine to dynamically adjust Supertrend parameters based on different market conditions. This can improve the adaptability and robustness of the strategy.
|
||
|
|
2. Combine with other indicators: Incorporate other technical indicators, such as RSI or MACD, to confirm trend strength and filter out false signals.
|
||
|
|
3. Market condition adaptation: Develop logic to identify different market conditions (e.g., trending, ranging) and adjust strategy parameters or disable the strategy accordingly.
|
||
|
|
4. Money management optimization: Optimize position sizing and risk management rules to improve the risk-adjusted returns of the strategy.
|
||
|
|
|
||
|
|
#### Summary
|
||
|
|
This strategy leverages the Supertrend indicator to follow strong uptrends while strictly controlling risk. It provides a simple yet effective framework for capturing trending opportunities. However, the strategy may face risks such as trend reversals and parameter sensitivity. Further improvements can be made through dynamic parameter optimization, combining with other indicators, adapting to market conditions, and optimizing money management. Overall, this Supertrend strategy offers a solid foundation for trend-following trading.
|
||
|
|
[/trans]
|
||
|
|
|
||
|
|
|
||
|
|
|
||
|
|
> Source (PineScript)
|
||
|
|
|
||
|
|
``` pinescript
|
||
|
|
/*backtest
|
||
|
|
start: 2024-05-01 00:00:00
|
||
|
|
end: 2024-05-31 23:59:59
|
||
|
|
period: 1h
|
||
|
|
basePeriod: 15m
|
||
|
|
exchanges: [{"eid":"Futures_Binance","currency":"BTC_USDT"}]
|
||
|
|
*/
|
||
|
|
|
||
|
|
//@version=5
|
||
|
|
strategy("Supertrend Strategy with 1:5 Risk Reward", overlay=true)
|
||
|
|
|
||
|
|
// Supertrend Indicator
|
||
|
|
factor = input(3.0, title="ATR Factor")
|
||
|
|
atrLength = input(10, title="ATR Length")
|
||
|
|
|
||
|
|
[supertrendUp, supertrendDown] = ta.supertrend(factor, atrLength)
|
||
|
|
|
||
|
|
supertrend = ta.crossover(ta.lowest(close, 1), supertrendDown) ? supertrendDown : supertrendUp
|
||
|
|
|
||
|
|
plot(supertrend, title="Supertrend", color=supertrend == supertrendUp ? color.green : color.red, linewidth=2, style=plot.style_line)
|
||
|
|
|
||
|
|
// Strategy parameters
|
||
|
|
risk = input(1.0, title="Risk in %")
|
||
|
|
reward = input(5.0, title="Reward in %")
|
||
|
|
riskRewardRatio = reward / risk
|
||
|
|
|
||
|
|
// Entry and exit conditions
|
||
|
|
longCondition = ta.crossover(close, supertrendUp)
|
||
|
|
if (longCondition)
|
||
|
|
// Calculate stop loss and take profit levels
|
||
|
|
stopLossPrice = close * (1 - (risk / 100))
|
||
|
|
takeProfitPrice = close * (1 + (reward / 100))
|
||
|
|
|
||
|
|
// Submit long order
|
||
|
|
strategy.entry("Long", strategy.long, stop=stopLossPrice, limit=takeProfitPrice)
|
||
|
|
|
||
|
|
// Exit conditions
|
||
|
|
shortCondition = ta.crossunder(close, supertrendDown)
|
||
|
|
if (shortCondition)
|
||
|
|
strategy.close("Long")
|
||
|
|
|
||
|
|
```
|
||
|
|
|
||
|
|
> Detail
|
||
|
|
|
||
|
|
https://www.fmz.com/strategy/454363
|
||
|
|
|
||
|
|
> Last Modified
|
||
|
|
|
||
|
|
2024-06-17 16:32:24
|