2023-01-11 17:10:25 +08:00
|
|
|
|
2023-07-14 18:39:48 +08:00
|
|
|
> Name
|
2023-01-11 17:10:25 +08:00
|
|
|
|
2023-04-18 23:12:35 +08:00
|
|
|
Linear-Regression
|
2023-01-11 17:10:25 +08:00
|
|
|
|
2023-07-14 18:39:48 +08:00
|
|
|
> Author
|
2023-01-11 17:10:25 +08:00
|
|
|
|
2023-10-31 12:29:56 +08:00
|
|
|
ChaoZhang
|
2023-01-11 17:10:25 +08:00
|
|
|
|
2023-07-14 18:39:48 +08:00
|
|
|
> Strategy Description
|
2023-01-11 17:10:25 +08:00
|
|
|
|
|
|
|
|
ue to public demand
|
|
|
|
|
|
|
|
|
|
Linear Regression Formula
|
|
|
|
|
Scraped Calculation With Alerts
|
|
|
|
|
|
|
|
|
|
Here is the Linear Regression Script For traders Who love rich features
|
|
|
|
|
|
|
|
|
|
Features
|
|
|
|
|
++ Multi time frame -> Source Regression from a different Chart
|
|
|
|
|
++ Customized Colors -> This includes the pine lines
|
|
|
|
|
++ Smoothing -> Allow Filtered Regression; Note: Using 1 Defaults to the original line. The default is 1
|
|
|
|
|
++ Alerts On Channel/Range Crossing
|
|
|
|
|
|
|
|
|
|
|
|
|
|
|
Usage
|
|
|
|
|
++ Use this for BreakOuts and Reversals
|
|
|
|
|
++ This Script is not to be used Independently
|
|
|
|
|
|
|
|
|
|
|
|
|
|
|
Risks
|
|
|
|
|
Please note, this script is the likes of Bollinger bands and poses a risk of falling in a trend range.
|
|
|
|
|
Signals may Keep running on the same direction while the market is reversing.
|
|
|
|
|
|
|
|
|
|
|
|
|
|
|
Requests
|
|
|
|
|
If you have any feature requests, comment below or dm me. I will answer when i can.
|
|
|
|
|
Feel free to utilize this on your chart and share your ideas
|
|
|
|
|
|
|
|
|
|
|
|
|
|
|
For developers who want to use this on their chart, Please use this script
|
|
|
|
|
The original formula for calculation is posted there
|
|
|
|
|
|
|
|
|
|
|
|
|
|
|
❤❤❤ I hope you love this. From my heart! ❤❤❤
|
|
|
|
|
|
|
|
|
|
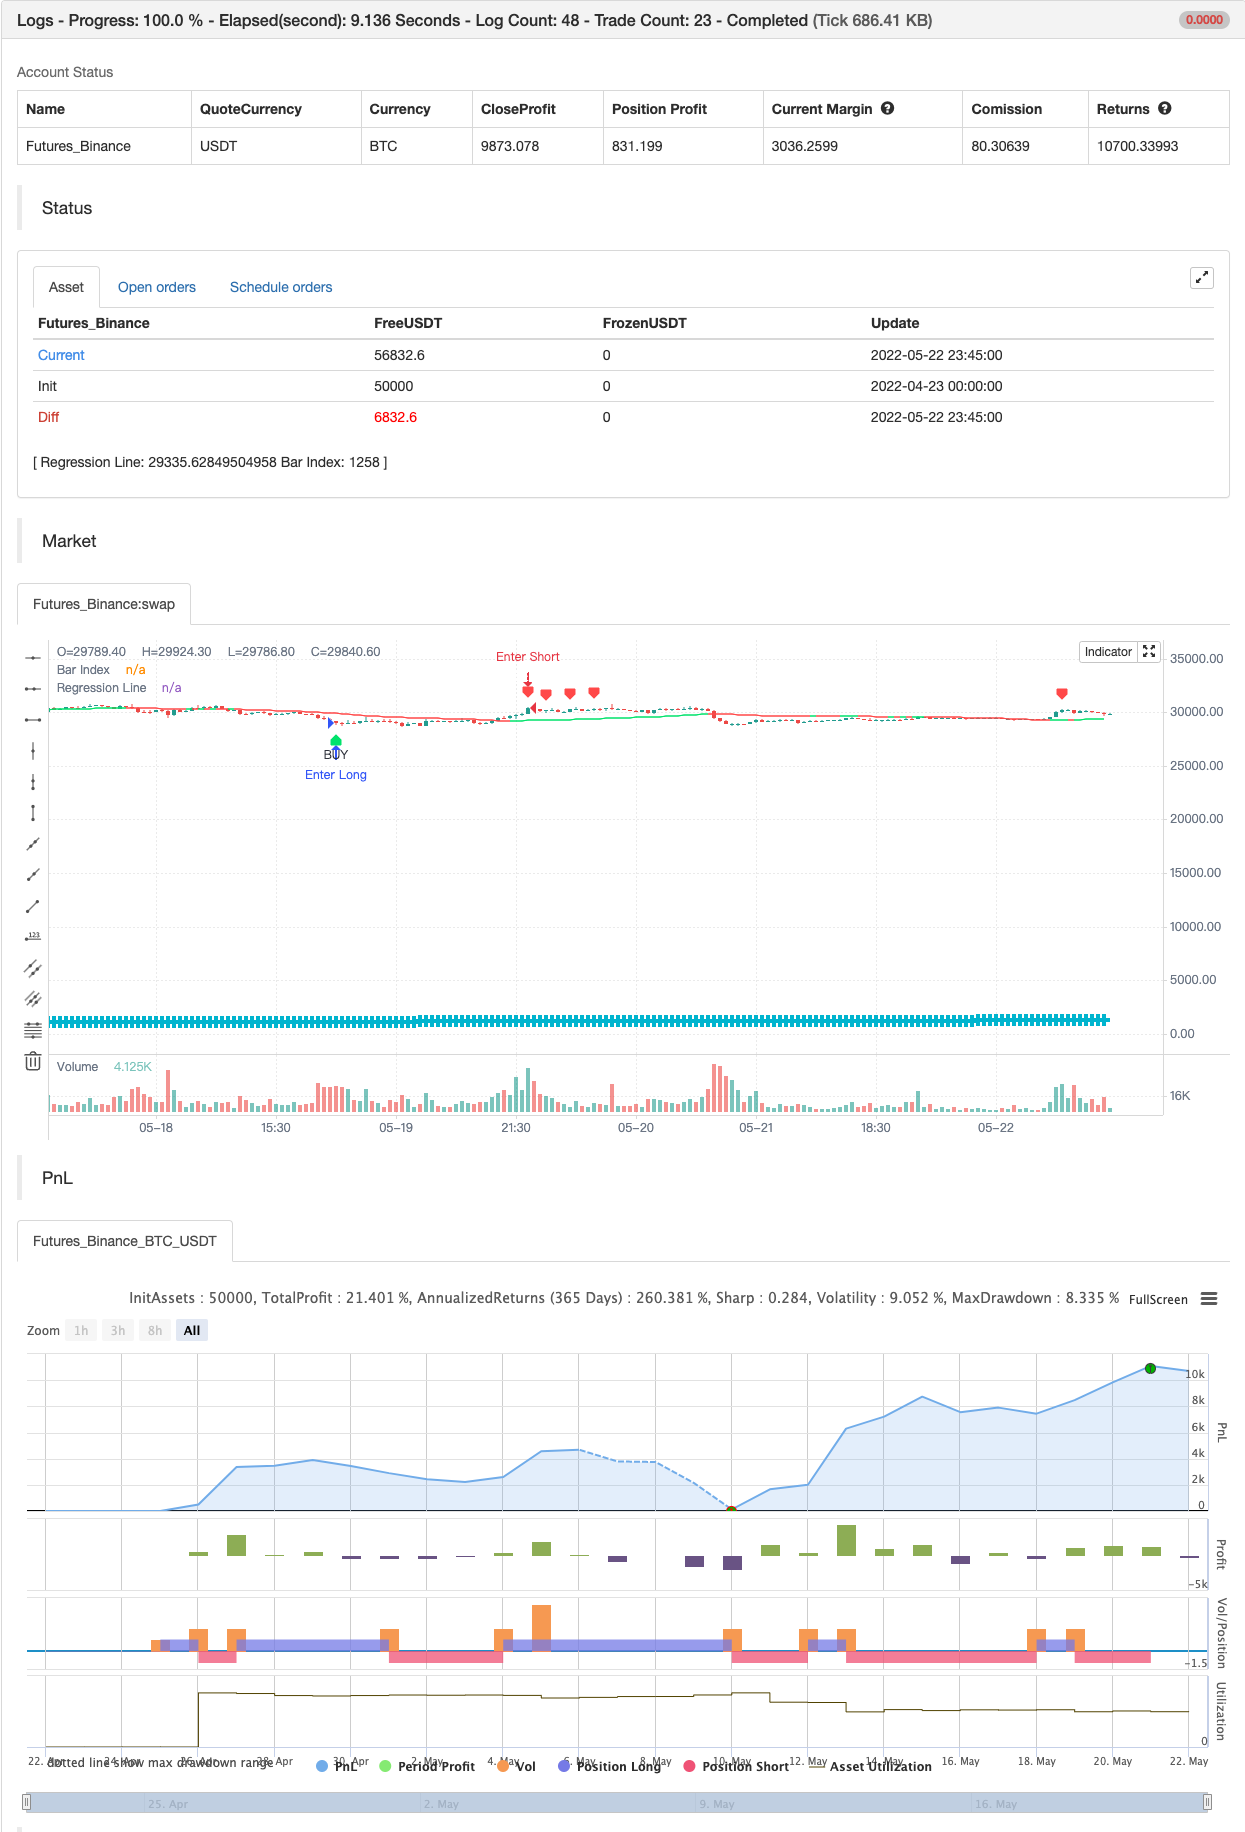
**backtest**
|
|
|
|
|
|
|
|
|
|
|
|
|
|
|
|
2023-07-14 18:39:48 +08:00
|
|
|
> Strategy Arguments
|
2023-01-11 17:10:25 +08:00
|
|
|
|
|
|
|
|
|
|
|
|
|
|
2023-07-14 18:39:48 +08:00
|
|
|
|Argument|Default|Description|
|
2023-01-11 17:10:25 +08:00
|
|
|
|----|----|----|
|
|
|
|
|
|v_input_1_close|0|source: close|high|low|open|hl2|hlc3|hlcc4|ohlc4|
|
|
|
|
|
|v_input_2|100|length|
|
|
|
|
|
|v_input_3|false|offset|
|
|
|
|
|
|v_input_4|2|Deviation|
|
|
|
|
|
|v_input_5|true|smoothing|
|
|
|
|
|
|v_input_6||Resolution|
|
|
|
|
|
|v_input_7|4|S&R Thickness|
|
|
|
|
|
|v_input_8|0|Signals Display: Recent|All|
|
|
|
|
|
|v_input_9|0|Up Color: Lime|Red|Orange|Teal|Yellow|White|Black|
|
|
|
|
|
|v_input_10|0|Down Color: Red|Lime|Orange|Teal|Yellow|White|Black|
|
|
|
|
|
|v_input_11|false|End At Bar Index|
|
|
|
|
|
|
|
|
|
|
|
2023-07-14 18:39:48 +08:00
|
|
|
> Source (PineScript)
|
2023-01-11 17:10:25 +08:00
|
|
|
|
2024-03-03 22:27:55 +08:00
|
|
|
``` pinescript
|
2023-01-11 17:10:25 +08:00
|
|
|
/*backtest
|
|
|
|
|
start: 2022-04-23 00:00:00
|
|
|
|
|
end: 2022-05-22 23:59:00
|
|
|
|
|
period: 45m
|
|
|
|
|
basePeriod: 5m
|
|
|
|
|
exchanges: [{"eid":"Futures_Binance","currency":"BTC_USDT"}]
|
|
|
|
|
*/
|
|
|
|
|
|
|
|
|
|
// This source code is subject to the terms of the Mozilla Public License 2.0 at https://mozilla.org/MPL/2.0/
|
|
|
|
|
// © LucemAnb
|
|
|
|
|
// User Version
|
|
|
|
|
|
|
|
|
|
//@version=4
|
|
|
|
|
study("Linear Regression ++ [Lucem Anb]", "Lin Reg ++ [Lucem Anb]", overlay=true)
|
|
|
|
|
|
|
|
|
|
|
|
|
|
|
source = input(close)
|
|
|
|
|
length = input(100, minval=1)
|
|
|
|
|
offset = input(0, minval=0)
|
|
|
|
|
dev = input(2.0, "Deviation")
|
|
|
|
|
smoothing = input(1, minval=1)
|
|
|
|
|
mtf_val = input("", "Resolution", input.resolution)
|
|
|
|
|
line_thick = input(4, "S&R Thickness", minval=1, maxval=4)
|
|
|
|
|
signals = input("Recent", "Signals Display", options=["Recent", "All"])
|
|
|
|
|
p = input("Lime", "Up Color", options=["Red", "Lime", "Orange", "Teal", "Yellow", "White", "Black"])
|
|
|
|
|
q = input("Red", "Down Color", options=["Red", "Lime", "Orange", "Teal", "Yellow", "White", "Black"])
|
|
|
|
|
goto = input(0, "End At Bar Index")
|
|
|
|
|
|
|
|
|
|
cc(x) => x=="Red"?color.red:x=="Lime"?color.lime:x=="Orange"?color.orange:x=="Teal"?
|
|
|
|
|
color.teal:x=="Yellow"?color.yellow:x=="Black"?color.black:color.white
|
|
|
|
|
data(x) => sma(security(syminfo.tickerid, mtf_val!="" ? mtf_val : timeframe.period, x), smoothing)
|
|
|
|
|
|
|
|
|
|
linreg = data(linreg(source, length, offset))
|
|
|
|
|
linreg_p = data(linreg(source, length, offset+1))
|
|
|
|
|
plot(linreg, "Regression Line", cc(linreg>linreg[1]?p:q), editable=false)
|
|
|
|
|
|
|
|
|
|
x = bar_index
|
|
|
|
|
slope = linreg - linreg_p
|
|
|
|
|
intercept = linreg - x*slope
|
|
|
|
|
deviationSum = 0.0
|
|
|
|
|
for i=0 to length-1
|
|
|
|
|
deviationSum:= deviationSum + pow(source[i]-(slope*(x-i)+intercept), 2)
|
|
|
|
|
deviation = sqrt(deviationSum/(length))
|
|
|
|
|
x1 = x-length
|
|
|
|
|
x2 = x
|
|
|
|
|
y1 = slope*(x-length)+intercept
|
|
|
|
|
y2 = linreg
|
|
|
|
|
|
|
|
|
|
updating = goto <= 0 or x < goto
|
|
|
|
|
|
|
|
|
|
|
|
|
|
|
|
|
|
|
|
dm_current = -deviation*dev + y2
|
|
|
|
|
dp_current = deviation*dev + y2
|
|
|
|
|
buy = crossunder(close, dm_current)
|
|
|
|
|
sell = crossover(close, dp_current)
|
|
|
|
|
alertcondition(buy, "Buy Lin Reg", "Crossing On the Lower Regression Channel")
|
|
|
|
|
alertcondition(sell, "Sell Lin Reg", "Crossing On the Higher Regression Channel")
|
|
|
|
|
|
|
|
|
|
plotshape(buy, "BUY", shape.labelup, location.belowbar, color.lime, text='BUY', textcolor=color.black, show_last=signals=="All"?99999999:length)
|
|
|
|
|
plotshape(sell, "SELL", shape.labeldown, location.abovebar, color.red, text='SELL', textcolor=color.white, show_last=signals=="All"?99999999:length)
|
|
|
|
|
|
|
|
|
|
plot(x, "Bar Index", color.aqua, line_thick, plot.style_cross, display=display.none)
|
|
|
|
|
|
|
|
|
|
if buy
|
|
|
|
|
strategy.entry("Enter Long", strategy.long)
|
|
|
|
|
else if sell
|
|
|
|
|
strategy.entry("Enter Short", strategy.short)
|
|
|
|
|
```
|
|
|
|
|
|
2023-07-14 18:39:48 +08:00
|
|
|
> Detail
|
2023-01-11 17:10:25 +08:00
|
|
|
|
|
|
|
|
https://www.fmz.com/strategy/365345
|
|
|
|
|
|
2023-07-14 18:39:48 +08:00
|
|
|
> Last Modified
|
2023-01-11 17:10:25 +08:00
|
|
|
|
|
|
|
|
2022-05-24 14:17:42
|
