195 lines
9.6 KiB
Markdown
195 lines
9.6 KiB
Markdown

|
|
||
|
|
> Name
|
||
|
|
|
||
|
|
EMA与布林带突破策略-EMA-and-Bollinger-Bands-Breakout-Strategy
|
||
|
|
|
||
|
|
> Author
|
||
|
|
|
||
|
|
ChaoZhang
|
||
|
|
|
||
|
|
> Strategy Description
|
||
|
|
|
||
|
|
|
||
|
|
|
||
|
|
[trans]
|
||
|
|
#### 概述
|
||
|
|
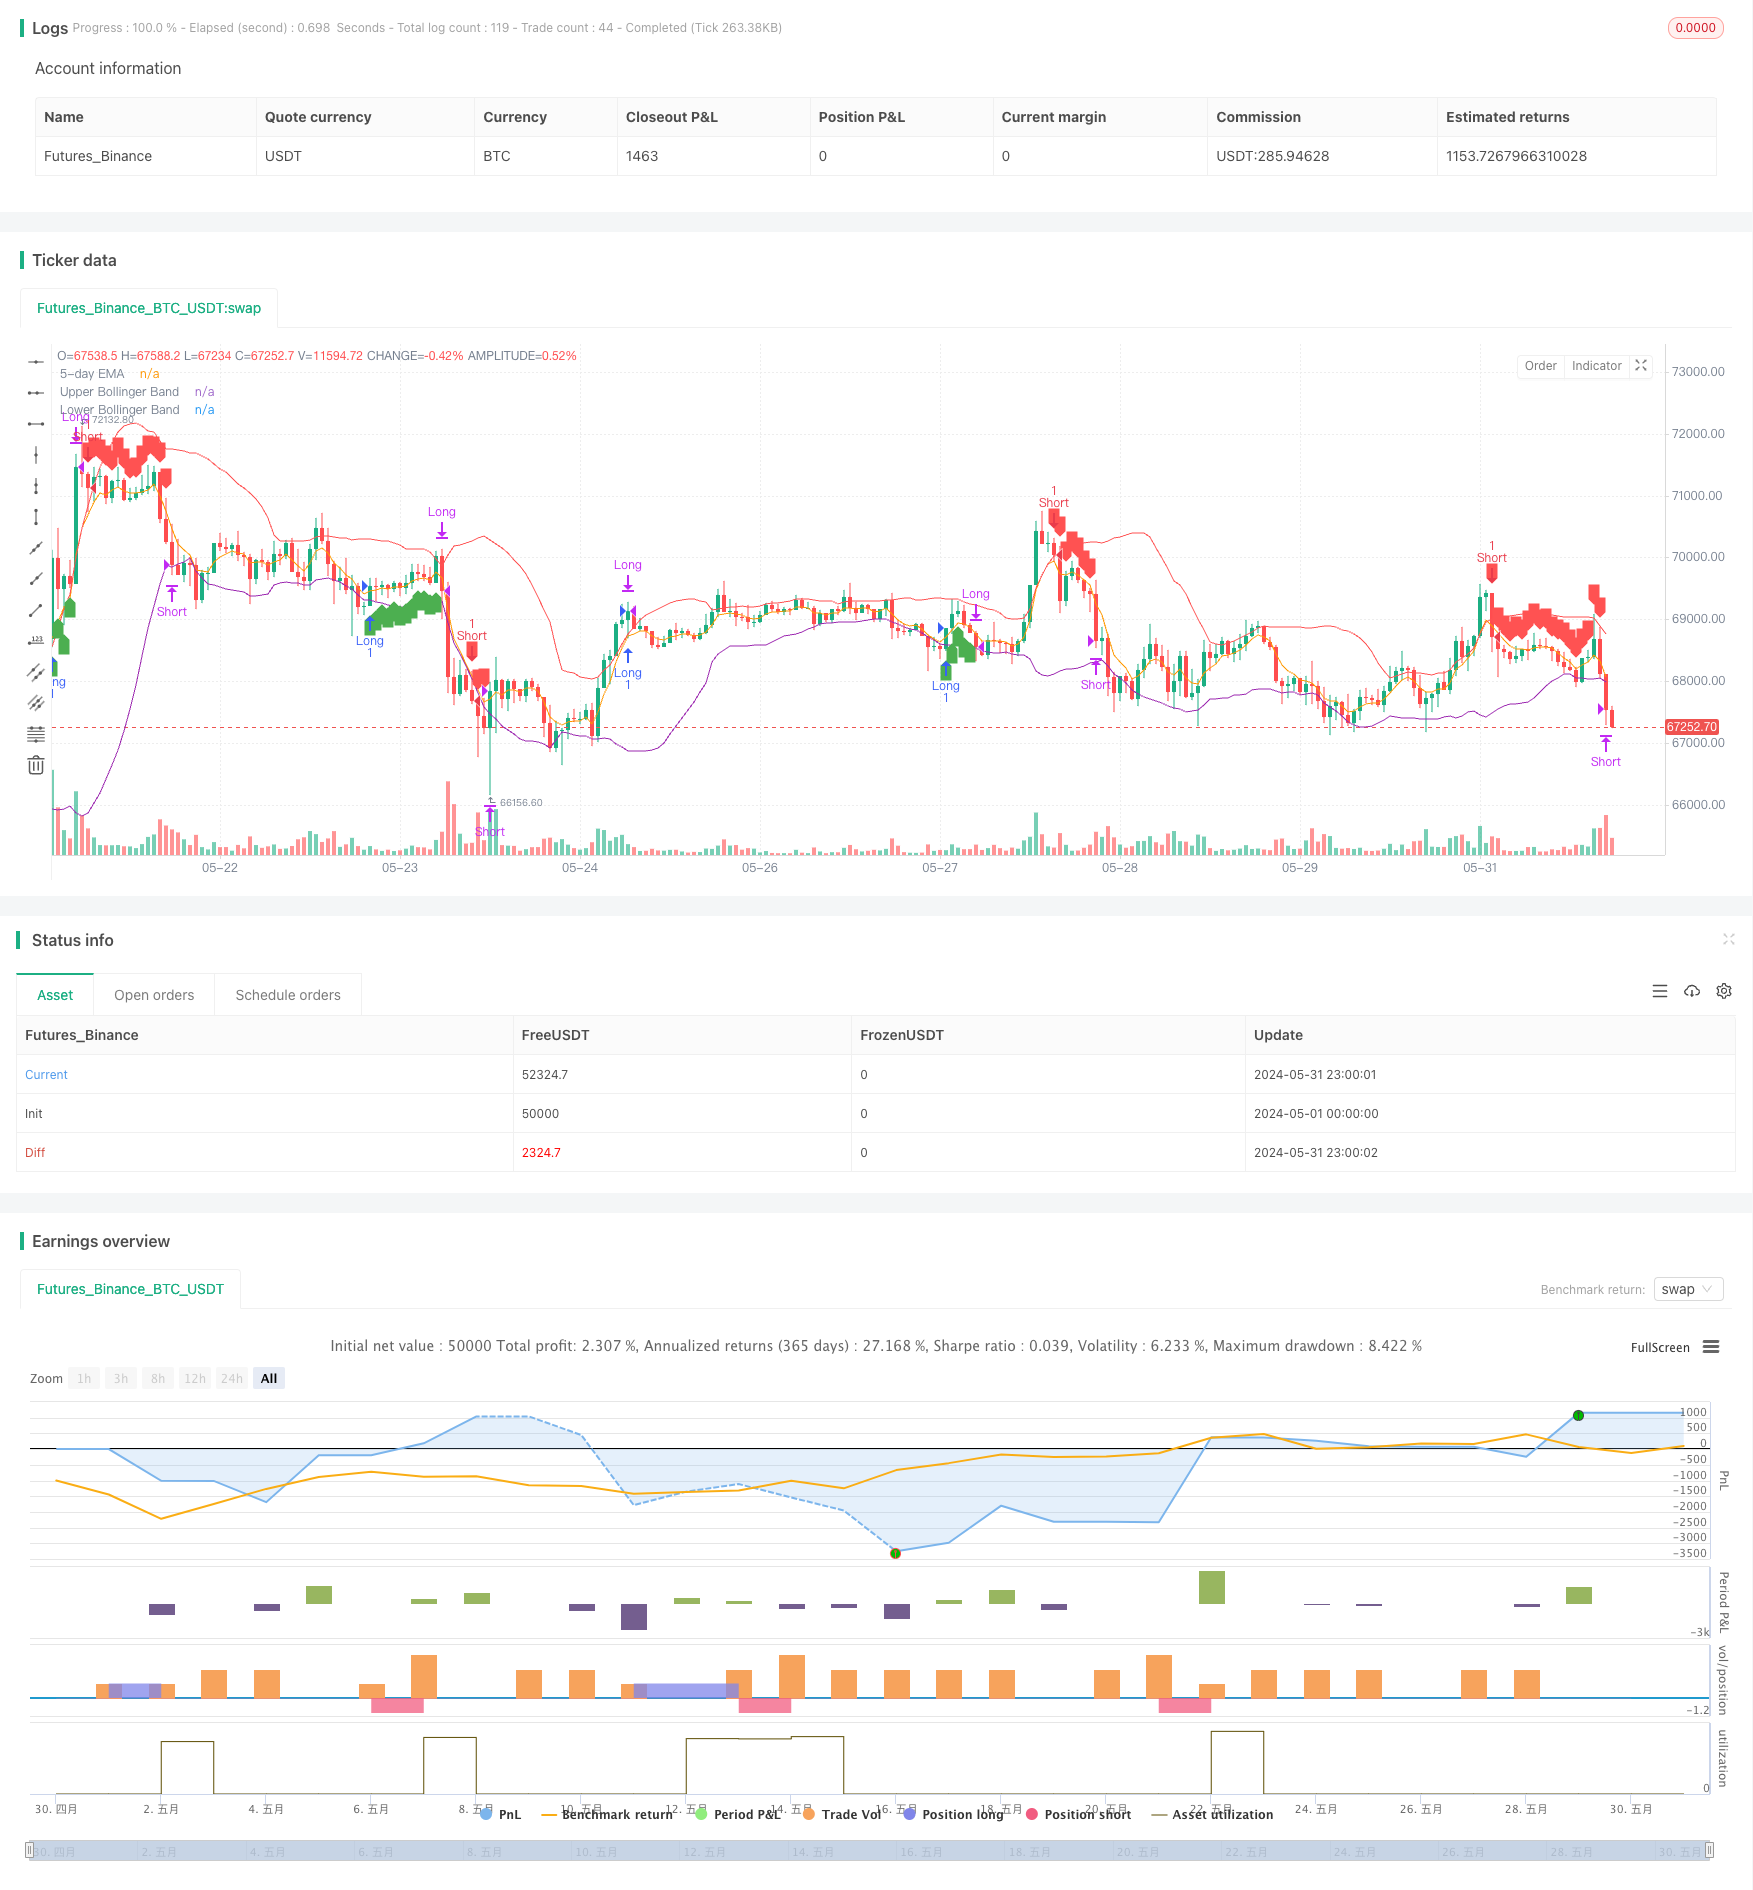
该策略使用5日指数移动平均线(EMA)和布林带(BB)来识别市场的潜在交易机会。当价格突破布林带上轨或下轨,并满足特定条件时,策略会产生买入或卖出信号。该策略旨在捕捉市场的显著价格波动,同时使用止损和目标价位来管理风险和最大化收益。
|
||
|
|
|
||
|
|
#### 策略原理
|
||
|
|
该策略的核心是利用5日EMA和布林带来判断市场趋势和波动性。当价格突破布林带上轨,并在上一根K线高于5日EMA时,策略会产生卖出信号。相反地,当价格突破布林带下轨,并在上一根K线低于5日EMA时,策略会产生买入信号。这种方法可以帮助识别潜在的趋势反转或突破点。
|
||
|
|
|
||
|
|
一旦进场交易,策略会设置止损位和目标价位。止损位置于进场价格的相反方向,用于限制潜在损失。目标价位则是根据固定点数(如1000点)来计算的,以锁定预期收益。如果价格触及止损位或目标价位,该策略将平仓退出交易。
|
||
|
|
|
||
|
|
#### 策略优势
|
||
|
|
1. 同时利用EMA和布林带,可以更全面地评估市场趋势和波动性。
|
||
|
|
2. 明确的进场条件有助于识别高概率的交易机会。
|
||
|
|
3. 设置止损和目标价位,可以有效管理风险和锁定利润。
|
||
|
|
4. 策略逻辑清晰,易于理解和实现。
|
||
|
|
|
||
|
|
#### 策略风险
|
||
|
|
1. 市场波动性增大时,布林带可能会产生频繁的交易信号,导致过度交易和手续费增加。
|
||
|
|
2. 在震荡市或趋势不明朗时,该策略可能会产生错误信号,导致亏损。
|
||
|
|
3. 固定的止损和目标价位可能无法适应不同的市场条件,限制了策略的灵活性。
|
||
|
|
|
||
|
|
#### 策略优化方向
|
||
|
|
1. 考虑使用自适应的止损和目标价位,根据市场波动性和趋势强度动态调整,以提高策略的适应性。
|
||
|
|
2. 引入其他技术指标或信号过滤机制,如相对强弱指数(RSI)或平均真实波幅(ATR),以确认趋势和减少假信号。
|
||
|
|
3. 对参数进行优化,如调整EMA的周期、布林带的标准差倍数等,以适应不同的市场特征和交易品种。
|
||
|
|
|
||
|
|
#### 总结
|
||
|
|
EMA与布林带突破策略利用了两个常用的技术指标,旨在捕捉市场的显著价格波动。该策略具有明确的进场条件、风险管理措施和盈利目标,易于理解和实施。然而,策略的表现可能受到市场波动性和趋势不明朗的影响。通过引入自适应参数、信号过滤机制和参数优化,可以进一步提升策略的稳健性和盈利能力。
|
||
|
|
|
||
|
|
||
|
||
|
|
|
||
|
|
#### Overview
|
||
|
|
This strategy utilizes the 5-day Exponential Moving Average (EMA) and Bollinger Bands (BB) to identify potential trading opportunities in the market. When the price breaks out above the upper Bollinger Band or below the lower Bollinger Band, and specific conditions are met, the strategy generates buy or sell signals. The strategy aims to capture significant price movements in the market while using stop loss and target price levels to manage risk and maximize returns.
|
||
|
|
|
||
|
|
#### Strategy Principles
|
||
|
|
The core of this strategy is to use the 5-day EMA and Bollinger Bands to determine market trends and volatility. When the price breaks above the upper Bollinger Band, and the previous candle's high is above the 5-day EMA, the strategy generates a sell signal. Conversely, when the price breaks below the lower Bollinger Band, and the previous candle's low is below the 5-day EMA, the strategy generates a buy signal. This approach helps identify potential trend reversals or breakout points.
|
||
|
|
|
||
|
|
Once a trade is entered, the strategy sets a stop loss level and a target price level. The stop loss is placed in the opposite direction of the entry price to limit potential losses. The target price level is calculated based on a fixed number of points (e.g., 1000 points) to lock in expected profits. If the price reaches the stop loss level or the target price level, the strategy closes the trade and exits the position.
|
||
|
|
|
||
|
|
#### Strategy Advantages
|
||
|
|
1. By using both EMA and Bollinger Bands, the strategy provides a more comprehensive assessment of market trends and volatility.
|
||
|
|
2. Clear entry conditions help identify high-probability trading opportunities.
|
||
|
|
3. Setting stop loss and target price levels effectively manages risk and locks in profits.
|
||
|
|
4. The strategy logic is straightforward and easy to understand and implement.
|
||
|
|
|
||
|
|
#### Strategy Risks
|
||
|
|
1. During periods of increased market volatility, Bollinger Bands may generate frequent trading signals, leading to over-trading and increased transaction costs.
|
||
|
|
2. In choppy or trendless markets, the strategy may generate false signals, resulting in losses.
|
||
|
|
3. Fixed stop loss and target price levels may not adapt well to different market conditions, limiting the strategy's flexibility.
|
||
|
|
|
||
|
|
#### Strategy Optimization Directions
|
||
|
|
1. Consider using adaptive stop loss and target price levels that dynamically adjust based on market volatility and trend strength to improve the strategy's adaptability.
|
||
|
|
2. Introduce additional technical indicators or signal filtering mechanisms, such as the Relative Strength Index (RSI) or Average True Range (ATR), to confirm trends and reduce false signals.
|
||
|
|
3. Optimize the parameters, such as adjusting the EMA period, Bollinger Bands' standard deviation multiplier, etc., to suit different market characteristics and trading instruments.
|
||
|
|
|
||
|
|
#### Summary
|
||
|
|
The EMA and Bollinger Bands Breakout Strategy leverages two commonly used technical indicators to capture significant price movements in the market. The strategy has clear entry conditions, risk management measures, and profit targets, making it easy to understand and implement. However, the strategy's performance may be influenced by market volatility and trendless conditions. By introducing adaptive parameters, signal filtering mechanisms, and parameter optimization, the strategy's robustness and profitability can be further enhanced.
|
||
|
|
[/trans]
|
||
|
|
|
||
|
|
|
||
|
|
|
||
|
|
> Source (PineScript)
|
||
|
|
|
||
|
|
``` pinescript
|
||
|
|
/*backtest
|
||
|
|
start: 2024-05-01 00:00:00
|
||
|
|
end: 2024-05-31 23:59:59
|
||
|
|
period: 1h
|
||
|
|
basePeriod: 15m
|
||
|
|
exchanges: [{"eid":"Futures_Binance","currency":"BTC_USDT"}]
|
||
|
|
*/
|
||
|
|
|
||
|
|
//@version=5
|
||
|
|
strategy("Nifty Bank Strategy", overlay=true)
|
||
|
|
|
||
|
|
// Parameters
|
||
|
|
lengthEMA = 5
|
||
|
|
lengthBB = 20
|
||
|
|
multBB = 1.5
|
||
|
|
targetPoints = 1000
|
||
|
|
|
||
|
|
// Calculate 5-day EMA
|
||
|
|
ema5 = ta.ema(close, lengthEMA)
|
||
|
|
|
||
|
|
// Calculate Bollinger Bands (length 20, multiplier 1.5)
|
||
|
|
basis = ta.sma(close, lengthBB)
|
||
|
|
dev = multBB * ta.stdev(close, lengthBB)
|
||
|
|
upperBB = basis + dev
|
||
|
|
lowerBB = basis - dev
|
||
|
|
|
||
|
|
// Define strategy variables
|
||
|
|
var float entryPrice = na
|
||
|
|
var float stopLoss = na
|
||
|
|
var float targetPrice = na
|
||
|
|
var bool inTrade = false
|
||
|
|
var bool isLong = false
|
||
|
|
var float triggerHigh = na
|
||
|
|
var float triggerLow = na
|
||
|
|
var float triggerClose = na
|
||
|
|
|
||
|
|
if not inTrade
|
||
|
|
// Short Entry Trigger Condition
|
||
|
|
if low > ema5 and low > upperBB and high > upperBB
|
||
|
|
triggerLow := low
|
||
|
|
triggerHigh := high
|
||
|
|
triggerClose := close
|
||
|
|
label.new(bar_index, high, "Waiting for short trigger", color=color.yellow)
|
||
|
|
// Long Entry Trigger Condition
|
||
|
|
else if high < ema5 and high < lowerBB and low < lowerBB
|
||
|
|
triggerHigh := high
|
||
|
|
triggerLow := low
|
||
|
|
triggerClose := close
|
||
|
|
label.new(bar_index, low, "Waiting for long trigger", color=color.yellow)
|
||
|
|
|
||
|
|
// Check for Short Entry
|
||
|
|
if not inTrade and na(triggerClose) == false and close < triggerClose
|
||
|
|
if low < triggerLow
|
||
|
|
entryPrice := close
|
||
|
|
stopLoss := triggerHigh
|
||
|
|
targetPrice := entryPrice - targetPoints
|
||
|
|
strategy.entry("Short", strategy.short)
|
||
|
|
label.new(bar_index, high, "Short", color=color.red, style=label.style_label_down)
|
||
|
|
inTrade := true
|
||
|
|
isLong := false
|
||
|
|
triggerLow := na
|
||
|
|
triggerHigh := na
|
||
|
|
triggerClose := na
|
||
|
|
|
||
|
|
// Check for Long Entry
|
||
|
|
if not inTrade and na(triggerClose) == false and close > triggerClose
|
||
|
|
if high > triggerHigh
|
||
|
|
entryPrice := close
|
||
|
|
stopLoss := triggerLow
|
||
|
|
targetPrice := entryPrice + targetPoints
|
||
|
|
strategy.entry("Long", strategy.long)
|
||
|
|
label.new(bar_index, low, "Long", color=color.green, style=label.style_label_up)
|
||
|
|
inTrade := true
|
||
|
|
isLong := true
|
||
|
|
triggerLow := na
|
||
|
|
triggerHigh := na
|
||
|
|
triggerClose := na
|
||
|
|
|
||
|
|
// Manage Short Trade
|
||
|
|
if inTrade and not isLong
|
||
|
|
if high >= stopLoss
|
||
|
|
strategy.close("Short", comment="SL Hit")
|
||
|
|
label.new(bar_index, high, "SL Hit", color=color.red, style=label.style_label_down)
|
||
|
|
inTrade := false
|
||
|
|
else if low <= targetPrice
|
||
|
|
strategy.close("Short", comment="Target Hit")
|
||
|
|
label.new(bar_index, low, "Target Hit", color=color.green, style=label.style_label_up)
|
||
|
|
inTrade := false
|
||
|
|
|
||
|
|
// Manage Long Trade
|
||
|
|
if inTrade and isLong
|
||
|
|
if low <= stopLoss
|
||
|
|
strategy.close("Long", comment="SL Hit")
|
||
|
|
label.new(bar_index, low, "SL Hit", color=color.red, style=label.style_label_down)
|
||
|
|
inTrade := false
|
||
|
|
else if high >= targetPrice
|
||
|
|
strategy.close("Long", comment="Target Hit")
|
||
|
|
label.new(bar_index, high, "Target Hit", color=color.green, style=label.style_label_up)
|
||
|
|
inTrade := false
|
||
|
|
|
||
|
|
// Plotting
|
||
|
|
plot(ema5, color=color.orange, title="5-day EMA")
|
||
|
|
plot(upperBB, color=color.red, title="Upper Bollinger Band")
|
||
|
|
plot(lowerBB, color=color.purple, title="Lower Bollinger Band")
|
||
|
|
|
||
|
|
// Plot trade entry and exit points
|
||
|
|
plotshape(series=inTrade and isLong ? entryPrice : na, location=location.belowbar, color=color.green, style=shape.labelup, title="Buy Signal")
|
||
|
|
plotshape(series=inTrade and not isLong ? entryPrice : na, location=location.abovebar, color=color.red, style=shape.labeldown, title="Sell Signal")
|
||
|
|
|
||
|
|
```
|
||
|
|
|
||
|
|
> Detail
|
||
|
|
|
||
|
|
https://www.fmz.com/strategy/453267
|
||
|
|
|
||
|
|
> Last Modified
|
||
|
|
|
||
|
|
2024-06-03 16:23:06
|