299 lines
22 KiB
Markdown
299 lines
22 KiB
Markdown

|
|
|||
|
|
> Name
|
|||
|
|
|
|||
|
|
Black-Scholes波动率自适应突破策略与动态阈值优化-Black-Scholes-Volatility-Adjusted-Breakout-with-Dynamic-Threshold-Optimization
|
|||
|
|
|
|||
|
|
> Author
|
|||
|
|
|
|||
|
|
ianzeng123
|
|||
|
|
|
|||
|
|
> Strategy Description
|
|||
|
|
|
|||
|
|
|
|||
|
|
|
|||
|
|
|
|||
|
|
[trans]
|
|||
|
|
#### 概述
|
|||
|
|
|
|||
|
|
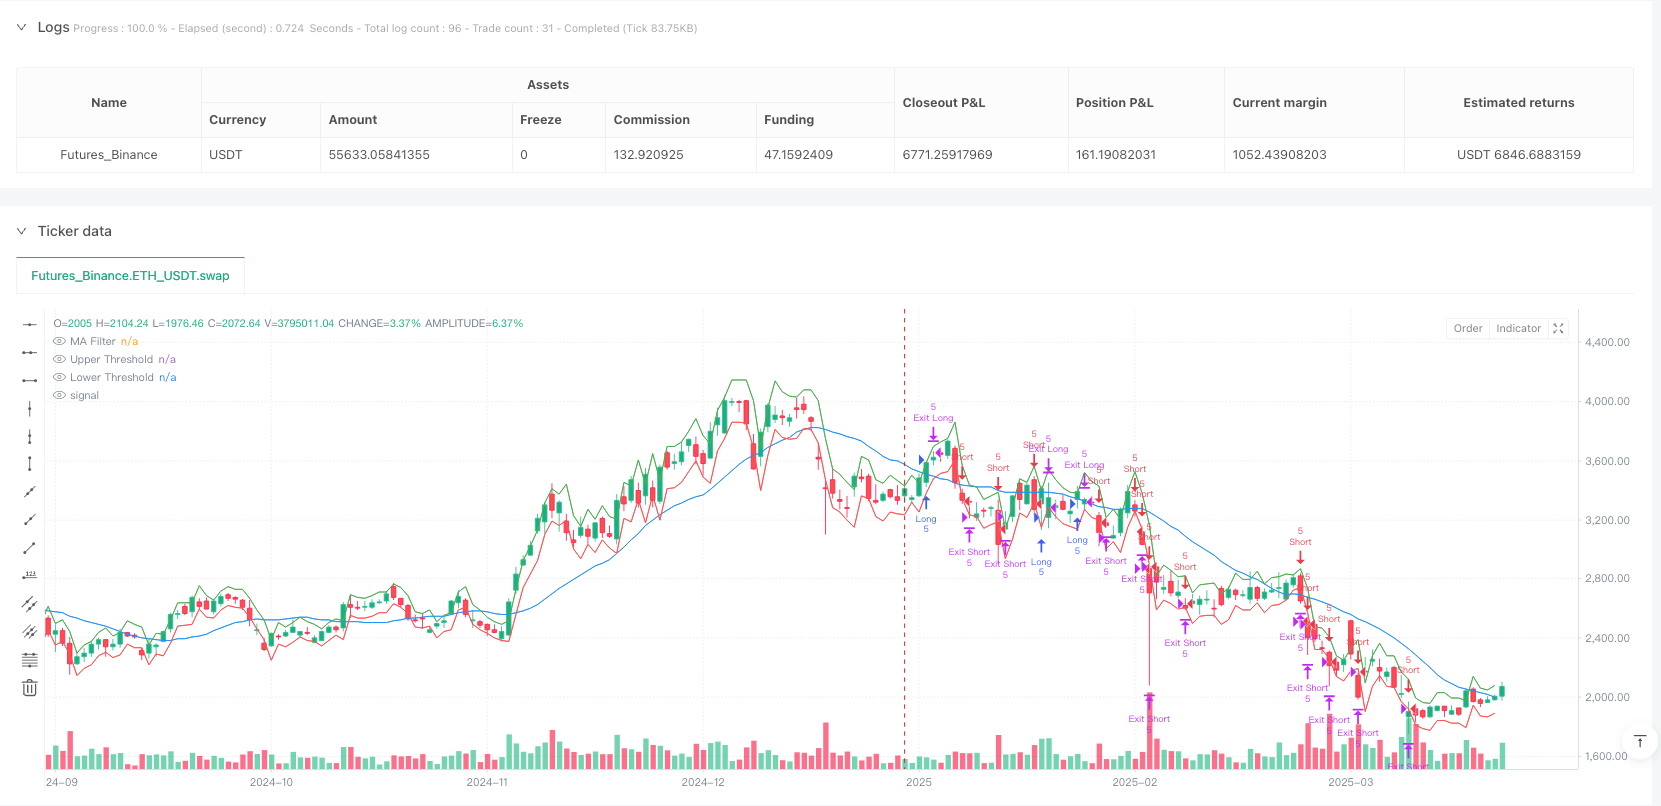
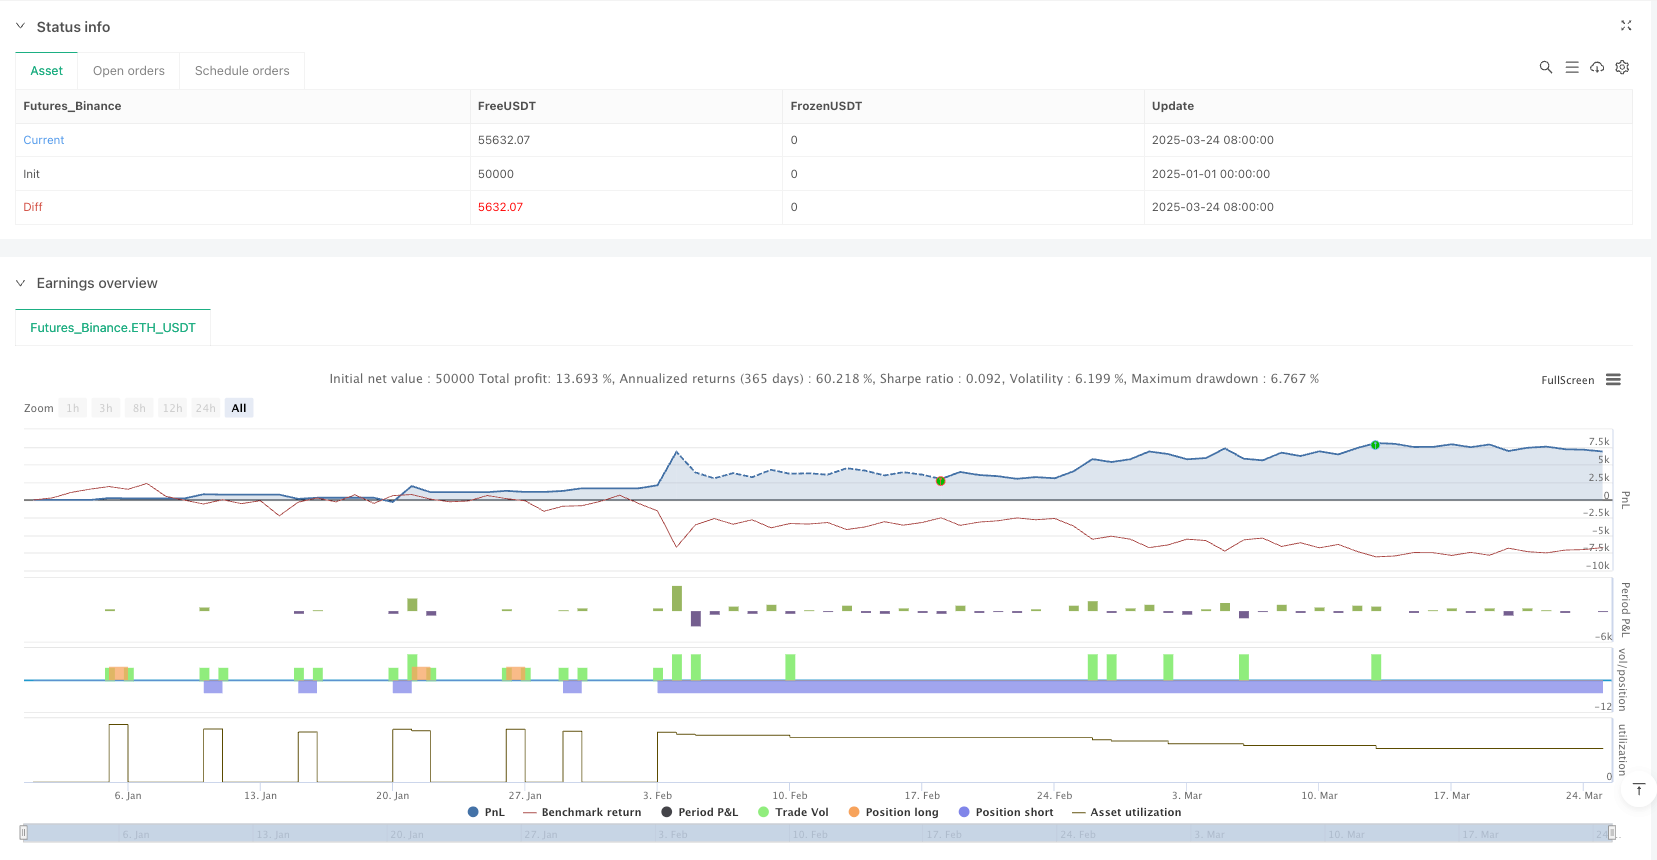
Black-Scholes波动率自适应突破策略与动态阈值优化是一种基于期权定价理论的高级量化交易系统。该策略核心在于利用Black-Scholes模型计算市场预期波动率,并将其转化为动态价格阈值,从而捕捉价格突破机会。系统通过计算对数收益率的标准差来估算波动率,并根据不同时间框架对其进行调整,以预测单个K线的预期价格变动范围。当收盘价突破这些动态阈值时,系统会自动开仓,并结合移动平均线过滤器确认趋势方向,同时采用智能止损和追踪止盈机制管理风险。该策略在保持约80%胜率的同时,实现了1.818的盈亏比,展示了其在捕捉市场突破方面的卓越能力。
|
|||
|
|
|
|||
|
|
#### 策略原理
|
|||
|
|
|
|||
|
|
此策略的核心原理基于金融市场的波动性和随机游走理论。具体执行逻辑如下:
|
|||
|
|
|
|||
|
|
1. **波动率计算**:首先,系统计算对数收益率(logReturn),并基于设定的回顾期(volLookback)计算其标准差。然后通过乘以年化因子(periodsPerYear的平方根)将波动率调整为年化值。这里的关键代码是:`volatility = ta.stdev(logReturn, volLookback) * math.sqrt(periodsPerYear)`。
|
|||
|
|
|
|||
|
|
2. **预期变动计算**:系统根据Black-Scholes模型的原理,计算单个时间周期内的预期价格变动。计算公式为:前一收盘价 × 波动率 × √(1/年周期数)。代码实现为:`expectedMove = close[1] * volatility * math.sqrt(1.0 / periodsPerYear)`。
|
|||
|
|
|
|||
|
|
3. **动态阈值设定**:基于预期变动,系统在前一收盘价的基础上设定上下阈值:`upperThreshold = close[1] + expectedMove` 和 `lowerThreshold = close[1] - expectedMove`。
|
|||
|
|
|
|||
|
|
4. **信号生成与执行**:
|
|||
|
|
- 当收盘价突破上阈值且满足移动平均线过滤条件时,系统生成做多信号。
|
|||
|
|
- 当收盘价跌破下阈值且满足移动平均线过滤条件时,系统生成做空信号。
|
|||
|
|
- 信号仅在K线确认后执行,避免前瞻性偏差。
|
|||
|
|
|
|||
|
|
5. **退出机制**:系统支持两种止损策略:
|
|||
|
|
- 固定止损/止盈:基于入场价格的百分比设定。
|
|||
|
|
- 追踪止损:基于预期变动的倍数设定,动态调整止损价位,保护既有盈利。
|
|||
|
|
|
|||
|
|
策略的创新之处在于将期权定价理论应用于突破交易,通过市场自身的波动特性自动调整入场阈值,从而提高信号质量。
|
|||
|
|
|
|||
|
|
#### 策略优势
|
|||
|
|
|
|||
|
|
深入分析此策略代码,可以总结出以下显著优势:
|
|||
|
|
|
|||
|
|
1. **自适应性强**:策略使用市场自身的波动率来计算预期变动,而非固定参数。这意味着阈值会随市场条件自动调整,在高波动期扩大,低波动期收窄,使策略能适应各种市场环境。
|
|||
|
|
|
|||
|
|
2. **理论基础扎实**:利用Black-Scholes模型的数学原理计算预期变动,相比纯经验参数有更坚实的统计基础,使预测更为科学可靠。
|
|||
|
|
|
|||
|
|
3. **避免前瞻性偏差**:代码明确使用`barstate.isconfirmed`确保仅在K线完成后执行交易,并使用前一K线数据计算阈值,避免了常见的回测偏差问题。
|
|||
|
|
|
|||
|
|
4. **风险管理完善**:提供灵活的风险控制选项,包括固定止损/止盈和基于市场波动的追踪止损,可根据交易者风险偏好调整。
|
|||
|
|
|
|||
|
|
5. **交易成本考量**:策略包含了交易佣金设置`commission_value=0.12`,使回测结果更接近实际交易情况。
|
|||
|
|
|
|||
|
|
6. **趋势确认机制**:可选的移动平均线过滤器帮助确认市场整体趋势,减少逆势交易,提高信号质量。
|
|||
|
|
|
|||
|
|
7. **资金管理规范**:使用固定合约数量(5)进行交易,简化了交易规则,便于系统执行。
|
|||
|
|
|
|||
|
|
8. **高效的表现指标**:约80%的胜率和1.818的盈亏比表明该策略在捕捉有效突破方面具有卓越能力。
|
|||
|
|
|
|||
|
|
#### 策略风险
|
|||
|
|
|
|||
|
|
尽管该策略设计精巧,但仍存在以下潜在风险和挑战:
|
|||
|
|
|
|||
|
|
1. **假突破风险**:市场常出现短暂突破后快速回调的情况,可能导致错误信号。解决方法:增加确认机制,如要求突破持续特定时间或使用量能确认。
|
|||
|
|
|
|||
|
|
2. **参数优化风险**:过度优化参数(如波动率回顾期或移动平均线长度)可能导致过拟合,在未来表现不佳。解决方法:使用步进优化和跨周期验证,选择稳健参数。
|
|||
|
|
|
|||
|
|
3. **高频交易风险**:在小时间周期(如1分钟)上运行可能产生过多信号,增加交易成本。解决方法:添加信号过滤器或延长时间周期,减少交易频率。
|
|||
|
|
|
|||
|
|
4. **极端市场风险**:在极端波动市场中,预期变动计算可能不准确,止损可能被跳空突破。解决方法:设置最大波动率上限和额外的风险限制。
|
|||
|
|
|
|||
|
|
5. **流动性风险**:固定合约数量可能在低流动性市场导致滑点问题。解决方法:根据交易量动态调整交易规模。
|
|||
|
|
|
|||
|
|
6. **系统依赖性**:需要稳定的数据源和执行系统,技术故障可能导致交易中断。解决方法:设置备份系统和人工监控机制。
|
|||
|
|
|
|||
|
|
7. **策略暴露风险**:随着更多交易者采用类似策略,其有效性可能降低。解决方法:定期评估策略表现,并根据市场变化进行调整。
|
|||
|
|
|
|||
|
|
#### 策略优化方向
|
|||
|
|
|
|||
|
|
基于代码分析,可以考虑以下优化方向:
|
|||
|
|
|
|||
|
|
1. **自适应波动率计算**:当前策略使用固定的回顾期(volLookback)计算波动率。可以考虑实现自适应波动率计算,比如在高波动期缩短回顾期,低波动期延长回顾期,或使用GARCH模型更精确预测波动率。这能更好地适应市场状态变化。
|
|||
|
|
|
|||
|
|
2. **多重时间框架分析**:添加更高时间框架的趋势确认,例如在当前时间框架做多信号产生时,检查更高时间框架是否也处于上升趋势。这将减少逆趋势交易,提高胜率。
|
|||
|
|
|
|||
|
|
3. **动态仓位管理**:将固定的交易数量(longQty=5, shortQty=5)替换为基于账户规模、市场波动性和预期风险的动态仓位计算。这可提高资金利用效率和风险调整后回报。
|
|||
|
|
|
|||
|
|
4. **机器学习增强**:引入机器学习算法预测哪些突破更可能持续,而非简单依赖价格穿越阈值。这可减少假突破带来的损失。
|
|||
|
|
|
|||
|
|
5. **波动率偏斜考量**:在预期变动计算中加入波动率偏斜因素,对上涨和下跌设定不同阈值,因为市场通常在下跌时波动更大。具体实现可通过分别计算上行和下行波动率实现。
|
|||
|
|
|
|||
|
|
6. **优化交易时机**:当前策略在K线确认后执行交易,可能错过最佳入场时机。考虑添加盘中突破确认机制,在满足一定条件时即时入场。
|
|||
|
|
|
|||
|
|
7. **合并其他技术指标**:结合RSI、成交量、资金流向等指标,构建多因子确认系统。这将提高信号质量,减少假突破交易。
|
|||
|
|
|
|||
|
|
8. **止损策略优化**:实现更智能的止损逻辑,如基于支撑/阻力位设置止损,或根据市场波动性动态调整追踪止损距离。
|
|||
|
|
|
|||
|
|
#### 总结
|
|||
|
|
|
|||
|
|
Black-Scholes波动率自适应突破策略与动态阈值优化代表了量化交易中理论与实践的深度结合。该策略通过应用期权定价理论中的数学模型来计算市场的预期变动,并将其转化为动态突破阈值,有效捕捉市场机会。
|
|||
|
|
|
|||
|
|
策略的核心优势在于其自适应性和理论基础,使其能够在不同市场环境中保持稳定表现。同时,完善的风险管理机制和趋势确认系统进一步提高了策略的可靠性。不过,交易者仍需警惕假突破和参数优化等风险。
|
|||
|
|
|
|||
|
|
未来优化方向可着眼于自适应波动率计算、多时间框架分析、动态仓位管理和机器学习增强等方面。通过持续改进,该策略有潜力在各种市场条件下提供更稳定的回报。
|
|||
|
|
|
|||
|
|
总体而言,这是一个建立在坚实理论基础上的专业量化策略,适合对统计学和金融市场有一定理解的交易者使用。正确实施并持续优化,有望为投资组合带来显著价值。
|
|||
|
|
|
|||
|
|
||
|
|||
|
|
|
|||
|
|
#### Overview
|
|||
|
|
|
|||
|
|
The Black-Scholes Volatility-Adjusted Breakout with Dynamic Threshold Optimization is an advanced quantitative trading system based on option pricing theory. The strategy's core lies in utilizing the Black-Scholes model to calculate expected market volatility and transform it into dynamic price thresholds to capture breakout opportunities. The system estimates volatility by calculating the standard deviation of logarithmic returns and adjusts it according to different timeframes to predict the expected price movement range for a single bar. When the closing price breaks through these dynamic thresholds, the system automatically enters positions, uses a moving average filter to confirm trend direction, and employs intelligent stop-loss and trailing profit mechanisms to manage risk. The strategy maintains approximately 80% win rate while achieving a 1.818 profit ratio, demonstrating its excellence in capturing market breakouts.
|
|||
|
|
|
|||
|
|
#### Strategy Principles
|
|||
|
|
|
|||
|
|
The core principles of this strategy are based on financial market volatility and random walk theory. The specific execution logic is as follows:
|
|||
|
|
|
|||
|
|
1. **Volatility Calculation**: First, the system calculates logarithmic returns (logReturn) and computes their standard deviation based on a specified lookback period (volLookback). The volatility is then adjusted to an annualized value by multiplying by an annualization factor (square root of periodsPerYear). The key code here is: `volatility = ta.stdev(logReturn, volLookback) * math.sqrt(periodsPerYear)`.
|
|||
|
|
|
|||
|
|
2. **Expected Move Calculation**: Following Black-Scholes model principles, the system calculates the expected price movement within a single time period. The formula is: previous closing price × volatility × √(1/periods per year). The code implementation is: `expectedMove = close[1] * volatility * math.sqrt(1.0 / periodsPerYear)`.
|
|||
|
|
|
|||
|
|
3. **Dynamic Threshold Setting**: Based on the expected move, the system sets upper and lower thresholds from the previous closing price: `upperThreshold = close[1] + expectedMove` and `lowerThreshold = close[1] - expectedMove`.
|
|||
|
|
|
|||
|
|
4. **Signal Generation and Execution**:
|
|||
|
|
- When the closing price breaks above the upper threshold and meets the moving average filter condition, the system generates a long signal.
|
|||
|
|
- When the closing price breaks below the lower threshold and meets the moving average filter condition, the system generates a short signal.
|
|||
|
|
- Signals are only executed after bar confirmation to avoid look-ahead bias.
|
|||
|
|
|
|||
|
|
5. **Exit Mechanisms**: The system supports two stop-loss strategies:
|
|||
|
|
- Fixed stop-loss/take-profit: Set based on a percentage of the entry price.
|
|||
|
|
- Trailing stop: Set based on a multiple of the expected move, dynamically adjusting the stop price to protect existing profits.
|
|||
|
|
|
|||
|
|
The innovation of this strategy lies in applying option pricing theory to breakout trading, automatically adjusting entry thresholds based on the market's own volatility characteristics, thereby improving signal quality.
|
|||
|
|
|
|||
|
|
#### Strategy Advantages
|
|||
|
|
|
|||
|
|
Deep analysis of this strategy code reveals the following significant advantages:
|
|||
|
|
|
|||
|
|
1. **Strong Adaptability**: The strategy uses the market's own volatility to calculate expected moves rather than fixed parameters. This means thresholds automatically adjust with market conditions, expanding during high volatility periods and narrowing during low volatility periods, allowing the strategy to adapt to various market environments.
|
|||
|
|
|
|||
|
|
2. **Solid Theoretical Foundation**: Using mathematical principles from the Black-Scholes model to calculate expected moves provides a more solid statistical basis compared to purely empirical parameters, making predictions more scientific and reliable.
|
|||
|
|
|
|||
|
|
3. **Avoidance of Look-ahead Bias**: The code explicitly uses `barstate.isconfirmed` to ensure trades are only executed after bar completion and uses previous bar data to calculate thresholds, avoiding common backtesting bias issues.
|
|||
|
|
|
|||
|
|
4. **Comprehensive Risk Management**: Offers flexible risk control options, including fixed stop-loss/take-profit and market volatility-based trailing stops, which can be adjusted according to the trader's risk preference.
|
|||
|
|
|
|||
|
|
5. **Transaction Cost Consideration**: The strategy includes commission settings (`commission_value=0.12`), making backtest results closer to actual trading situations.
|
|||
|
|
|
|||
|
|
6. **Trend Confirmation Mechanism**: An optional moving average filter helps confirm the overall market trend, reducing counter-trend trading and improving signal quality.
|
|||
|
|
|
|||
|
|
7. **Standardized Capital Management**: Uses a fixed number of contracts (5) for trading, simplifying trading rules and facilitating system execution.
|
|||
|
|
|
|||
|
|
8. **Efficient Performance Metrics**: Approximately 80% win rate and 1.818 profit ratio indicate the strategy's excellent ability to capture effective breakouts.
|
|||
|
|
|
|||
|
|
#### Strategy Risks
|
|||
|
|
|
|||
|
|
Despite its sophisticated design, the strategy still has the following potential risks and challenges:
|
|||
|
|
|
|||
|
|
1. **False Breakout Risk**: Markets often exhibit short breakouts followed by quick reversals, which may lead to false signals. Solution: Add confirmation mechanisms, such as requiring the breakout to persist for a specific time or using volume confirmation.
|
|||
|
|
|
|||
|
|
2. **Parameter Optimization Risk**: Excessive optimization of parameters (such as volatility lookback period or moving average length) may lead to overfitting and poor future performance. Solution: Use step optimization and cross-timeframe validation to select robust parameters.
|
|||
|
|
|
|||
|
|
3. **High-Frequency Trading Risk**: Running on small timeframes (such as 1 minute) may generate too many signals, increasing transaction costs. Solution: Add signal filters or extend the timeframe to reduce trading frequency.
|
|||
|
|
|
|||
|
|
4. **Extreme Market Risk**: In extremely volatile markets, expected move calculations may be inaccurate, and stops may be breached by gaps. Solution: Set maximum volatility limits and additional risk constraints.
|
|||
|
|
|
|||
|
|
5. **Liquidity Risk**: Fixed contract quantities may cause slippage issues in low-liquidity markets. Solution: Dynamically adjust trading size based on volume.
|
|||
|
|
|
|||
|
|
6. **System Dependency**: Requires stable data sources and execution systems; technical failures may interrupt trading. Solution: Set up backup systems and manual monitoring mechanisms.
|
|||
|
|
|
|||
|
|
7. **Strategy Exposure Risk**: As more traders adopt similar strategies, their effectiveness may decrease. Solution: Regularly evaluate strategy performance and adjust according to market changes.
|
|||
|
|
|
|||
|
|
#### Strategy Optimization Directions
|
|||
|
|
|
|||
|
|
Based on code analysis, the following optimization directions can be considered:
|
|||
|
|
|
|||
|
|
1. **Adaptive Volatility Calculation**: The current strategy uses a fixed lookback period (volLookback) to calculate volatility. Consider implementing adaptive volatility calculation, such as shortening the lookback period during high volatility and extending it during low volatility, or using a GARCH model to more accurately predict volatility. This would better adapt to changing market conditions.
|
|||
|
|
|
|||
|
|
2. **Multiple Timeframe Analysis**: Add trend confirmation from higher timeframes, for example, checking whether a higher timeframe is also in an uptrend when a long signal is generated in the current timeframe. This will reduce counter-trend trading and improve win rates.
|
|||
|
|
|
|||
|
|
3. **Dynamic Position Sizing**: Replace the fixed trading quantities (longQty=5, shortQty=5) with dynamic position calculations based on account size, market volatility, and expected risk. This can improve capital efficiency and risk-adjusted returns.
|
|||
|
|
|
|||
|
|
4. **Machine Learning Enhancement**: Introduce machine learning algorithms to predict which breakouts are more likely to continue, rather than simply relying on price crossing thresholds. This can reduce losses from false breakouts.
|
|||
|
|
|
|||
|
|
5. **Volatility Skew Consideration**: Incorporate volatility skew factors into expected move calculations, setting different thresholds for upward and downward movements, as markets typically have greater volatility during downtrends. This can be implemented by calculating upside and downside volatility separately.
|
|||
|
|
|
|||
|
|
6. **Trading Timing Optimization**: The current strategy executes trades after bar confirmation, potentially missing optimal entry points. Consider adding intrabar breakout confirmation mechanisms for more timely entries when certain conditions are met.
|
|||
|
|
|
|||
|
|
7. **Integration with Other Technical Indicators**: Combine RSI, volume, money flow, and other indicators to build a multi-factor confirmation system. This will improve signal quality and reduce false breakout trades.
|
|||
|
|
|
|||
|
|
8. **Stop-Loss Strategy Optimization**: Implement smarter stop-loss logic, such as setting stops based on support/resistance levels or dynamically adjusting trailing stop distances according to market volatility.
|
|||
|
|
|
|||
|
|
#### Summary
|
|||
|
|
|
|||
|
|
The Black-Scholes Volatility-Adjusted Breakout with Dynamic Threshold Optimization represents a deep integration of theory and practice in quantitative trading. The strategy applies mathematical models from option pricing theory to calculate expected market movements and transforms them into dynamic breakout thresholds, effectively capturing market opportunities.
|
|||
|
|
|
|||
|
|
The core advantages of the strategy lie in its adaptability and theoretical foundation, enabling it to maintain stable performance across different market environments. Meanwhile, comprehensive risk management mechanisms and trend confirmation systems further enhance the strategy's reliability. However, traders still need to be vigilant about risks such as false breakouts and parameter optimization.
|
|||
|
|
|
|||
|
|
Future optimization directions can focus on adaptive volatility calculation, multiple timeframe analysis, dynamic position sizing, and machine learning enhancements. Through continuous improvement, the strategy has the potential to provide more stable returns under various market conditions.
|
|||
|
|
|
|||
|
|
Overall, this is a professional quantitative strategy built on solid theoretical foundations, suitable for traders with some understanding of statistics and financial markets. When correctly implemented and continuously optimized, it has the potential to bring significant value to an investment portfolio.
|
|||
|
|
[/trans]
|
|||
|
|
|
|||
|
|
|
|||
|
|
|
|||
|
|
> Source (PineScript)
|
|||
|
|
|
|||
|
|
``` pinescript
|
|||
|
|
/*backtest
|
|||
|
|
start: 2025-01-01 00:00:00
|
|||
|
|
end: 2025-03-25 00:00:00
|
|||
|
|
period: 1d
|
|||
|
|
basePeriod: 1d
|
|||
|
|
exchanges: [{"eid":"Futures_Binance","currency":"ETH_USDT"}]
|
|||
|
|
*/
|
|||
|
|
|
|||
|
|
//@version=5
|
|||
|
|
strategy("Black-Scholes Expected Breakout Enhanced Bias-Free", overlay=true, initial_capital=15000, currency=currency.USD, pyramiding=5, calc_on_order_fills=false, calc_on_every_tick=false, commission_type=strategy.commission.cash_per_contract, commission_value=0.12)
|
|||
|
|
|
|||
|
|
// User Inputs
|
|||
|
|
chartRes = input.int(title="Chart Timeframe in Minutes", defval=1, minval=1)
|
|||
|
|
volLookback = input.int(title="Volatility Lookback (bars)", defval=20, minval=1)
|
|||
|
|
stopLossPerc = input.float(title="Stop Loss (%)", defval=1.0, minval=0.1, step=0.1)
|
|||
|
|
takeProfitPerc = input.float(title="Take Profit (%)", defval=2.0, minval=0.1, step=0.1)
|
|||
|
|
useMAFilter = input.bool(title="Use MA Trend Filter", defval=true)
|
|||
|
|
maLength = input.int(title="MA Length", defval=20, minval=1)
|
|||
|
|
useTrailingStop = input.bool(title="Use Trailing Stop", defval=true)
|
|||
|
|
trailMultiplier = input.float(title="Trailing Stop Multiplier (Expected Move)", defval=1.0, minval=0.1, step=0.1)
|
|||
|
|
|
|||
|
|
// Calculate periods per year based on chart timeframe (252 trading days * 390 minutes per day)
|
|||
|
|
periodsPerYear = (252.0 * 390.0) / chartRes
|
|||
|
|
|
|||
|
|
// Calculate annualized volatility from log returns
|
|||
|
|
logReturn = math.log(close / close[1])
|
|||
|
|
volatility = ta.stdev(logReturn, volLookback) * math.sqrt(periodsPerYear)
|
|||
|
|
|
|||
|
|
// Expected move for one bar: previous close * volatility * √(1/periodsPerYear)
|
|||
|
|
expectedMove = close[1] * volatility * math.sqrt(1.0 / periodsPerYear)
|
|||
|
|
|
|||
|
|
// Define dynamic thresholds around the previous bar’s close
|
|||
|
|
upperThreshold = close[1] + expectedMove
|
|||
|
|
lowerThreshold = close[1] - expectedMove
|
|||
|
|
|
|||
|
|
// Plot thresholds for visual reference
|
|||
|
|
plot(upperThreshold, color=color.green, title="Upper Threshold")
|
|||
|
|
plot(lowerThreshold, color=color.red, title="Lower Threshold")
|
|||
|
|
|
|||
|
|
// Moving Average Filter for trend confirmation
|
|||
|
|
ma = ta.sma(close, maLength)
|
|||
|
|
plot(ma, color=color.blue, title="MA Filter")
|
|||
|
|
|
|||
|
|
// Fixed 5 contracts per trade
|
|||
|
|
longQty = 5
|
|||
|
|
shortQty = 5
|
|||
|
|
|
|||
|
|
// Only execute trades at the close of a bar to avoid intrabar look-ahead bias
|
|||
|
|
if barstate.isconfirmed
|
|||
|
|
// Long Condition
|
|||
|
|
longCondition = close > upperThreshold and (not useMAFilter or close > ma)
|
|||
|
|
if longCondition
|
|||
|
|
strategy.entry("Long", strategy.long, qty=longQty, comment="Long Entry")
|
|||
|
|
|
|||
|
|
// Short Condition
|
|||
|
|
shortCondition = close < lowerThreshold and (not useMAFilter or close < ma)
|
|||
|
|
if shortCondition
|
|||
|
|
strategy.entry("Short", strategy.short, qty=shortQty, comment="Short Entry")
|
|||
|
|
|
|||
|
|
// Exit Orders for Long Positions
|
|||
|
|
if strategy.position_size > 0
|
|||
|
|
if useTrailingStop
|
|||
|
|
// Trailing stop needs both trail_offset & trail_points
|
|||
|
|
trailOffset = expectedMove * trailMultiplier
|
|||
|
|
strategy.exit("Exit Long", from_entry="Long", trail_offset=trailOffset, trail_points=trailOffset)
|
|||
|
|
else
|
|||
|
|
stopPrice = strategy.position_avg_price * (1 - stopLossPerc / 100)
|
|||
|
|
takePrice = strategy.position_avg_price * (1 + takeProfitPerc / 100)
|
|||
|
|
strategy.exit("Exit Long", from_entry="Long", stop=stopPrice, limit=takePrice)
|
|||
|
|
|
|||
|
|
// Exit Orders for Short Positions
|
|||
|
|
if strategy.position_size < 0
|
|||
|
|
if useTrailingStop
|
|||
|
|
trailOffset = expectedMove * trailMultiplier
|
|||
|
|
strategy.exit("Exit Short", from_entry="Short", trail_offset=trailOffset, trail_points=trailOffset)
|
|||
|
|
else
|
|||
|
|
stopPrice = strategy.position_avg_price * (1 + stopLossPerc / 100)
|
|||
|
|
takePrice = strategy.position_avg_price * (1 - takeProfitPerc / 100)
|
|||
|
|
strategy.exit("Exit Short", from_entry="Short", stop=stopPrice, limit=takePrice)
|
|||
|
|
|
|||
|
|
```
|
|||
|
|
|
|||
|
|
> Detail
|
|||
|
|
|
|||
|
|
https://www.fmz.com/strategy/488275
|
|||
|
|
|
|||
|
|
> Last Modified
|
|||
|
|
|
|||
|
|
2025-03-26 14:34:45
|