463 lines
28 KiB
Markdown
463 lines
28 KiB
Markdown

|
|
||
|
|
> Name
|
||
|
|
|
||
|
|
海肯阿希趋势追踪策略多层级止损机制的多时间周期趋势识别系统-Heiken-Ashi-Trend-Following-Strategy-Multi-Timeframe-Trend-Identification-System-with-Multi-Layer-Stop-Loss-Mechanism
|
||
|
|
|
||
|
|
> Author
|
||
|
|
|
||
|
|
ianzeng123
|
||
|
|
|
||
|
|
> Strategy Description
|
||
|
|
|
||
|
|
|
||
|
|
|
||
|
|
|
||
|
|
|
||
|
|
|
||
|
|
[trans]
|
||
|
|
|
||
|
|
#### 概述
|
||
|
|
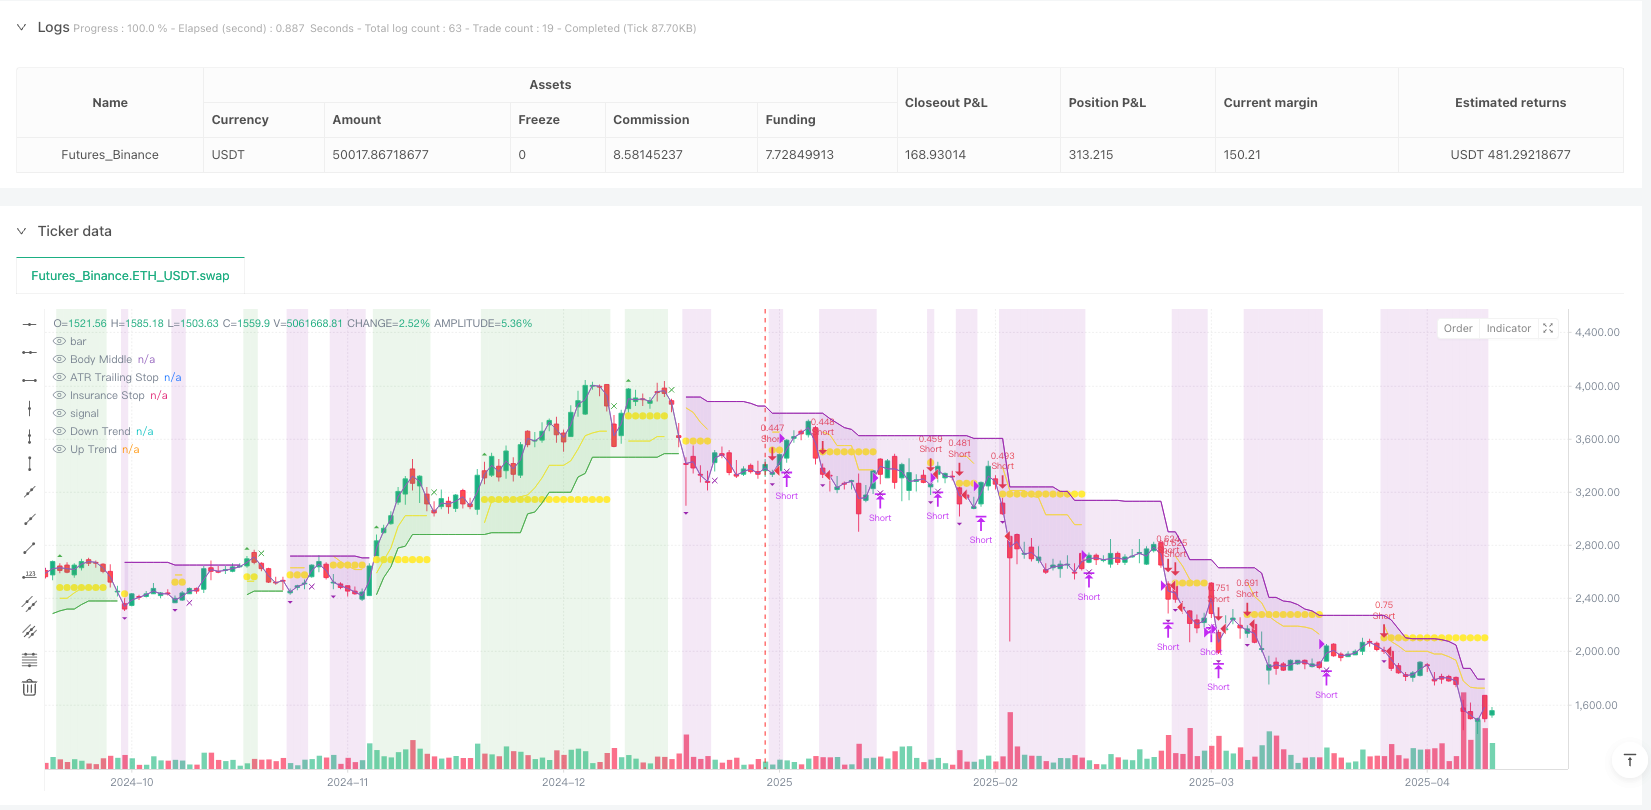
海肯阿希趋势追踪策略是一个综合性的交易系统,结合了海肯阿希蜡烛图、超级趋势指标和平均方向性指数(ADX)过滤器的优势,旨在识别强劲的趋势运动并进行有效的资金管理。该策略专注于捕捉已建立趋势中的动量,同时采用先进的三层止损机制来保护资金并锁定利润。该策略适用于多种交易品种,特别是在波动性较大的市场中表现出色。
|
||
|
|
|
||
|
|
#### 策略原理
|
||
|
|
海肯阿希趋势追踪策略基于三个核心技术指标的协同作用:
|
||
|
|
|
||
|
|
1. **海肯阿希蜡烛图分析**:该策略特别关注几乎没有上下影线的"实体"海肯阿希蜡烛,这些蜡烛表示价格在一个方向上果断移动,几乎没有回调,暗示强劲的动量和趋势延续。无下影线的绿色蜡烛被视为做多信号,无上影线的红色蜡烛被视为做空信号。
|
||
|
|
|
||
|
|
2. **超级趋势指标过滤**:系统使用超级趋势指标(默认因子:3.0,ATR周期:10)来确认潜在的趋势方向。入场信号必须与超级趋势方向一致,这增加了信号的可靠性,减少了错误交易。
|
||
|
|
|
||
|
|
3. **ADX过滤器(可选)**:平均方向性指数被用来评估趋势的强度,交易只在ADX超过指定阈值(默认:25)时触发,这有助于过滤掉震荡或横盘市场中的噪音信号。
|
||
|
|
|
||
|
|
交易系统拥有明确的入场和出场规则:
|
||
|
|
- **入场信号**:当满足以下条件时形成:(1)无下影线的绿色海肯阿希蜡烛(做多)或无上影线的红色海肯阿希蜡烛(做空);(2)超级趋势方向确认;(3)ADX阈值(如果启用)。
|
||
|
|
- **出场信号**:当出现相反方向的无影线蜡烛,或者任何一个止损机制触发时,交易结束。
|
||
|
|
|
||
|
|
该策略最显著的特点是其创新的三层止损系统:
|
||
|
|
1. **ATR跟踪止损**:基于市场波动性(ATR值)动态调整止损位置,随着趋势延伸锁定利润。
|
||
|
|
2. **摆动点止损**:利用市场自然结构(回顾期内的最近高点/低点)来设置止损位,尊重市场自身的节奏。
|
||
|
|
3. **保险止损**:基于入场价格的百分比设置的安全网,提供即时资本保护,特别是当摆动点止损位置可能距离入场点太远时。
|
||
|
|
|
||
|
|
#### 策略优势
|
||
|
|
1. **多层风险管理**:三层止损系统提供了全面的资金保护,适应不同的市场条件和风险情景,这是该策略最显著的优势。
|
||
|
|
|
||
|
|
2. **适应性强**:所有组件(超级趋势、ADX)都可以根据不同市场条件启用/禁用,参数也可以调整,使策略具有很高的灵活性。
|
||
|
|
|
||
|
|
3. **强大的趋势捕捉能力**:通过结合海肯阿希蜡烛的清晰视觉信号、超级趋势的确认和ADX的趋势强度评估,该策略能够有效识别强劲的趋势移动。
|
||
|
|
|
||
|
|
4. **清晰的视觉反馈**:策略在图表上显示位置状态、入场价格和当前止损水平,使交易者能够直观地理解和跟踪策略执行情况。
|
||
|
|
|
||
|
|
5. **内置资金管理**:策略采用基于权益百分比的仓位管理方法(默认:3%),这确保了随着账户规模的变化,风险敞口保持一致。
|
||
|
|
|
||
|
|
6. **完整的交易系统**:提供从入场信号到出场规则的完整交易流程,无需额外的决策或指标。
|
||
|
|
|
||
|
|
#### 策略风险
|
||
|
|
1. **过度优化风险**:策略包含多个可调参数,这可能导致曲线拟合问题,即策略在历史数据上表现良好,但在实时交易中效果不佳。解决方法是使用足够长的历史数据进行回测,并在不同市场条件下测试策略的稳健性。
|
||
|
|
|
||
|
|
2. **趋势反转风险**:尽管拥有多层止损机制,该策略在强劲趋势突然反转时仍可能面临较大的回撤。市场突发的极端波动可能导致止损未能及时触发,造成损失超出预期。解决方法是考虑增加波动率过滤器或实施更严格的风险管理规则。
|
||
|
|
|
||
|
|
3. **参数敏感性**:不同的参数设置可能导致截然不同的结果,特别是超级趋势因子和ADX阈值。这要求交易者深入了解每个参数的影响,并找到适合特定市场环境的平衡点。
|
||
|
|
|
||
|
|
4. **低波动环境表现不佳**:在低波动性或横盘市场中,该策略可能产生多次错误信号,导致"锯齿"交易。解决方法是在此类环境中暂停交易,或增加额外的市场环境过滤器。
|
||
|
|
|
||
|
|
5. **资金管理风险**:固定百分比的仓位管理可能不适合所有市场环境,在高度波动的市场中可能需要减少仓位大小以控制风险。
|
||
|
|
|
||
|
|
#### 策略优化方向
|
||
|
|
1. **增加波动性适应机制**:当前策略可以通过引入波动性过滤器进一步优化,例如历史波动率(HV)或隐含波动率(IV)指标,以便在不同的市场环境中自动调整参数。这将使策略能够在高波动和低波动期间都保持稳定表现。
|
||
|
|
|
||
|
|
2. **整合时间过滤器**:考虑添加基于时间的过滤器,避免在已知波动性较低或市场趋势性较弱的时间段进行交易。这对于交易特定品种尤其有用,因为不同品种在一天中的不同时间段表现出不同的行为特征。
|
||
|
|
|
||
|
|
3. **引入机器学习优化**:可以使用机器学习技术自动识别最佳参数组合,而不是依赖静态参数设置。这可以通过分析历史数据中的模式来预测哪些参数设置在未来特定市场条件下可能表现最佳。
|
||
|
|
|
||
|
|
4. **增加相关市场过滤器**:通过观察相关市场或指数的行为来增强入场信号,例如在交易特定品种时考虑整体市场趋势或相关市场的强弱。
|
||
|
|
|
||
|
|
5. **优化止损机制**:当前三层止损系统可以进一步优化,例如基于波动性动态调整保险止损百分比,或使用支撑/阻力水平来精确设置摆动点止损,而不是简单的回顾期高低点。
|
||
|
|
|
||
|
|
6. **整合交易量分析**:在信号确认过程中添加交易量过滤器,确保价格走势得到足够的交易量支持,从而提高信号的可靠性。
|
||
|
|
|
||
|
|
#### 总结
|
||
|
|
海肯阿希趋势追踪策略是一个复杂而全面的交易系统,通过海肯阿希蜡烛图、超级趋势指标和ADX过滤器的独特组合,专注于捕捉强势趋势中的动量机会。其三层止损系统提供了全面的风险管理,同时其可定制的参数设置使其能够适应各种市场条件。
|
||
|
|
|
||
|
|
该策略的主要优势在于其清晰的视觉信号、强大的趋势识别能力以及全面的资金保护机制。然而,交易者应意识到参数优化的挑战以及在低波动性环境中的潜在局限性。
|
||
|
|
|
||
|
|
通过实施建议的优化方向,如增加波动性适应机制、整合时间过滤器和交易量分析,该策略可以进一步增强其稳健性和适应性。最终,海肯阿希趋势追踪策略代表了一种平衡的方法,结合了技术分析的清晰信号和系统化风险管理的原则,为趋势跟踪交易者提供了一个有价值的工具。 ||
|
||
|
|
|
||
|
|
#### Overview
|
||
|
|
The Heiken Ashi Trend Following Strategy is a comprehensive trading system that combines the strengths of Heiken Ashi candles, Supertrend indicator, and Average Directional Index (ADX) filter to identify strong trend movements and effectively manage capital. The strategy focuses on capturing momentum in established trends while employing an advanced three-layer stop loss mechanism to protect capital and secure profits. This strategy is applicable to various trading instruments, particularly excelling in markets with significant volatility.
|
||
|
|
|
||
|
|
#### Strategy Principle
|
||
|
|
The Heiken Ashi Trend Following Strategy is based on the synergistic action of three core technical indicators:
|
||
|
|
|
||
|
|
1. **Heiken Ashi Candle Analysis**: The strategy specifically looks for "full-bodied" Heiken Ashi candles with minimal or no wicks, which indicate decisive price movement in one direction with minimal retracement, suggesting strong momentum and trend continuation. Green candles with no bottom wick are considered long signals, while red candles with no top wick are considered short signals.
|
||
|
|
|
||
|
|
2. **Supertrend Indicator Filter**: The system uses the Supertrend indicator (default factor: 3.0, ATR period: 10) to confirm the underlying trend direction. Entry signals must align with the prevailing Supertrend direction, which increases signal reliability and reduces false trades.
|
||
|
|
|
||
|
|
3. **ADX Filter (Optional)**: The Average Directional Index is used to assess trend strength, with trades only triggering when ADX exceeds a specified threshold (default: 25), helping filter out noise signals in choppy or ranging markets.
|
||
|
|
|
||
|
|
The trading system has clear entry and exit rules:
|
||
|
|
- **Entry Signals**: Form when the following conditions are met: (1) Green Heiken Ashi candle with no bottom wick (for long) or red candle with no top wick (for short); (2) Supertrend direction confirmation; (3) ADX threshold (if enabled).
|
||
|
|
- **Exit Signals**: Positions are closed when either an opposing candle with no wick appears in the opposite direction, or any of the stop loss mechanisms are triggered.
|
||
|
|
|
||
|
|
The most notable feature of this strategy is its innovative triple-layer stop loss system:
|
||
|
|
1. **ATR Trailing Stop**: Dynamically adjusts the stop loss position based on market volatility (ATR value), locking in profits as the trend extends.
|
||
|
|
2. **Swing Point Stop**: Uses natural market structure (recent highs/lows over a lookback period) to place stops at logical support/resistance levels, respecting the market's own rhythm.
|
||
|
|
3. **Insurance Stop**: A safety net based on a percentage of the entry price, providing immediate capital protection, particularly when the swing point stop might be positioned too far from entry.
|
||
|
|
|
||
|
|
#### Strategy Advantages
|
||
|
|
1. **Multi-layer Risk Management**: The three-tier stop loss system provides comprehensive capital protection, adapting to different market conditions and risk scenarios, which is the most prominent advantage of this strategy.
|
||
|
|
|
||
|
|
2. **High Adaptability**: All components (Supertrend, ADX) can be enabled/disabled based on different market conditions, and parameters can be adjusted, giving the strategy significant flexibility.
|
||
|
|
|
||
|
|
3. **Strong Trend Capture Capability**: By combining clear visual signals from Heiken Ashi candles, confirmation from Supertrend, and trend strength assessment from ADX, the strategy can effectively identify strong trend movements.
|
||
|
|
|
||
|
|
4. **Clear Visual Feedback**: The strategy displays position status, entry prices, and current stop levels on the chart, allowing traders to intuitively understand and track strategy execution.
|
||
|
|
|
||
|
|
5. **Built-in Capital Management**: The strategy adopts a position sizing method based on equity percentage (default: 3%), ensuring consistent risk exposure as account size changes.
|
||
|
|
|
||
|
|
6. **Complete Trading System**: Provides a complete trading process from entry signals to exit rules, requiring no additional decision-making or indicators.
|
||
|
|
|
||
|
|
#### Strategy Risks
|
||
|
|
1. **Over-optimization Risk**: The strategy includes multiple adjustable parameters, which may lead to curve-fitting issues, where the strategy performs well on historical data but poorly in live trading. The solution is to use sufficiently long historical data for backtesting and test the strategy's robustness under different market conditions.
|
||
|
|
|
||
|
|
2. **Trend Reversal Risk**: Despite having multiple stop loss mechanisms, the strategy may still face significant drawdowns when a strong trend suddenly reverses. Extreme market volatility may cause stop losses to not trigger in time, resulting in losses exceeding expectations. The solution is to consider adding volatility filters or implementing stricter risk management rules.
|
||
|
|
|
||
|
|
3. **Parameter Sensitivity**: Different parameter settings may lead to drastically different results, especially the Supertrend factor and ADX threshold. This requires traders to deeply understand the impact of each parameter and find a balance point suitable for specific market environments.
|
||
|
|
|
||
|
|
4. **Poor Performance in Low Volatility Environments**: In low volatility or ranging markets, the strategy may generate multiple false signals, leading to "whipsaw" trading. The solution is to pause trading in such environments or add additional market environment filters.
|
||
|
|
|
||
|
|
5. **Capital Management Risk**: Fixed percentage position sizing may not be suitable for all market environments, and in highly volatile markets, it may be necessary to reduce position size to control risk.
|
||
|
|
|
||
|
|
#### Strategy Optimization Directions
|
||
|
|
1. **Add Volatility Adaptation Mechanism**: The current strategy can be further optimized by introducing volatility filters, such as Historical Volatility (HV) or Implied Volatility (IV) indicators, to automatically adjust parameters in different market environments. This will enable the strategy to maintain stable performance during both high and low volatility periods.
|
||
|
|
|
||
|
|
2. **Integrate Time Filters**: Consider adding time-based filters to avoid trading during known periods of lower volatility or weaker trend characteristics. This is particularly useful for trading specific instruments, as different instruments exhibit different behavioral characteristics at different times of the day.
|
||
|
|
|
||
|
|
3. **Introduce Machine Learning Optimization**: Machine learning techniques can be used to automatically identify optimal parameter combinations rather than relying on static parameter settings. This can be done by analyzing patterns in historical data to predict which parameter settings might perform best under specific future market conditions.
|
||
|
|
|
||
|
|
4. **Add Related Market Filters**: Enhance entry signals by observing the behavior of related markets or indices, such as considering overall market trends or the strength/weakness of related markets when trading specific instruments.
|
||
|
|
|
||
|
|
5. **Optimize Stop Loss Mechanisms**: The current three-layer stop loss system can be further optimized, for example, by dynamically adjusting the insurance stop percentage based on volatility, or using support/resistance levels to precisely set swing point stops rather than simple lookback period highs/lows.
|
||
|
|
|
||
|
|
6. **Integrate Volume Analysis**: Add volume filters in the signal confirmation process to ensure price movements are supported by sufficient trading volume, thereby improving signal reliability.
|
||
|
|
|
||
|
|
#### Summary
|
||
|
|
The Heiken Ashi Trend Following Strategy is a sophisticated and comprehensive trading system that focuses on capturing momentum opportunities in strong trends through a unique combination of Heiken Ashi candles, Supertrend indicator, and ADX filter. Its three-layer stop loss system provides comprehensive risk management, while its customizable parameter settings allow it to adapt to various market conditions.
|
||
|
|
|
||
|
|
The main advantages of the strategy lie in its clear visual signals, powerful trend identification capabilities, and comprehensive capital protection mechanisms. However, traders should be aware of the challenges of parameter optimization and potential limitations in low volatility environments.
|
||
|
|
|
||
|
|
By implementing the suggested optimization directions, such as adding volatility adaptation mechanisms, integrating time filters, and volume analysis, the strategy can further enhance its robustness and adaptability. Ultimately, the Heiken Ashi Trend Following Strategy represents a balanced approach, combining clear signals from technical analysis with principles of systematic risk management, providing a valuable tool for trend-following traders.[/trans]
|
||
|
|
|
||
|
|
|
||
|
|
|
||
|
|
> Source (PineScript)
|
||
|
|
|
||
|
|
``` pinescript
|
||
|
|
/*backtest
|
||
|
|
start: 2025-01-01 00:00:00
|
||
|
|
end: 2025-04-12 08:00:00
|
||
|
|
period: 1d
|
||
|
|
basePeriod: 1d
|
||
|
|
exchanges: [{"eid":"Futures_Binance","currency":"ETH_USDT"}]
|
||
|
|
*/
|
||
|
|
|
||
|
|
//@version=5
|
||
|
|
strategy("Heiken Ashi Supertrend ADX - Strategy", overlay=true, initial_capital=1000, commission_type=strategy.commission.percent, commission_value=0, calc_on_every_tick=true, process_orders_on_close=false, default_qty_type=strategy.percent_of_equity, default_qty_value=3)
|
||
|
|
|
||
|
|
|
||
|
|
// Supertrend Settings
|
||
|
|
useSupertrend = input.bool(true, "Use Supertrend for Entries", group="Supertrend Settings")
|
||
|
|
atrPeriod = input.int(10, "ATR Period", minval=1, group="Supertrend Settings")
|
||
|
|
factor = input.float(3.0, "Supertrend Factor", minval=0.5, step=0.1, group="Supertrend Settings")
|
||
|
|
|
||
|
|
// ADX Filter Settings
|
||
|
|
useAdxFilter = input.bool(false, "Use ADX Filter", group="ADX Filter")
|
||
|
|
adxPeriod = input.int(14, "ADX Period", minval=1, group="ADX Filter")
|
||
|
|
adxThreshold = input.float(25, "ADX Threshold", minval=0, group="ADX Filter")
|
||
|
|
|
||
|
|
// Stop Loss Options
|
||
|
|
useSwingStop = input.bool(false, "Use Swing Point Stop", group="Stop Loss Options")
|
||
|
|
swingLookback = input.int(3, "Swing Lookback Periods", minval=1, maxval=20, group="Stop Loss Options")
|
||
|
|
|
||
|
|
useSafetyNetStop = input.bool(true, "Use Insurance Stop", group="Stop Loss Options")
|
||
|
|
safetyNetPercent = input.float(5.0, "Insurance Stop Loss Percent", minval=0.1, step=0.1, group="Stop Loss Options")
|
||
|
|
|
||
|
|
// Trailing Stop Loss Settings
|
||
|
|
useTrailingStop = input.bool(true, "Use ATR Trailing Stop", group="Stop Loss Options")
|
||
|
|
trailAtrMultiplier = input.float(2.0, "Trailing Stop ATR Multiplier", minval=0.1, step=0.1, group="Stop Loss Options")
|
||
|
|
|
||
|
|
// Get HA data for signals
|
||
|
|
ha_security = ticker.heikinashi(syminfo.tickerid)
|
||
|
|
[o, h, l, c] = request.security(ha_security, timeframe.period, [open, high, low, close])
|
||
|
|
|
||
|
|
// Get real price data
|
||
|
|
real_open = open
|
||
|
|
real_high = high
|
||
|
|
real_low = low
|
||
|
|
real_close = close
|
||
|
|
|
||
|
|
// Calculate Supertrend using built-in function with real price data
|
||
|
|
[supertrend, direction] = ta.supertrend(factor, atrPeriod)
|
||
|
|
supertrend := barstate.isfirst ? na : supertrend
|
||
|
|
|
||
|
|
// Determine if we're in an uptrend or downtrend based on Supertrend
|
||
|
|
isUptrend = direction < 0 // In TradingView, negative direction means uptrend
|
||
|
|
isDowntrend = direction > 0 // In TradingView, positive direction means downtrend
|
||
|
|
|
||
|
|
// Calculate ATR for visualization
|
||
|
|
atrValue = ta.atr(atrPeriod)
|
||
|
|
|
||
|
|
// Calculate ADX and Trade Logic
|
||
|
|
[diplus, diminus, adx] = ta.dmi(adxPeriod, adxPeriod)
|
||
|
|
int trade = 0
|
||
|
|
if trade == 0 and diplus > diminus
|
||
|
|
trade := 1
|
||
|
|
else if trade == 0 and diminus > diplus
|
||
|
|
trade := -1
|
||
|
|
else if trade == 1 and diminus > diplus
|
||
|
|
trade := -1
|
||
|
|
else if trade == -1 and diplus > diminus
|
||
|
|
trade := 1
|
||
|
|
else
|
||
|
|
trade := trade[1]
|
||
|
|
|
||
|
|
// Combine with ADX Threshold
|
||
|
|
isAdxBullish = diplus > diminus and adx > adxThreshold
|
||
|
|
isAdxBearish = diminus > diplus and adx > adxThreshold
|
||
|
|
|
||
|
|
// Debug ADX Values (only if needed for development)
|
||
|
|
// plot(adx, "ADX", color=color.orange, linewidth=1)
|
||
|
|
// plot(diplus, "DI+", color=color.green, linewidth=1)
|
||
|
|
// plot(diminus, "DI-", color=color.red, linewidth=1)
|
||
|
|
// hline(adxThreshold, "ADX Threshold", color=color.gray, linestyle=hline.style_dashed)
|
||
|
|
|
||
|
|
// Check for wicks on the current candle
|
||
|
|
threshold = syminfo.mintick * 0.1
|
||
|
|
noBottomWick = math.abs(math.min(o, c) - l) <= threshold
|
||
|
|
noTopWick = math.abs(h - math.max(o, c)) <= threshold
|
||
|
|
|
||
|
|
// Identify candle color and signal conditions
|
||
|
|
isGreenCandle = c > o
|
||
|
|
isRedCandle = c < o
|
||
|
|
|
||
|
|
// KEY INTEGRATION: Color the real bars based on HA trend
|
||
|
|
bullishColor = color.green // Green for long/bullish
|
||
|
|
bearishColor = color.purple // Purple for short/bearish
|
||
|
|
barcolor(isGreenCandle ? bullishColor : bearishColor)
|
||
|
|
|
||
|
|
// Signal conditions for both entry and exit
|
||
|
|
longCondition = (isGreenCandle and noBottomWick and barstate.isconfirmed) and (not useSupertrend or isUptrend) and (not useAdxFilter or isAdxBullish)
|
||
|
|
|
||
|
|
shortCondition = (isRedCandle and noTopWick and barstate.isconfirmed) and (not useSupertrend or isDowntrend) and (not useAdxFilter or isAdxBearish)
|
||
|
|
|
||
|
|
exitLongCondition = isRedCandle and noTopWick and barstate.isconfirmed
|
||
|
|
exitShortCondition = isGreenCandle and noBottomWick and barstate.isconfirmed
|
||
|
|
|
||
|
|
// Calculate swing points based on real candles (not HA)
|
||
|
|
swingLow = ta.lowest(real_low, swingLookback)
|
||
|
|
swingHigh = ta.highest(real_high, swingLookback)
|
||
|
|
|
||
|
|
// Position tracking
|
||
|
|
var int position = 0 // 0 = no position, 1 = long, -1 = short
|
||
|
|
var float entryPrice = na
|
||
|
|
var float trailStopLevel = na // For ATR trailing stop
|
||
|
|
var float swingStopLevel = na // For swing point stop
|
||
|
|
var float safetyNetStopLevel = na // For safety net stop
|
||
|
|
var float highestSinceEntry = na // For tracking highest price since entry (for long positions)
|
||
|
|
var float lowestSinceEntry = na // For tracking lowest price since entry (for short positions)
|
||
|
|
|
||
|
|
// Alert variables
|
||
|
|
var bool longAlert = false
|
||
|
|
var bool shortAlert = false
|
||
|
|
var bool exitLongAlert = false
|
||
|
|
var bool exitShortAlert = false
|
||
|
|
|
||
|
|
// Reset alerts each bar
|
||
|
|
longAlert := false
|
||
|
|
shortAlert := false
|
||
|
|
exitLongAlert := false
|
||
|
|
exitShortAlert := false
|
||
|
|
|
||
|
|
// Handle entries and exits
|
||
|
|
if longCondition and (position <= 0)
|
||
|
|
if position < 0
|
||
|
|
exitShortAlert := true
|
||
|
|
strategy.close("Short", comment="Exit Short")
|
||
|
|
position := 0
|
||
|
|
longAlert := true
|
||
|
|
strategy.entry("Long", strategy.long, comment="Enter Long")
|
||
|
|
position := 1
|
||
|
|
entryPrice := real_close
|
||
|
|
highestSinceEntry := real_close
|
||
|
|
lowestSinceEntry := na
|
||
|
|
// Initialize trailing stops
|
||
|
|
if useTrailingStop
|
||
|
|
trailStopLevel := real_close - (atrValue * trailAtrMultiplier)
|
||
|
|
// Initialize swing point stop
|
||
|
|
if useSwingStop
|
||
|
|
swingStopLevel := swingLow
|
||
|
|
// Initialize safety net stop
|
||
|
|
if useSafetyNetStop
|
||
|
|
safetyNetStopLevel := real_close * (1 - safetyNetPercent / 100)
|
||
|
|
|
||
|
|
if shortCondition and (position >= 0)
|
||
|
|
if position > 0
|
||
|
|
exitLongAlert := true
|
||
|
|
strategy.close("Long", comment="Exit Long")
|
||
|
|
position := 0
|
||
|
|
shortAlert := true
|
||
|
|
strategy.entry("Short", strategy.short, comment="Enter Short")
|
||
|
|
position := -1
|
||
|
|
entryPrice := real_close
|
||
|
|
highestSinceEntry := na
|
||
|
|
lowestSinceEntry := real_close
|
||
|
|
// Initialize trailing stops
|
||
|
|
if useTrailingStop
|
||
|
|
trailStopLevel := real_close + (atrValue * trailAtrMultiplier)
|
||
|
|
// Initialize swing point stop
|
||
|
|
if useSwingStop
|
||
|
|
swingStopLevel := swingHigh
|
||
|
|
// Initialize safety net stop
|
||
|
|
if useSafetyNetStop
|
||
|
|
safetyNetStopLevel := real_close * (1 + safetyNetPercent / 100)
|
||
|
|
|
||
|
|
if position > 0 and exitLongCondition
|
||
|
|
exitLongAlert := true
|
||
|
|
strategy.close("Long", comment="Exit Long Signal")
|
||
|
|
position := 0
|
||
|
|
trailStopLevel := na
|
||
|
|
swingStopLevel := na
|
||
|
|
safetyNetStopLevel := na
|
||
|
|
highestSinceEntry := na
|
||
|
|
|
||
|
|
if position < 0 and exitShortCondition
|
||
|
|
exitShortAlert := true
|
||
|
|
strategy.close("Short", comment="Exit Short Signal")
|
||
|
|
position := 0
|
||
|
|
trailStopLevel := na
|
||
|
|
swingStopLevel := na
|
||
|
|
safetyNetStopLevel := na
|
||
|
|
lowestSinceEntry := na
|
||
|
|
|
||
|
|
// Check for swing point stop hit
|
||
|
|
if useSwingStop and position != 0 and not na(swingStopLevel)
|
||
|
|
// For long positions, check if price drops below the swing low
|
||
|
|
if position > 0 and real_low <= swingStopLevel
|
||
|
|
strategy.close("Long", comment="Swing Point Stop Hit")
|
||
|
|
position := 0
|
||
|
|
trailStopLevel := na
|
||
|
|
swingStopLevel := na
|
||
|
|
safetyNetStopLevel := na
|
||
|
|
highestSinceEntry := na
|
||
|
|
|
||
|
|
// For short positions, check if price rises above the swing high
|
||
|
|
else if position < 0 and real_high >= swingStopLevel
|
||
|
|
strategy.close("Short", comment="Swing Point Stop Hit")
|
||
|
|
position := 0
|
||
|
|
trailStopLevel := na
|
||
|
|
swingStopLevel := na
|
||
|
|
safetyNetStopLevel := na
|
||
|
|
lowestSinceEntry := na
|
||
|
|
|
||
|
|
// Check for safety net stop loss hit
|
||
|
|
if useSafetyNetStop and position != 0 and not na(safetyNetStopLevel)
|
||
|
|
// For long positions, check if price drops below the safety net level
|
||
|
|
if position > 0 and real_low <= safetyNetStopLevel
|
||
|
|
strategy.close("Long", comment="Safety Net Stop Hit")
|
||
|
|
position := 0
|
||
|
|
trailStopLevel := na
|
||
|
|
swingStopLevel := na
|
||
|
|
safetyNetStopLevel := na
|
||
|
|
highestSinceEntry := na
|
||
|
|
|
||
|
|
// For short positions, check if price rises above the safety net level
|
||
|
|
else if position < 0 and real_high >= safetyNetStopLevel
|
||
|
|
strategy.close("Short", comment="Safety Net Stop Hit")
|
||
|
|
position := 0
|
||
|
|
trailStopLevel := na
|
||
|
|
swingStopLevel := na
|
||
|
|
safetyNetStopLevel := na
|
||
|
|
lowestSinceEntry := na
|
||
|
|
|
||
|
|
// Track highest/lowest prices for trailing stop calculation
|
||
|
|
if position > 0 and not na(highestSinceEntry)
|
||
|
|
highestSinceEntry := math.max(highestSinceEntry, real_high)
|
||
|
|
|
||
|
|
if position < 0 and not na(lowestSinceEntry)
|
||
|
|
lowestSinceEntry := math.min(lowestSinceEntry, real_low)
|
||
|
|
|
||
|
|
// Update and check trailing stop (ATR-based)
|
||
|
|
if useTrailingStop and position != 0 and not na(trailStopLevel)
|
||
|
|
// Update trailing stop level for long positions
|
||
|
|
if position > 0
|
||
|
|
// Calculate new potential trailing stop level
|
||
|
|
trailStopNew = real_close - (atrValue * trailAtrMultiplier)
|
||
|
|
// Only move the stop up, never down
|
||
|
|
if trailStopNew > trailStopLevel
|
||
|
|
trailStopLevel := trailStopNew
|
||
|
|
// Check if price hit stop
|
||
|
|
if real_low <= trailStopLevel
|
||
|
|
strategy.close("Long", comment="ATR Trailing Stop Hit")
|
||
|
|
position := 0
|
||
|
|
trailStopLevel := na
|
||
|
|
swingStopLevel := na
|
||
|
|
safetyNetStopLevel := na
|
||
|
|
highestSinceEntry := na
|
||
|
|
|
||
|
|
// Update trailing stop level for short positions
|
||
|
|
else if position < 0
|
||
|
|
// Calculate new potential trailing stop level
|
||
|
|
trailStopNew = real_close + (atrValue * trailAtrMultiplier)
|
||
|
|
// Only move the stop down, never up
|
||
|
|
if trailStopNew < trailStopLevel
|
||
|
|
trailStopLevel := trailStopNew
|
||
|
|
// Check if price hit stop
|
||
|
|
if real_high >= trailStopLevel
|
||
|
|
strategy.close("Short", comment="ATR Trailing Stop Hit")
|
||
|
|
position := 0
|
||
|
|
trailStopLevel := na
|
||
|
|
swingStopLevel := na
|
||
|
|
safetyNetStopLevel := na
|
||
|
|
lowestSinceEntry := na
|
||
|
|
|
||
|
|
// Plot stop loss levels
|
||
|
|
plot(useTrailingStop and position != 0 ? trailStopLevel : na, "ATR Trailing Stop", color=color.yellow, style=plot.style_linebr, linewidth=1)
|
||
|
|
plot(useSwingStop and position != 0 ? swingStopLevel : na, "Swing Point Stop", color=color.red, style=plot.style_circles, linewidth=2)
|
||
|
|
plot(useSafetyNetStop and position != 0 ? safetyNetStopLevel : na, "Insurance Stop", color=color.yellow, style=plot.style_circles, linewidth=1)
|
||
|
|
|
||
|
|
// Visual signals for chart (just entry/exit markers, no ADX labels)
|
||
|
|
plotshape(longAlert, title="Long Entry", location=location.abovebar, color=bullishColor, style=shape.triangleup, size=size.small)
|
||
|
|
plotshape(shortAlert, title="Short Entry", location=location.belowbar, color=bearishColor, style=shape.triangledown, size=size.small)
|
||
|
|
plotshape(exitLongAlert, title="Long Exit Signal", location=location.abovebar, color=bullishColor, style=shape.xcross, size=size.small)
|
||
|
|
plotshape(exitShortAlert, title="Short Exit Signal", location=location.belowbar, color=bearishColor, style=shape.xcross, size=size.small)
|
||
|
|
|
||
|
|
// Supertrend visualization
|
||
|
|
bodyMiddlePlot = plot((real_open + real_close) / 2, "Body Middle", display=display.none)
|
||
|
|
upTrend = plot(useSupertrend and isUptrend ? supertrend : na, "Up Trend", color=bullishColor, style=plot.style_linebr, linewidth=1)
|
||
|
|
downTrend = plot(useSupertrend and isDowntrend ? supertrend : na, "Down Trend", color=bearishColor, style=plot.style_linebr, linewidth=1)
|
||
|
|
fill(upTrend, bodyMiddlePlot, color=useSupertrend ? color.new(bullishColor, 85) : na, title="Uptrend Background")
|
||
|
|
fill(downTrend, bodyMiddlePlot, color=useSupertrend ? color.new(bearishColor, 85) : na, title="Downtrend Background")
|
||
|
|
|
||
|
|
// Position background
|
||
|
|
bgcolor(position == 1 ? color.new(bullishColor, 85) : position == -1 ? color.new(bearishColor, 85) : na, title="Position Background")
|
||
|
|
|
||
|
|
// Position label
|
||
|
|
var label positionLabel = na
|
||
|
|
label.delete(positionLabel)
|
||
|
|
if barstate.islast
|
||
|
|
positionText = position == 1 ? "LONG" : position == -1 ? "SHORT" : "FLAT"
|
||
|
|
entryInfo = not na(entryPrice) ? "\nEntry: " + str.tostring(entryPrice, "#.00000") : ""
|
||
|
|
atrStopInfo = useTrailingStop and not na(trailStopLevel) ? "\nATR Stop: " + str.tostring(trailStopLevel, "#.00000") + " (" + str.tostring(trailAtrMultiplier, "#.0") + "x ATR)" : ""
|
||
|
|
swingStopInfo = useSwingStop and not na(swingStopLevel) ? "\nSwing Stop: " + str.tostring(swingStopLevel, "#.00000") + " (" + str.tostring(swingLookback) + " bars)" : ""
|
||
|
|
safetyNetInfo = useSafetyNetStop and not na(safetyNetStopLevel) ? "\nInsurance Stop: " + str.tostring(safetyNetStopLevel, "#.00000") + " (" + str.tostring(safetyNetPercent, "#.0") + "%)" : ""
|
||
|
|
supertrendInfo = useSupertrend ? "\nSupertrend: " + (isUptrend ? "UPTREND" : "DOWNTREND") : ""
|
||
|
|
positionColor = position == 1 ? bullishColor : position == -1 ? bearishColor : color.gray
|
||
|
|
positionLabel := label.new(bar_index, high, positionText + entryInfo + atrStopInfo + swingStopInfo + safetyNetInfo + supertrendInfo, color=positionColor, style=label.style_label_down, textcolor=color.white)
|
||
|
|
```
|
||
|
|
|
||
|
|
> Detail
|
||
|
|
|
||
|
|
https://www.fmz.com/strategy/490519
|
||
|
|
|
||
|
|
> Last Modified
|
||
|
|
|
||
|
|
2025-04-14 11:31:37
|