172 lines
9.1 KiB
Markdown
172 lines
9.1 KiB
Markdown

|
|
||
|
|
> Name
|
||
|
|
|
||
|
|
多重指标协同交易系统-基于趋势动量复合信号策略-Multi-Indicator-Synergy-Trading-System-Trend-Momentum-Composite-Signal-Strategy
|
||
|
|
|
||
|
|
> Author
|
||
|
|
|
||
|
|
ianzeng123
|
||
|
|
|
||
|
|
> Strategy Description
|
||
|
|
|
||
|
|
|
||
|
|
|
||
|
|
|
||
|
|
|
||
|
|
|
||
|
|
|
||
|
|
[trans]
|
||
|
|
#### 概述
|
||
|
|
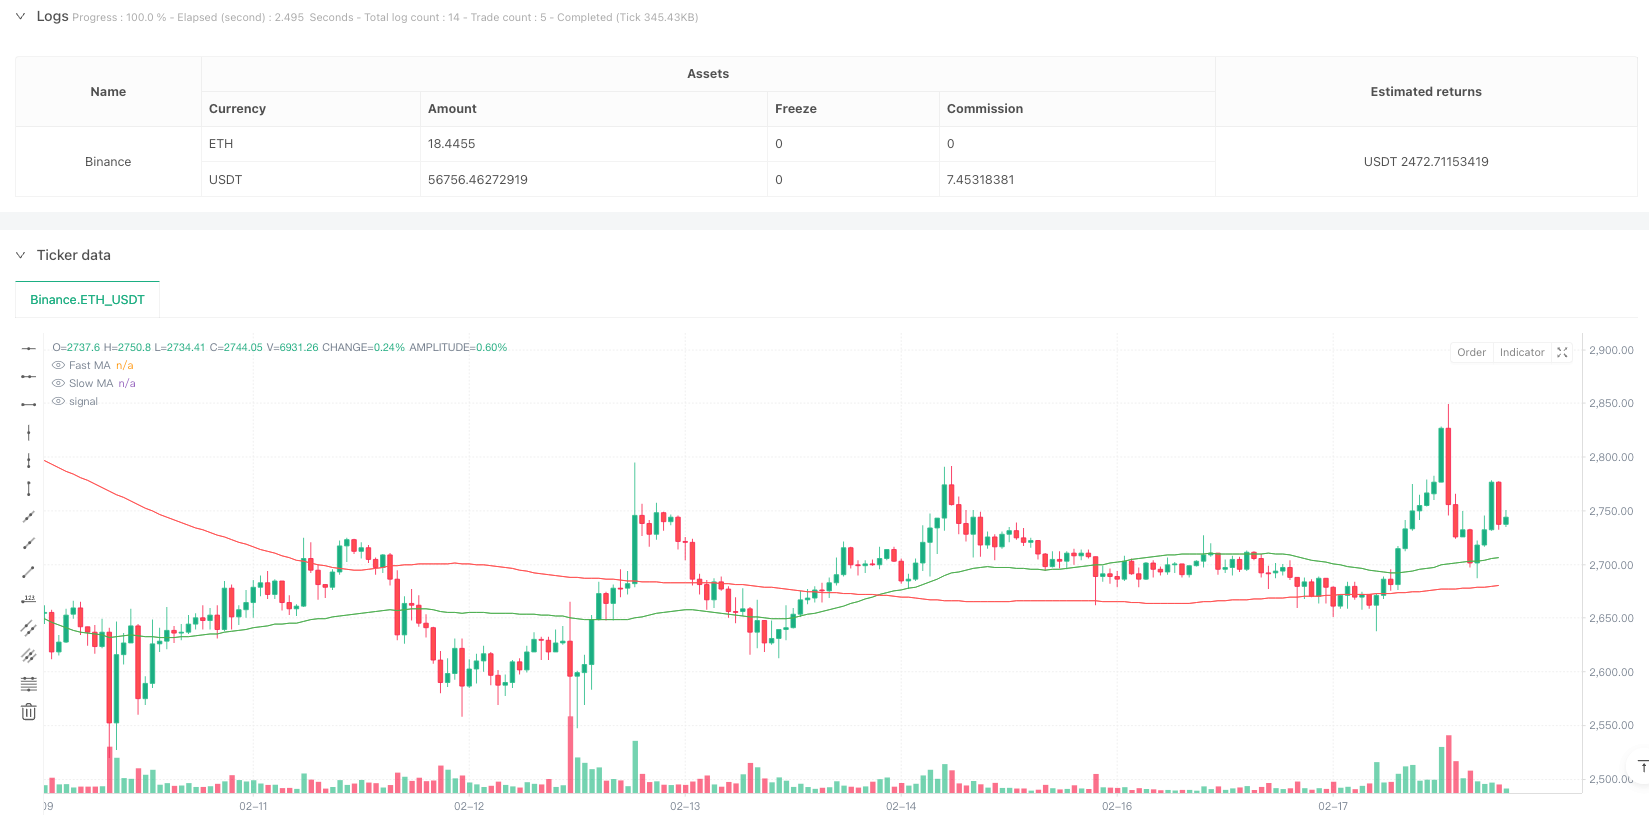
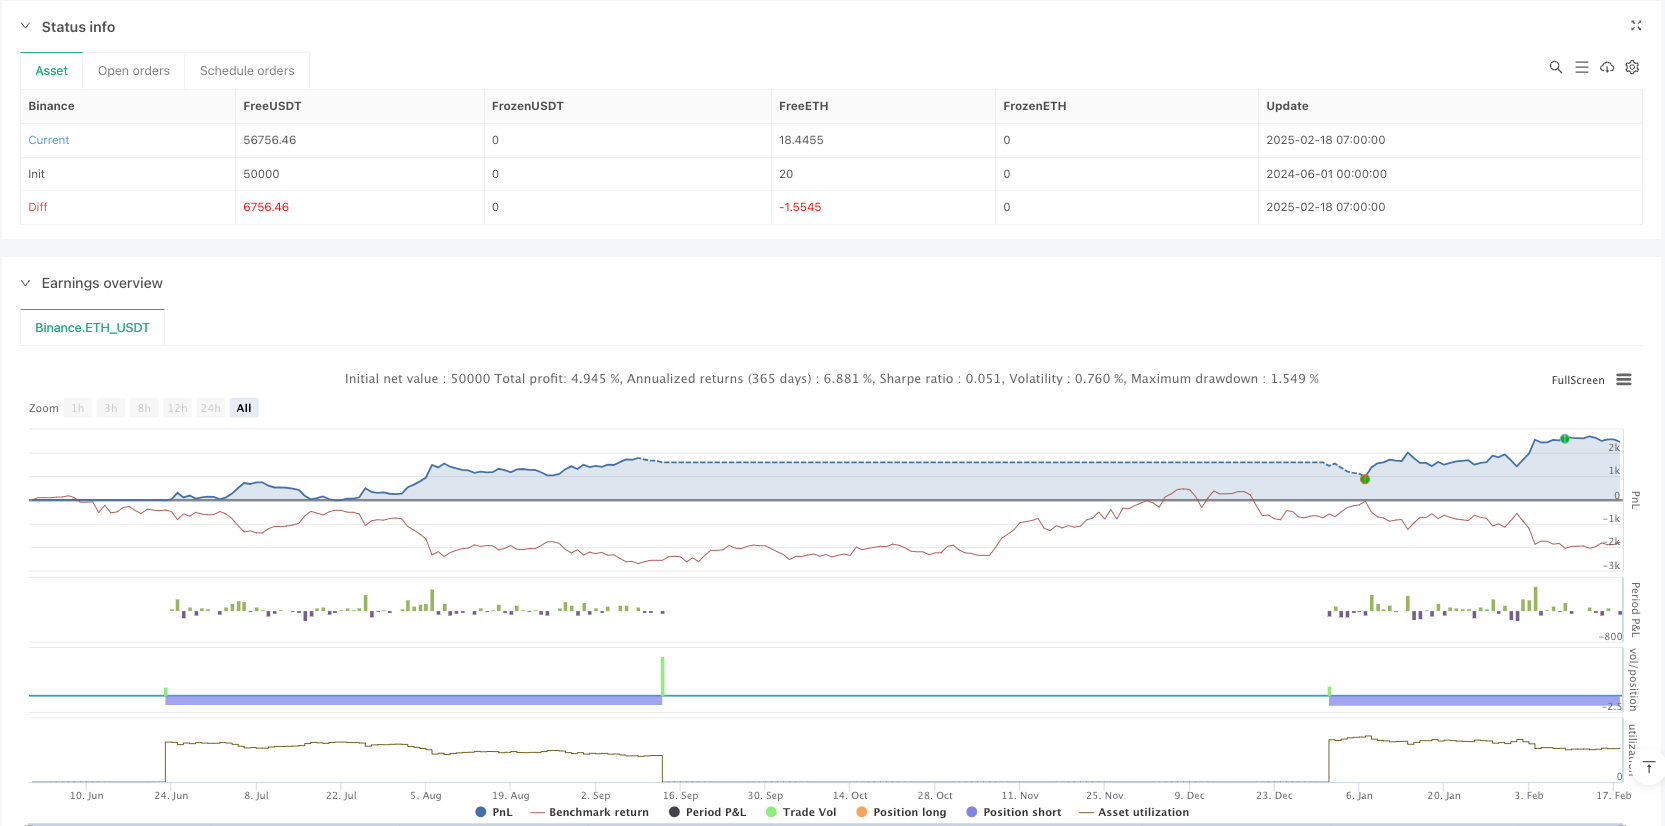
该策略是一个结合了多重技术指标的量化交易系统,通过移动平均线(MA)、相对强弱指标(RSI)和移动平均线趋同散度(MACD)三个经典技术指标的协同配合,构建了一个完整的交易信号系统。策略采用趋势跟踪与动量识别相结合的方式,在保证交易方向正确的同时,也注重入场时机的把握。同时集成了止损、止盈和追踪止损等风险控制机制,形成了一个系统化的交易策略。
|
||
|
|
|
||
|
|
#### 策略原理
|
||
|
|
策略主要基于以下三个层面构建交易信号:
|
||
|
|
1. 趋势判断:使用50日与200日双均线系统,通过金叉死叉判断大趋势方向
|
||
|
|
2. 动量确认:结合RSI超买超卖水平(70/30)与MACD金叉死叉,验证价格动量
|
||
|
|
3. 风险控制:设置2%止损、4%止盈以及1%追踪止损,构建完整的风险管理体系
|
||
|
|
|
||
|
|
具体来说,当快速均线(50日)上穿慢速均线(200日)形成金叉,同时RSI未达到超买水平且MACD形成金叉时,系统产生做多信号。反之,当出现死叉且RSI未达到超卖水平、MACD形成死叉时,系统产生做空信号。
|
||
|
|
|
||
|
|
#### 策略优势
|
||
|
|
1. 信号可靠性高:通过多重指标交叉验证,能有效过滤虚假信号
|
||
|
|
2. 趋势把握准确:采用经典的双均线系统,能较好地捕捉主要趋势
|
||
|
|
3. 风险控制完善:综合运用多种止损方式,有效控制下行风险
|
||
|
|
4. 适应性强:策略参数可调整性强,能适应不同市场环境
|
||
|
|
5. 执行明确:信号生成条件清晰,避免主观判断带来的干扰
|
||
|
|
|
||
|
|
#### 策略风险
|
||
|
|
1. 滞后性风险:移动平均线本身具有滞后性,可能错过最佳入场时机
|
||
|
|
2. 震荡市场风险:在横盘震荡市场中,可能频繁产生假突破信号
|
||
|
|
3. 参数优化风险:过度优化参数可能导致过拟合,影响策略的稳定性
|
||
|
|
4. 成本控制风险:频繁交易可能带来较高的交易成本
|
||
|
|
5. 市场环境依赖:策略在趋势明显的市场中表现更好,但在其他市场环境下效果可能不佳
|
||
|
|
|
||
|
|
#### 策略优化方向
|
||
|
|
1. 引入成交量指标:在现有信号系统中增加成交量确认,提高信号可靠性
|
||
|
|
2. 优化参数自适应:开发参数动态调整机制,提高策略对市场的适应性
|
||
|
|
3. 增加市场情绪指标:引入VIX等情绪指标,优化入场时机
|
||
|
|
4. 完善止损机制:开发更灵活的止损方案,如基于ATR的动态止损
|
||
|
|
5. 加入波动率过滤:在高波动率环境下调整仓位,优化风险收益比
|
||
|
|
|
||
|
|
#### 总结
|
||
|
|
该策略通过多重技术指标的协同配合,构建了一个相对完整的交易系统。策略在趋势明显的市场中表现较好,但仍需要根据实际市场情况进行优化调整。建议交易者在实盘使用时,先进行充分的回测验证,并根据自身风险承受能力调整参数设置。策略的核心优势在于系统化的信号生成机制和完善的风险控制体系,这使其具有较好的实战应用价值。
|
||
|
|
|
||
|
|
||
|
||
|
|
|
||
|
|
#### Overview
|
||
|
|
This strategy is a quantitative trading system that combines multiple technical indicators, integrating Moving Averages (MA), Relative Strength Index (RSI), and Moving Average Convergence Divergence (MACD) to construct a comprehensive trading signal system. The strategy combines trend following with momentum identification, ensuring both directional accuracy and optimal entry timing. It also incorporates risk control mechanisms including stop-loss, take-profit, and trailing stop, forming a systematic trading approach.
|
||
|
|
|
||
|
|
#### Strategy Principles
|
||
|
|
The strategy builds trading signals based on three levels:
|
||
|
|
1. Trend Determination: Uses 50-day and 200-day moving averages system to identify major trends through golden/death crosses
|
||
|
|
2. Momentum Confirmation: Combines RSI overbought/oversold levels (70/30) with MACD crossovers to verify price momentum
|
||
|
|
3. Risk Control: Implements 2% stop-loss, 4% take-profit, and 1% trailing stop to establish a complete risk management system
|
||
|
|
|
||
|
|
Specifically, long signals are generated when the fast MA (50-day) crosses above the slow MA (200-day), while RSI is below overbought levels and MACD forms a golden cross. Conversely, short signals occur with death crosses, RSI below oversold levels, and MACD death crosses.
|
||
|
|
|
||
|
|
#### Strategy Advantages
|
||
|
|
1. High Signal Reliability: Multiple indicator cross-validation effectively filters false signals
|
||
|
|
2. Accurate Trend Capture: Classical dual MA system effectively captures major trends
|
||
|
|
3. Comprehensive Risk Control: Multiple stop-loss methods effectively control downside risk
|
||
|
|
4. Strong Adaptability: Strategy parameters are highly adjustable to different market conditions
|
||
|
|
5. Clear Execution: Clear signal generation conditions avoid subjective judgment interference
|
||
|
|
|
||
|
|
#### Strategy Risks
|
||
|
|
1. Lag Risk: Moving averages inherently lag, potentially missing optimal entry points
|
||
|
|
2. Sideways Market Risk: May generate frequent false breakout signals in ranging markets
|
||
|
|
3. Parameter Optimization Risk: Over-optimization may lead to overfitting, affecting strategy stability
|
||
|
|
4. Cost Control Risk: Frequent trading may incur high transaction costs
|
||
|
|
5. Market Environment Dependency: Strategy performs better in trending markets but may underperform in other conditions
|
||
|
|
|
||
|
|
#### Strategy Optimization Directions
|
||
|
|
1. Incorporate Volume Indicators: Add volume confirmation to existing signal system
|
||
|
|
2. Optimize Parameter Adaptation: Develop dynamic parameter adjustment mechanisms
|
||
|
|
3. Add Market Sentiment Indicators: Introduce VIX and other sentiment indicators
|
||
|
|
4. Enhance Stop-Loss Mechanism: Develop more flexible stop-loss solutions like ATR-based stops
|
||
|
|
5. Add Volatility Filters: Adjust positions in high volatility environments
|
||
|
|
|
||
|
|
#### Summary
|
||
|
|
This strategy constructs a relatively complete trading system through the synergy of multiple technical indicators. It performs well in trending markets but requires optimization based on actual market conditions. Traders should conduct thorough backtesting before live implementation and adjust parameters according to their risk tolerance. The core advantages lie in its systematic signal generation mechanism and comprehensive risk control system, making it valuable for practical application.[/trans]
|
||
|
|
|
||
|
|
|
||
|
|
|
||
|
|
> Source (PineScript)
|
||
|
|
|
||
|
|
``` pinescript
|
||
|
|
/*backtest
|
||
|
|
start: 2024-06-01 00:00:00
|
||
|
|
end: 2025-02-18 08:00:00
|
||
|
|
period: 1h
|
||
|
|
basePeriod: 1h
|
||
|
|
exchanges: [{"eid":"Binance","currency":"ETH_USDT"}]
|
||
|
|
*/
|
||
|
|
|
||
|
|
// This Pine Script™ code is subject to the terms of the Mozilla Public License 2.0 at https://mozilla.org/MPL/2.0/
|
||
|
|
// © EthioTrader
|
||
|
|
|
||
|
|
//@version=5
|
||
|
|
strategy("Optimal Multi-Indicator Strategy", overlay=true, initial_capital=10000, default_qty_type=strategy.percent_of_equity, default_qty_value=10, commission_type=strategy.commission.percent, commission_value=0.1)
|
||
|
|
|
||
|
|
// ===== Input Parameters =====
|
||
|
|
// Moving Averages
|
||
|
|
fastMA = ta.sma(close, 50)
|
||
|
|
slowMA = ta.sma(close, 200)
|
||
|
|
plot(fastMA, "Fast MA", color=color.green)
|
||
|
|
plot(slowMA, "Slow MA", color=color.red)
|
||
|
|
|
||
|
|
// RSI
|
||
|
|
rsiLength = input(14, "RSI Length")
|
||
|
|
rsiOverbought = input(70, "RSI Overbought")
|
||
|
|
rsiOversold = input(30, "RSI Oversold")
|
||
|
|
rsi = ta.rsi(close, rsiLength)
|
||
|
|
|
||
|
|
// MACD
|
||
|
|
[macdLine, signalLine, _] = ta.macd(close, 12, 26, 9)
|
||
|
|
|
||
|
|
// Risk Management
|
||
|
|
stopLossPerc = input(2.0, "Stop Loss (%)") / 100
|
||
|
|
takeProfitPerc = input(4.0, "Take Profit (%)") / 100
|
||
|
|
trailingStopPerc = input(1.0, "Trailing Stop (%)") / 100
|
||
|
|
|
||
|
|
// ===== Strategy Logic =====
|
||
|
|
// Trend Condition: Golden Cross (Fast MA > Slow MA)
|
||
|
|
bullishTrend = ta.crossover(fastMA, slowMA)
|
||
|
|
bearishTrend = ta.crossunder(fastMA, slowMA)
|
||
|
|
|
||
|
|
// Momentum Condition: RSI and MACD
|
||
|
|
bullishMomentum = rsi < rsiOverbought and ta.crossover(macdLine, signalLine)
|
||
|
|
bearishMomentum = rsi > rsiOversold and ta.crossunder(macdLine, signalLine)
|
||
|
|
|
||
|
|
// Entry Signals
|
||
|
|
longCondition = bullishTrend and bullishMomentum
|
||
|
|
shortCondition = bearishTrend and bearishMomentum
|
||
|
|
|
||
|
|
// Exit Signals
|
||
|
|
trailingStop = strategy.position_avg_price * (1 - trailingStopPerc)
|
||
|
|
exitLong = ta.crossunder(close, trailingStop) or (close >= strategy.position_avg_price * (1 + takeProfitPerc))
|
||
|
|
exitShort = ta.crossover(close, trailingStop) or (close <= strategy.position_avg_price * (1 - takeProfitPerc))
|
||
|
|
|
||
|
|
// ===== Execute Orders =====
|
||
|
|
if (longCondition)
|
||
|
|
strategy.entry("Long", strategy.long)
|
||
|
|
strategy.exit("Exit Long", "Long", stop=strategy.position_avg_price * (1 - stopLossPerc), limit=strategy.position_avg_price * (1 + takeProfitPerc), trail_price=trailingStop, trail_offset=trailingStopPerc * close)
|
||
|
|
|
||
|
|
if (shortCondition)
|
||
|
|
strategy.entry("Short", strategy.short)
|
||
|
|
strategy.exit("Exit Short", "Short", stop=strategy.position_avg_price * (1 + stopLossPerc), limit=strategy.position_avg_price * (1 - takeProfitPerc), trail_price=trailingStop, trail_offset=trailingStopPerc * close)
|
||
|
|
|
||
|
|
// ===== Plotting =====
|
||
|
|
plotshape(series=longCondition, title="Buy Signal", location=location.belowbar, color=color.green, style=shape.labelup, text="BUY")
|
||
|
|
plotshape(series=shortCondition, title="Sell Signal", location=location.abovebar, color=color.red, style=shape.labeldown, text="SELL")
|
||
|
|
|
||
|
|
|
||
|
|
```
|
||
|
|
|
||
|
|
> Detail
|
||
|
|
|
||
|
|
https://www.fmz.com/strategy/482876
|
||
|
|
|
||
|
|
> Last Modified
|
||
|
|
|
||
|
|
2025-02-20 16:10:54
|