156 lines
9.1 KiB
Markdown
156 lines
9.1 KiB
Markdown

|
|
||
|
|
> Name
|
||
|
|
|
||
|
|
多重均线支撑位假突破策略结合ATR止损系统-Multi-SMA-Support-Level-False-Breakout-Strategy-with-ATR-Stop-Loss-System
|
||
|
|
|
||
|
|
> Author
|
||
|
|
|
||
|
|
ChaoZhang
|
||
|
|
|
||
|
|
> Strategy Description
|
||
|
|
|
||
|
|
|
||
|
|
|
||
|
|
[trans]
|
||
|
|
#### 概述
|
||
|
|
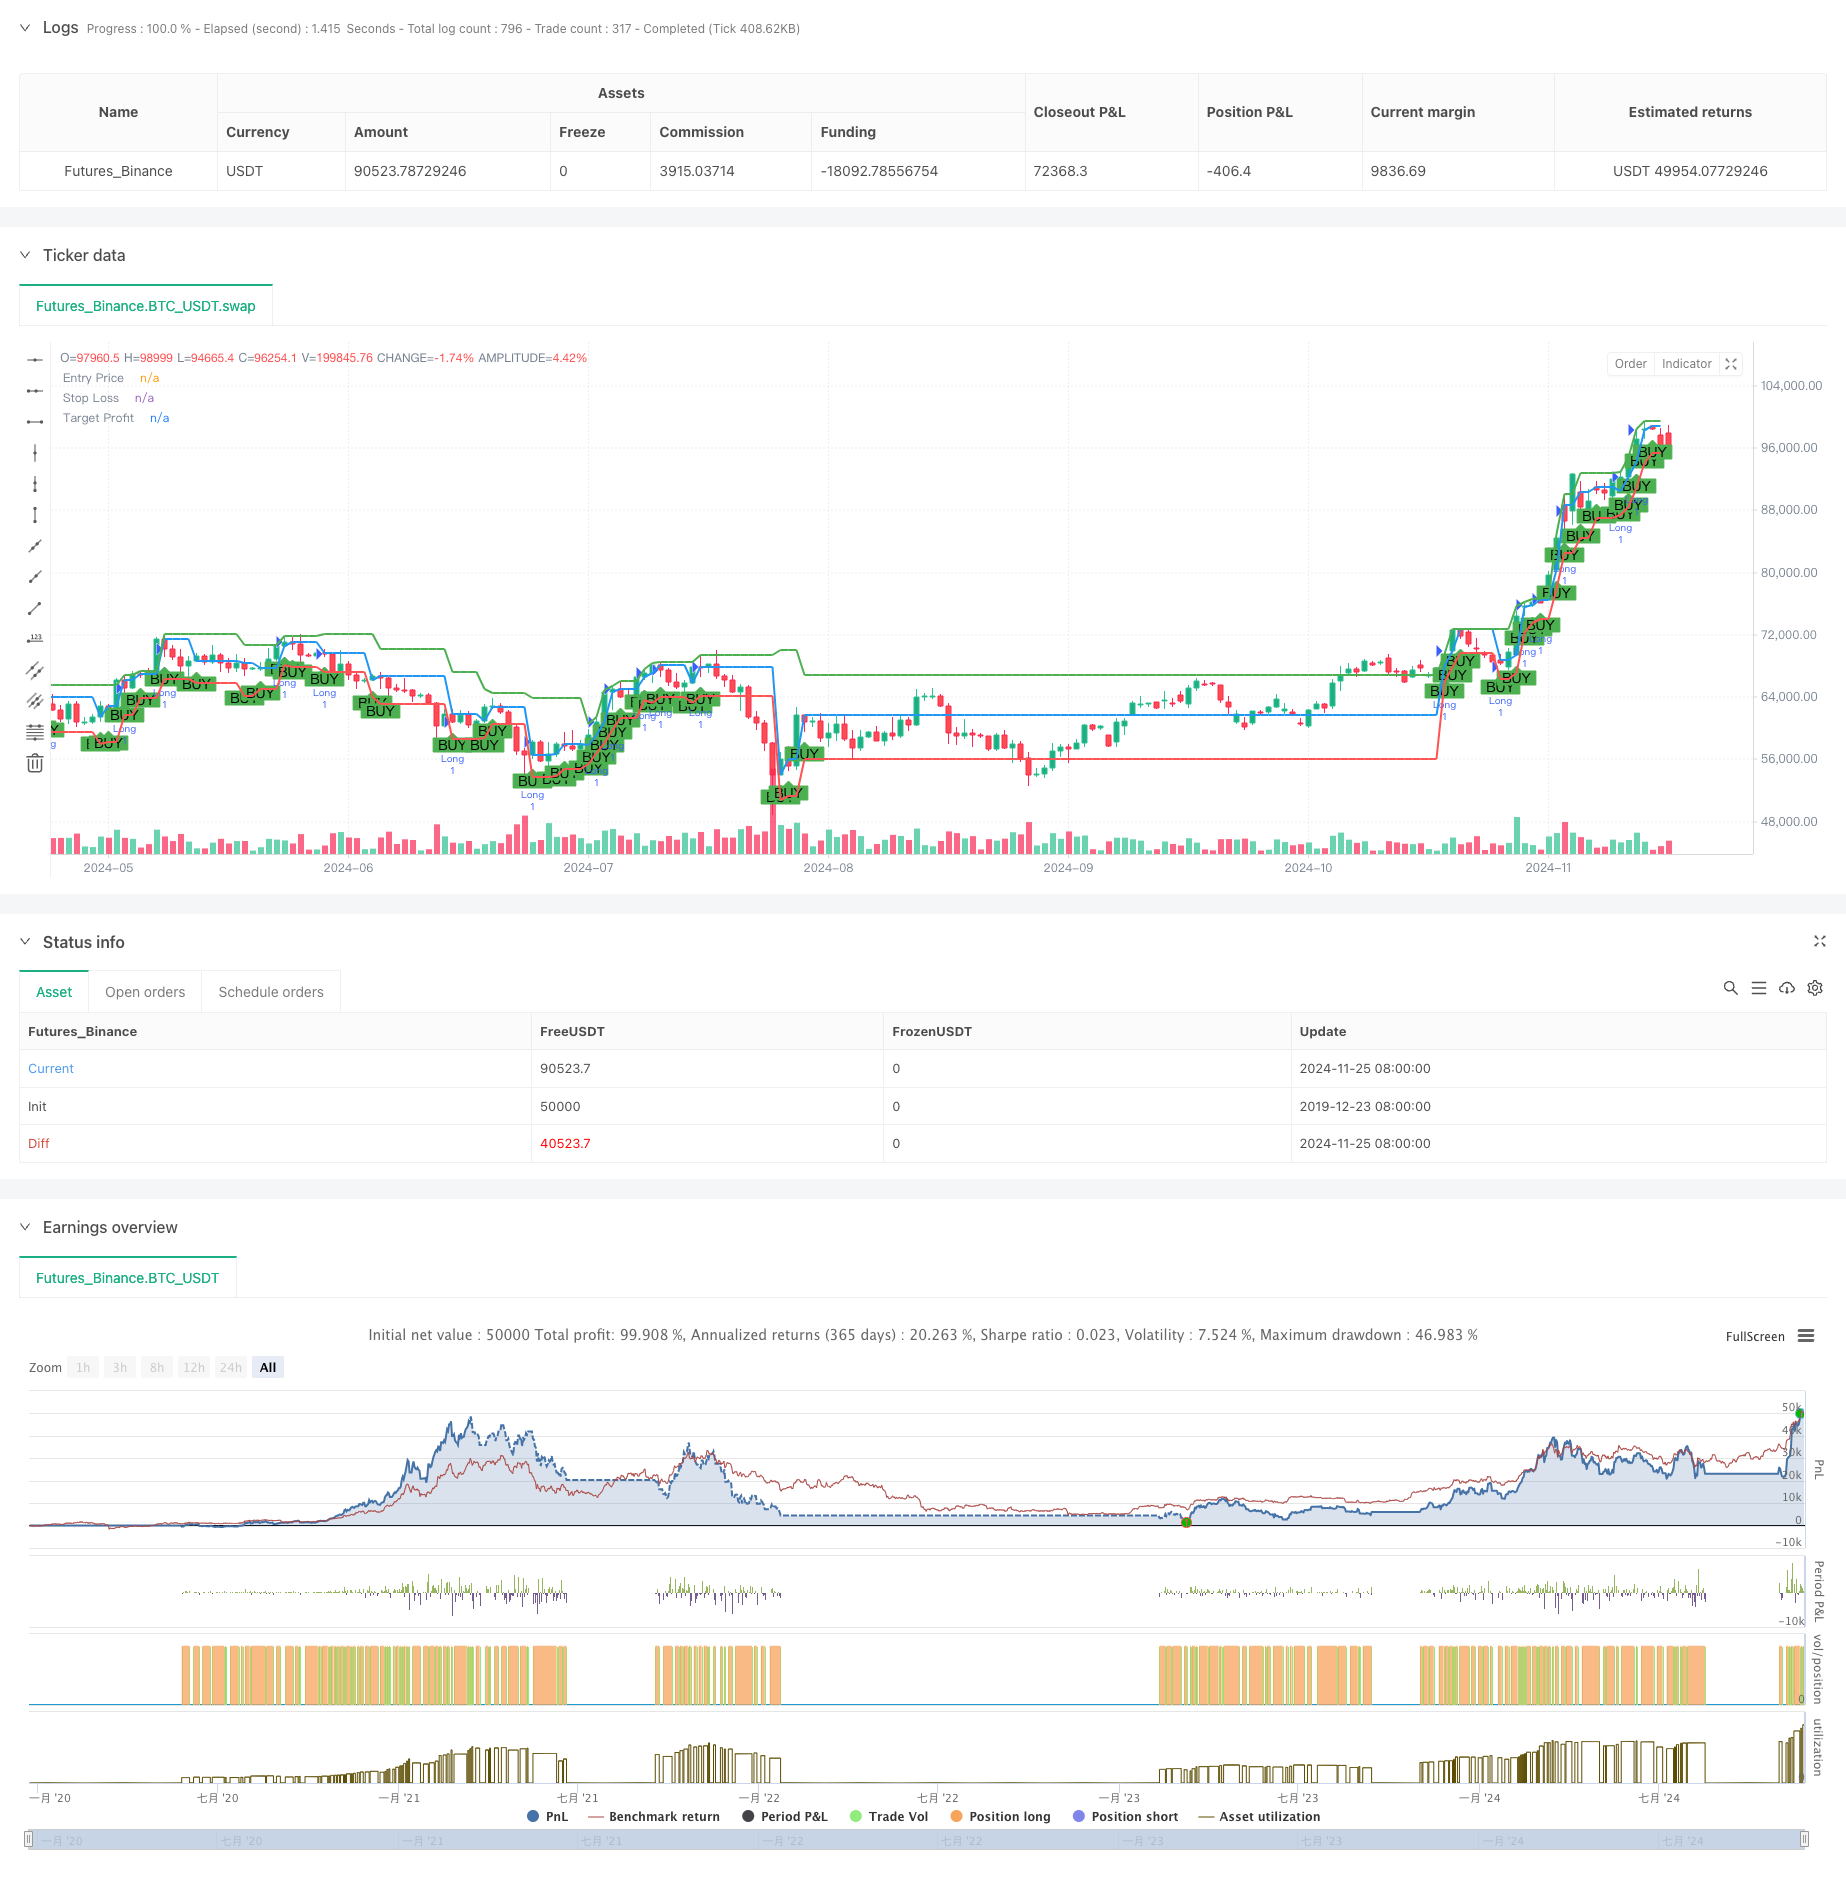
该策略是一个基于均线趋势判断和支撑位假突破的交易系统。策略通过50周期和200周期简单移动平均线判断市场趋势,结合支撑位的假突破形态产生交易信号,并使用ATR(平均真实波幅)指标动态设置止损位置,在突破点位设置获利目标。这种策略充分利用了市场的趋势特性和价格运动规律,通过捕捉假突破后的反弹机会来获取收益。
|
||
|
|
|
||
|
|
#### 策略原理
|
||
|
|
策略的核心逻辑包含以下几个关键要素:
|
||
|
|
1. 趋势判断:使用50周期和200周期均线的位置关系判断市场趋势,当短期均线位于长期均线之上时,确认上升趋势。
|
||
|
|
2. 支撑位计算:通过枢轴点公式计算支撑位,利用前一周期的最高价、最低价和收盘价的加权平均。
|
||
|
|
3. 假突破确认:当价格在上升趋势中短暂跌破支撑位后又收于支撑位之上时,形成做多信号。
|
||
|
|
4. 风险管理:使用14周期ATR计算动态止损位置,确保在市场波动加剧时扩大止损范围。
|
||
|
|
5. 获利目标:通过计算前10个周期的最高价作为获利目标,保证盈利空间充足。
|
||
|
|
|
||
|
|
#### 策略优势
|
||
|
|
1. 趋势跟随:策略通过均线系统确保在主趋势方向交易,提高胜率。
|
||
|
|
2. 动态风险控制:采用ATR动态调整止损位置,适应不同市场环境。
|
||
|
|
3. 清晰的交易信号:支撑位假突破形态具有明确的判断标准,减少主观判断。
|
||
|
|
4. 合理的风险收益比:通过设置动态止损和基于历史高点的获利目标,确保良好的风险收益比。
|
||
|
|
5. 系统化操作:策略逻辑清晰,易于程序化实现和回测验证。
|
||
|
|
|
||
|
|
#### 策略风险
|
||
|
|
1. 假信号风险:在震荡市场中可能产生较多假突破信号,增加交易成本。
|
||
|
|
2. 趋势转折风险:均线系统在趋势转折点反应较慢,可能造成入场时机滞后。
|
||
|
|
3. 止损幅度风险:ATR止损在波动率突然放大时可能造成较大损失。
|
||
|
|
4. 获利目标设置风险:固定周期的历史最高价可能不能准确反映当前市场状况。
|
||
|
|
|
||
|
|
#### 策略优化方向
|
||
|
|
1. 增加筛选条件:可以添加成交量确认指标,提高信号可靠性。
|
||
|
|
2. 优化均线参数:根据不同市场特征调整均线周期,提高趋势判断准确性。
|
||
|
|
3. 改进止损方法:可以结合支撑位置设置复合式止损,提高止损的有效性。
|
||
|
|
4. 动态获利目标:引入动态的获利目标计算方法,更好地适应市场变化。
|
||
|
|
5. 加入时间过滤:增加交易时间窗口的筛选,避免在不利时段交易。
|
||
|
|
|
||
|
|
#### 总结
|
||
|
|
多重均线支撑位假突破策略是一个结合了趋势跟随和价格形态的完整交易系统。通过均线系统的趋势判断和支撑位假突破的形态识别,配合ATR动态止损,构建了一个风险可控的交易策略。该策略的核心优势在于系统化的操作流程和清晰的风险管理方法。通过持续优化和改进,策略可以更好地适应不同市场环境,提高交易效果。在实盘应用中,建议投资者根据自身风险承受能力和市场特征,对策略参数进行针对性调整。
|
||
|
|
|
||
|
|
||
|
||
|
|
|
||
|
|
#### Overview
|
||
|
|
This strategy is a trading system based on moving average trend determination and support level false breakout patterns. The strategy uses 50-period and 200-period simple moving averages to determine market trends, combines support level false breakout patterns to generate trading signals, and uses the ATR (Average True Range) indicator to dynamically set stop-loss positions while setting profit targets at breakout points. This strategy fully utilizes market trend characteristics and price movement patterns to capture opportunities for profit through rebounds after false breakouts.
|
||
|
|
|
||
|
|
#### Strategy Principles
|
||
|
|
The core logic of the strategy includes the following key elements:
|
||
|
|
1. Trend Determination: Uses the relative position of 50-period and 200-period moving averages to determine market trends, confirming an uptrend when the short-term moving average is above the long-term moving average.
|
||
|
|
2. Support Level Calculation: Calculates support levels using pivot point formula, utilizing weighted averages of the previous period's high, low, and closing prices.
|
||
|
|
3. False Breakout Confirmation: Generates long signals when price briefly breaks below support during an uptrend and then closes above it.
|
||
|
|
4. Risk Management: Uses 14-period ATR to calculate dynamic stop-loss positions, ensuring wider stops during increased market volatility.
|
||
|
|
5. Profit Targets: Calculates profit targets using the highest price of the previous 10 periods to ensure adequate profit potential.
|
||
|
|
|
||
|
|
#### Strategy Advantages
|
||
|
|
1. Trend Following: The strategy ensures trading in the direction of the main trend through the moving average system, improving win rates.
|
||
|
|
2. Dynamic Risk Control: Uses ATR to dynamically adjust stop-loss positions, adapting to different market environments.
|
||
|
|
3. Clear Trading Signals: Support level false breakout patterns have clear identification criteria, reducing subjective judgment.
|
||
|
|
4. Reasonable Risk-Reward Ratio: Ensures good risk-reward ratios through dynamic stop-losses and historically-based profit targets.
|
||
|
|
5. Systematic Operation: Clear strategy logic, easy to implement programmatically and backtest.
|
||
|
|
|
||
|
|
#### Strategy Risks
|
||
|
|
1. False Signal Risk: May generate numerous false breakout signals in ranging markets, increasing trading costs.
|
||
|
|
2. Trend Reversal Risk: Moving average systems react slowly at trend reversal points, potentially causing delayed entries.
|
||
|
|
3. Stop-Loss Range Risk: ATR stops may result in larger losses when volatility suddenly increases.
|
||
|
|
4. Profit Target Setting Risk: Fixed-period historical highs may not accurately reflect current market conditions.
|
||
|
|
|
||
|
|
#### Strategy Optimization Directions
|
||
|
|
1. Add Filtering Conditions: Can add volume confirmation indicators to improve signal reliability.
|
||
|
|
2. Optimize Moving Average Parameters: Adjust moving average periods based on different market characteristics to improve trend determination accuracy.
|
||
|
|
3. Improve Stop-Loss Methods: Can implement composite stop-losses combining support levels to improve stop-loss effectiveness.
|
||
|
|
4. Dynamic Profit Targets: Introduce dynamic profit target calculation methods to better adapt to market changes.
|
||
|
|
5. Add Time Filters: Include trading time window screening to avoid trading during unfavorable periods.
|
||
|
|
|
||
|
|
#### Summary
|
||
|
|
The Multi-SMA Support Level False Breakout Strategy is a complete trading system combining trend following and price patterns. Through trend determination using moving average systems and support level false breakout pattern recognition, coupled with ATR dynamic stop-losses, it constructs a risk-controllable trading strategy. The core advantages of this strategy lie in its systematic operation process and clear risk management methods. Through continuous optimization and improvement, the strategy can better adapt to different market environments and improve trading results. In live trading applications, investors are advised to adjust strategy parameters based on their risk tolerance and market characteristics.[/trans]
|
||
|
|
|
||
|
|
|
||
|
|
|
||
|
|
> Source (PineScript)
|
||
|
|
|
||
|
|
``` pinescript
|
||
|
|
/*backtest
|
||
|
|
start: 2019-12-23 08:00:00
|
||
|
|
end: 2024-11-26 00:00:00
|
||
|
|
period: 1d
|
||
|
|
basePeriod: 1d
|
||
|
|
exchanges: [{"eid":"Futures_Binance","currency":"BTC_USDT"}]
|
||
|
|
*/
|
||
|
|
|
||
|
|
//@version=5
|
||
|
|
strategy("False Break Trading Strategy", overlay=true)
|
||
|
|
|
||
|
|
// Define inputs for strategy parameters
|
||
|
|
sma50Length = input.int(50, title="SMA 50 Length")
|
||
|
|
sma200Length = input.int(200, title="SMA 200 Length")
|
||
|
|
atrLength = input.int(14, title="ATR Length")
|
||
|
|
lookbackPeriod = input.int(10, title="Swing High Lookback Period")
|
||
|
|
|
||
|
|
// Calculate SMAs
|
||
|
|
sma50 = ta.sma(close, sma50Length)
|
||
|
|
sma200 = ta.sma(close, sma200Length)
|
||
|
|
|
||
|
|
// Calculate ATR
|
||
|
|
atr = ta.atr(atrLength)
|
||
|
|
|
||
|
|
// Check if we are in an uptrend
|
||
|
|
isUptrend = sma50 > sma200
|
||
|
|
|
||
|
|
// Calculate Pivot, Support, and Target Profit (Swing High)
|
||
|
|
pivot = (high[1] + low[1] + close[1]) / 3
|
||
|
|
support = (2 * pivot) - high[1]
|
||
|
|
swingHigh = ta.highest(high, lookbackPeriod)
|
||
|
|
|
||
|
|
// Create signals for entry
|
||
|
|
var float entryPrice = na
|
||
|
|
var float stopLoss = na
|
||
|
|
var float targetProfit = na
|
||
|
|
longCondition = isUptrend and low[1] < support and close > support
|
||
|
|
|
||
|
|
if (longCondition)
|
||
|
|
entryPrice := open
|
||
|
|
stopLoss := low - atr
|
||
|
|
targetProfit := swingHigh
|
||
|
|
|
||
|
|
// Plot signals and lines on chart
|
||
|
|
plotshape(longCondition, title="Buy Signal", location=location.belowbar, color=color.green, style=shape.labelup, text="BUY")
|
||
|
|
|
||
|
|
// Plot levels for entry, stop loss, and target
|
||
|
|
plot(entryPrice, title="Entry Price", color=color.blue, linewidth=2, style=plot.style_linebr)
|
||
|
|
plot(stopLoss, title="Stop Loss", color=color.red, linewidth=2, style=plot.style_linebr)
|
||
|
|
plot(targetProfit, title="Target Profit", color=color.green, linewidth=2, style=plot.style_linebr)
|
||
|
|
|
||
|
|
// Backtest: Simulate exit points for the strategy
|
||
|
|
if (longCondition)
|
||
|
|
strategy.entry("Long", strategy.long)
|
||
|
|
if (na(stopLoss) == false and na(targetProfit) == false)
|
||
|
|
strategy.exit("Take Profit/Stop Loss", "Long", stop=stopLoss, limit=targetProfit)
|
||
|
|
|
||
|
|
```
|
||
|
|
|
||
|
|
> Detail
|
||
|
|
|
||
|
|
https://www.fmz.com/strategy/473148
|
||
|
|
|
||
|
|
> Last Modified
|
||
|
|
|
||
|
|
2024-11-27 16:17:17
|